
U.S. GEOLOGICAL SURVEY
Water-Resources Investigation Report 03-4126
Honolulu, Hawaii 2003
Figures are in pdf format. Download a free copy of the latest version of Adobe Reader.
The U.S. Territory of Guam, which lies in the western Pacific Ocean near latitude 13°28'N and longitude 144°45'E (fig. 1), is the largest (211 mi2) and southernmost of the islands in the Mariana chain. Ground water supplies about 80 percent of the drinking water for the island's 150,000 residents and nearly one million visitors per year. In northern Guam, water is obtained from wells that tap the upper part of a fresh ground-water lens in an aquifer composed mainly of limestone. About 180 wells, nearly all in the north, withdraw about 35 Mgal/d of water with chloride concentrations ranging from 6 to 585 mg/L. In southern Guam, the main source of freshwater is from surface water that runs off the weathered volcanic rocks that are exposed over much of the area. About 9.9 Mgal/d of freshwater is obtained using surface reservoirs. The island's freshwater resources are adequate to meet current (2003) needs, but future demands will eventually be higher. To better understand the hydrology of the island, the U.S. Geological Survey (USGS) entered into a cooperative study with the Water and Environmental Research Institute of the Western Pacific (WERI) at the University of Guam. The objective of the study was to provide a better understanding of the water resources of the island through analysis of data collected by the USGS on Guam.
This report provides a description of the general hydrologic principles of the island's ground-water systems, as well as of the rainfall and geology of Guam. Hydrologic data described in the report include water levels, chloride concentrations, and pumpage from ground-water wells and streamflow data from southern Guam.
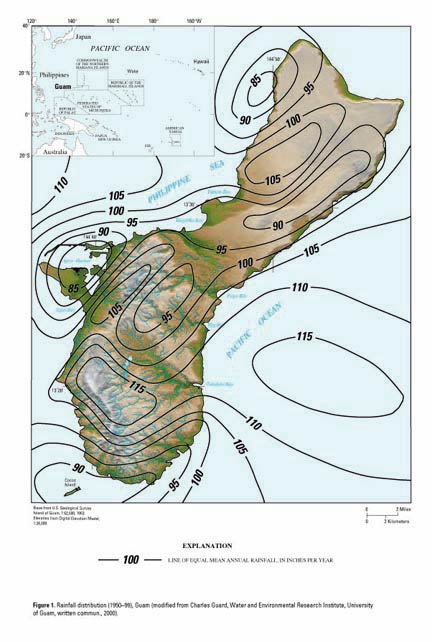
Figure 1. Rainfall distribution (1950-99), Guam (modified from Charles Guard, Water and Environmental Research Institute, University of Guam, written commun., 2000).
The source of all freshwater on Guam is rainfall, which averages about 85 to 115 in/yr (Charles Guard, University of Guam, written commun., 2000). Although the island is relatively small and the mountains are low (1,300 ft or less), a significant orographic effect causes rainfall totals from recording stations to differ by as much as 30 in/yr (fig. 1). Guam has distinct wet and dry seasons. About 70 percent of the total annual rainfall is recorded during the wet season (July through December) with the rest falling during the dry season (January through June). The heaviest rainfall is usually associated with the passage of typhoons during the wet season but only about 12 percent of average annual rainfall can be attributed to typhoons passing within 180 nautical mi of Guam (Lander, 1994). Exceptionally dry years recur about once every 4 years in correlation with episodes of El Niñ Southern Oscillation (ENSO) in the Pacific (Lander, 1994).
Volcanic rock forms the foundation of the island and is exposed over about 35 percent of the island's surface, predominantly in southern Guam (fig. 2). Neogene limestone overlies the volcanic rock and is exposed over about 60 percent of the island, mainly in northern Guam. The high porosity of the limestone gives it high permeability, whereas the texture and poor sorting of the volcanic basement material usually gives it much lower permeability. All major limestone units have undergone pervasive meteoric diagenesis, thus most porosity and permeability is secondary. Faults transect the island throughout, complicating the structure and permeability of the rock units. Age determinations of Guam geologic units are based mainly on fossil remains and correlations with other islands in the Pacific.
Seven major geologic units are shown in figure 2. The Facpi and Alutom Formations contain the oldest exposed rocks, are of Eocene and Oligocene age, and underlie all other exposed rock units (Tracey and others, 1964; Reagan and Meijer, 1984). These units crop out in the highlands from central to southern Guam and in the highest elevations of northern Guam. These exposures cover about 20 percent of the surface of the island. The maximum thickness of each unit is at least 1,000 ft (Reagan and Meijer, 1984). The formations contain a series of pillow basalts and water-laid pyroclastic rocks of volcanic origin ranging from tuffaceous shale to coarse boulder conglomerate and breccia. The permeability of the formations is considered low (Ward and others, 1965).
The Umatac Formation of Oligocene - late Miocene age (Tracey and others, 1964) is separated from the underlying Alutom Formation by a structural unconformity. The Umatac Formation crops out over about 15 percent of the land surface, principally in the south-central highlands and plateaus. The unit thickens to the south away from the Alutom Formation and is at least 1,050 ft thick along the southwest side of the island (Tracey and others, 1964). Here, the Umatac Formation is composed (from oldest to youngest) of about 250 ft of reef and forereef limestone (Maemong Limestone Member), about 750 ft of tuff breccia and volcanic conglomerate (Bolanos Pyroclastic Member, Schroeder Flow Member), and about 50 ft of basalt flows (Dandan Flow Member) (Meijer and others, 1983; Reagan and Meijer, 1984). The permeability of the formation is considered low (Ward and others, 1965).
Three limestone units, which locally overlie the Alutom and Umatac Formations, are grouped together as Older Limestone for this report. These three units, from Miocene to Pliocene age, are the Bonya and Alifan Limestones, and the Janum Formation (fig. 2). These three units are facies distinctions of limestones of the same age. Together these units cover only about 5 percent of the islands surface and individually the units are each only about 70 to 200 ft thick. The Bonya Limestone (periplatform and embayment facies of mostly jointed and fractured detrital limestone) and the Janum Formation (deep forereef facies of mostly tuffaceous limestone) are considered permeable but contain little water because of the limited extent of the deposits (Ward and others, 1965). The Alifan Limestone (shallow reef margin facies of poorly to well-consolidated detrital limestone and conglomeritic clay marl [Talisay Member]) is moderately to highly permeable and feeds some perennial contact springs in southern Guam.
The Barrigada Limestone, of late Miocene to Pliocene age, covers about 9 percent of the islands surface but forms the bulk of the aquifer underlying northern Guam. This formation consists of fine-grained, pure foraminiferal-detrital limestone with a thickness of greater than 540 ft (Tracey and others, 1964). The formation supplies most of the wells in northern Guam and the permeability is high (Ward and others, 1965; Contractor and Srivastava, 1990; Jocson and others, 2002). In places, the Barrigada Limestone grades upward and outward into the overlying Mariana Limestone.
The Mariana Limestone is of Pliocene to Pleistocene age and is the most extensive unit at the surface. The Mariana Limestone comprises about 45 percent of the surface area, covering most of the northern half and parts of southeast Guam. The maximum thickness of the formation is at least 500 ft and may thin to zero inland. The Mariana Limestone is composed of reef and lagoonal limestone containing a wide range of lithologies (Tracey and others, 1964). The limestone is clay-rich near the older volcanic uplands. The permeability of the deposits without clay is considered very high due to the presence of many solution fissures and channels (Ward and others, 1965; Contractor and Srivastava, 1990; Jocson and others, 2002). The permeability of the clay-rich deposits is considered moderate to high.
Minor reef beach deposits, reef limestone, and alluvium are of Holocene age. These deposits cover about 7 percent of the surface of Guam, and may be as much as 200 ft thick at the mouths of some rivers. The beach deposits are composed of poorly consolidated sediments, mostly calcareous sand and gravel thrown onto beaches by waves but some deposits of volcanic sand can be found where streams drain volcanic uplands (Tracey and others, 1964). The Merizo Limestone is a reef limestone up to 12 ft thick. Deposits of alluvial clay fill stream valleys and cover the inner parts of coastal lowlands. The overall permeability of alluvial deposits may be moderate but hydrologic information is limited (see Ayers and Clayshulte, 1983).
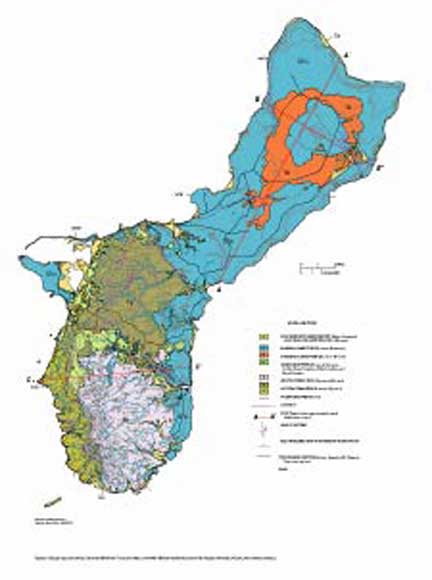
Figure 2. Geologic map and sections, Guam (modified from Tracey and others, 1964 with additional modifications from Galt Siegrist, University of Guam, 2001, written commun.).
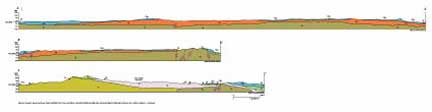
Figure 2. Geologic map and sections, Guam (modified from Tracey and others, 1964 with additional modifications from Galt Siegrist, University of Guam, 2001, written commun.).--Continued
Rainfall can infiltrate the soil, return to the atmosphere by evapotranspiration, or runoff to streams. The amount of runoff is determined by rainfall, topography, soil type, and land use. Runoff is typically high where rainfall is high and slopes are steep and where rain falls on less permeable land surfaces. On Guam, streams are present only in the south where low-permeability volcanic rocks slow the infiltration of rainwater and allow ground-water discharge to streams. In northern Guam, the exposed limestone at the surface allows virtually all rainfall to infiltrate. Evapotranspiration is the loss of water to the atmosphere by the combination of transpiration by plants and direct evaporation from land and water surfaces. Water stored in the soil is available to plants or can eventually flow downward to recharge the ground-water system.
In Guam, the major fresh ground-water systems are below the lowest water table and are freshwater-lens systems. Minor perched systems can exist above the lowest water table. Ground water flows from areas of high water level to areas of low water level, which in general, is from the interior of the island to the coast.
On oceanic islands such as Guam, freshwater commonly forms a body of water called a freshwater lens that floats on saltwater and is separated from the saltwater by a transition zone of brackish water (fig. 3). The freshwater, brackish water, and saltwater are all part of the freshwater-lens system. Salinity in a freshwater-lens system is gradational, from an upper freshwater core through the underlying transition zone to saltwater. A chloride concentration of 250 mg/L is the maximum contaminant level (MCL) for drinking water recommended as a secondary standard by the USEPA (U.S. Environmental Protection Agency, 1991). Secondary standards are not mandatory requirements, but instead establish limits for constituents that may affect the aesthetic qualities of drinking water (taste and odor, for example). In this report, freshwater is defined as water having a chloride concentration less than or equal to 250 mg/L. Seawater has a chloride concentration around 19,200 mg/L (Thurman, 1990).
The Ghyben-Herzberg principle is commonly used to estimate the depth where brackish water in the transition zone has a salinity about 50 percent that of seawater. The Ghyben-Herzberg principle describes a freshwater-saltwater relation for conditions in which the two fluids do not mix (no transition zone) and the freshwater flow is horizontal. For these conditions, the freshwater-lens thickness below sea level is directly proportional to the height of the top of freshwater above sea level. In principle, at a place where the water table stands 1 foot above sea level, for example, 40 ft of freshwater will be below sea level, and the freshwater lens will thus be 41 ft thick. This relation exists because seawater is about one-fortieth denser than freshwater. In a real freshwater-lens system, mixing creates a transition zone and reduces the amount of freshwater above the transition zone. In some places, especially near the coast, where freshwater is extensively mixed with saltwater, brackish water may exist immediately below the water table.
Transition-zone thickness depends on the extent of mixing between freshwater and saltwater and is generally several tens of feet thick in northern Guam. Mixing in the transition zone results from tidal and pumping fluctuations superimposed on the gravity-driven flow of freshwater toward the shore. Under conditions of steady recharge and no pumping, the lens would ultimately have a fixed size. In reality, rainfall is episodic and seasonal, and lens volume fluctuates naturally with time. Ground water discharges continuously throughout the year, but the lens shrinks during dry periods when recharge diminishes or ceases, and expands when recharge increases.
Figure 3. Diagram showing generalized ground-water occurrence, northern Guam.
On Guam, freshwater-lens systems are found in limestone and volcanic rocks but the most important sources of ground water are from the freshwater parts of these systems in the high-permeability limestone rocks of northern Guam (fig. 4). In the most permeable limestone, the water table is no more than a few feet above sea level, and the slope of the water table is nearly flat. The freshwater lens in these rocks is relatively thin and is commonly referred to as "basal" water after similar occurrences in Hawaii (Meinzer, 1930). Wells and springs in this part of the system generally have water-level altitudes less than 8 ft. In some areas, the freshwater lens is thick enough to extend into the low-permeability volcanic rocks underlying the limestone. The freshwater in the limestone is commonly referred to as "para-basal" water where it is in contact with the underlying poorly permeable volcanic basement (Mink, 1974). Ward and others (1965) recognized that the low-permeability volcanic rocks must be saturated below the water table. Therefore, ground water in the limestone and the underlying volcanic rocks is all part of a freshwater-lens system but the depth of freshwater in the volcanics is unknown. Figure 4 shows wells in which the theoretical thickness of the freshwater lens (40 times the water level) extends into the volcanic rocks, the extent of which was delineated by Vann for a Master's thesis project (David Vann, University of Guam, written commun., 2000). Water levels and springs as much as several hundred feet in altitude are where the freshwater-lens system is vertically extensive in low-permeability volcanic rocks (fig. 3). Ground water in these systems can also be considered basal ground water using Meinzers (1930) original definition of basal ground water. In such systems, where low-permeability rocks cause significant vertical hydraulic-head gradients, the Ghyben-Herzberg principle does not accurately predict the depth where the brackish water in the transition zone has a salinity about 50 percent of seawater. Although the depth to saltwater has not been measured in wells in these systems, where flow is downward, the freshwater lens is likely thinner than predicted by the Ghyben-Herzberg principle.
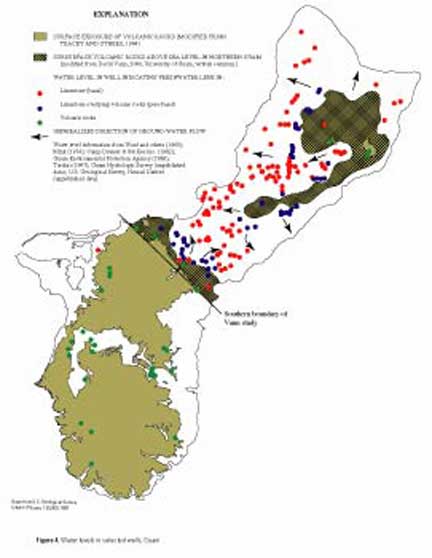
Figure 4. Water levels in selected wells, Guam.
Freshwater-lens systems are recharged by direct infiltration of rainfall, and by inflow from perched ground-water systems. Discharge from the freshwater-lens system in northern Guam is by diffuse seepage near the coast and to subaerial and submarine coastal springs. In southern Guam, much of the fresh ground water discharges directly to stream valleys above sea level where the ground surface intersects the water table. In highly permeable rocks, freshwater flow is mainly horizontal and toward the coast, but in low-permeability rocks, vertical flow can be significant where there are substantial vertical head gradients.
Ground-water withdrawal from wells, saltwater upconing, and regional lens depletion.--Some fraction of recharge can be withdrawn continuously by wells for drinking water, in effect capturing a fraction of the natural discharge. The most efficient means of pumping water from a thin lens is to locate widely spaced shallow wells where the lens is thickest and to maintain low, uniform pumping rates at each well (fig. 5a). This configuration of wells spreads withdrawal over a wide area and skims freshwater from the lens. Uniform pumping rates will cause less mixing in the transition zone when compared to variable pumping rates. Saltwater intrusion can contaminate wells if the lens is too thin, if wells are too deep, or if too much water is withdrawn from a given area (fig. 5b). The degree of saltwater intrusion depends on several factors, which include the hydraulic properties of the rocks, recharge rate, pumping rate, and well location and depth. Even if wells are designed and placed to minimize local upconing, the lens will gradually shrink to a size that is in balance with the withdrawal. This regional shrinkage raises the transition zone closer to the wells, potentially can change the size and distribution of the "para-basal" zone. Shrinkage of the freshwater lens due to dry weather can also contribute to high salinity in wells.
Perched water is found in areas where low-permeability rocks impede the downward movement of ground water sufficiently to allow a perched water body to develop within otherwise unsaturated rocks. Minor perched systems are found in some of the higher-altitude limestone overlying the volcanic rocks of southern Guam. The height of the water table above sea level and the extent of the perched system are respectively dependent on the altitude and areal extent of the low-permeability rocks and the rate and duration of recharge. Discharge from a perched system can be to springs, streams, downward to a lower water table, or to the atmosphere by evaporation.
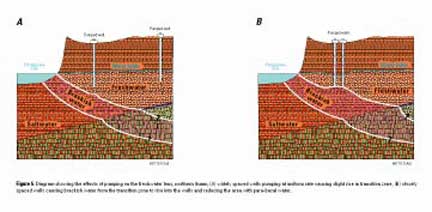
Figure 5. Diagram showing the effects of pumping on the freshwater lens, northern Guam, (A) widely spaced wells pumping at uniform rate causing slight rise in transition zone, (B) closely spaced wells causing brackish water from the transition zone to rise into the wells and reducing the area with para-basal water.
The collection and analysis of basic hydrologic data is critical in helping to understand the hydrologic resources of an area. Hydrologic data-collection activities of the USGS in northern Guam include recording rainfall at selected sites, ground-water levels in wells and the ocean level in Hagatna Bay, and measuring the salinity of ground water in deep monitor wells that penetrate through the transition zone (fig. 6). In southern Guam, the USGS operates gaging stations that measure streamflow, reservoir level, and rainfall.
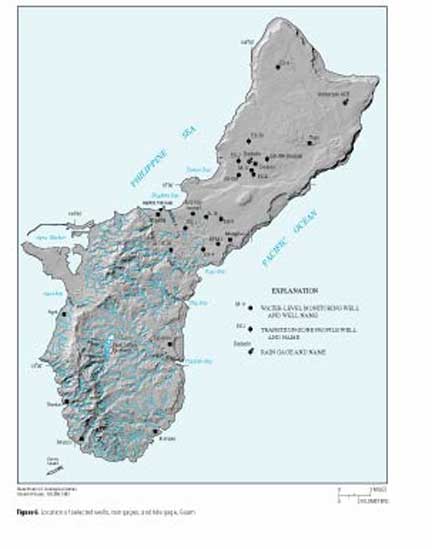
Figure 6. Location of selected wells, rain gages, and tide gage, Guam.
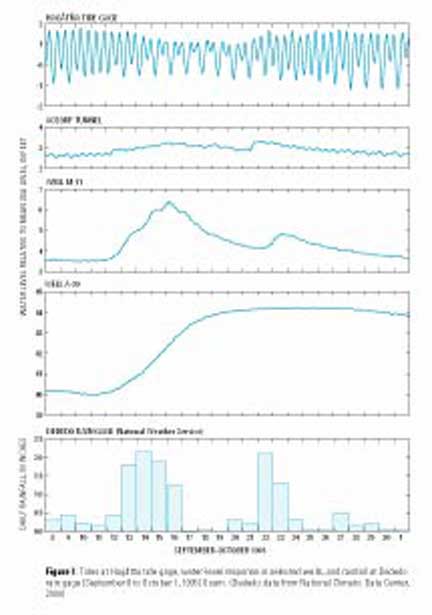
Figure 7. Tides at Hagatna tide gage, water-level response in selected wells, and rainfall at Dededo rain gage (September 8 to October 1, 1995) Guam. (Dededo data from National Climatic Data Center, 2000)
Water levels in wells may rise and fall in response to short- and long-term changes in ocean level and to changes in recharge and pumping. In wells closest to the coast in the high-permeability limestone, water levels fluctuate daily as much as 0.5 ft in response to ocean tides. Wells in the high-permeability limestone interior of the island typically show much smaller daily fluctuations. Although data are sparse, wells in the low-permeability volcanic rocks probably have minor or no daily water-level fluctuations from ocean tides but show more response to local recharge.
The record of water level during September 8 to October 1, 1995, in two wells penetrating limestone (ACEORP tunnel and well M-11) shows how the water table fluctuates in response to the ocean tide and to recharge (fig. 7). The daily tidal signal from the ocean is attenuated as it travels through the aquifer and the daily fluctuation of the water level decreases with increasing distance from the ocean. The daily water-level changes in the ACEORP tunnel, 2,780 ft from the coast, average about 0.5 ft. Well M-11, 12,200 ft from the coast, has daily water-level changes that average about 0.05 ft. At well A-20, no ocean tidal fluctuations are measurable, mainly because the well penetrates an area of low-permeability volcanic rocks at sea level (fig. 7).
Water-level fluctuations caused by changes in recharge depend on the amount and location of rainfall and the hydraulic properties of the aquifer in the area near the well. During September 12-16, 1995, about 8 inches of rainfall were recorded at the NWS Dededo rain gage. The water level in well M-11 increased nearly 3 ft after 3 days of rain but the water level in ACEORP tunnel increased only about 0.4 ft. Water levels in both wells declined to pre-rainfall conditions in about 20 days. The water level in well A-20 increased by about 4 ft after 8 to 10 days and only declined slightly after about 20 days. This response indicates that recharge near well A-20 takes longer to reach the water table and longer for the water to flow away in the aquifer.
In addition to the daily fluctuation in water level caused by the daily ocean tides, water levels in high-permeability rocks also vary over longer times in response to non-periodic changes in ocean level (fig. 8). A plot of the daily average water level removes the daily tidal fluctuations from the water-level record. The daily average ocean level at the Hagatna tide gage averaged 0.3 ft and ranged from -1.0 ft to 1.5 ft altitude during October 1983 to April 2000. Water levels in well M-11 averaged 3.4 ft and ranged from 2.5 ft to 8.0 ft altitude during October 1982 to April 2000 and water levels in ACEORP tunnel averaged 2.5 ft and ranged from 1.7 ft to 4.3 ft altitude during the same period. The water-level records with the tidal fluctuations removed show variations over several-month time scales that correspond closely to the ocean-level record.
Water levels in well A-20 show a seasonal pattern of variations that is significantly larger than that in the wells penetrating limestone at sea level. Water levels averaged 41.2 ft and ranged from 32.6 ft to 56.2 ft altitude during the period October 1982 to April 2000. Generally, the lowest water levels were recorded during July and August before the onset of the annual typhoon season.
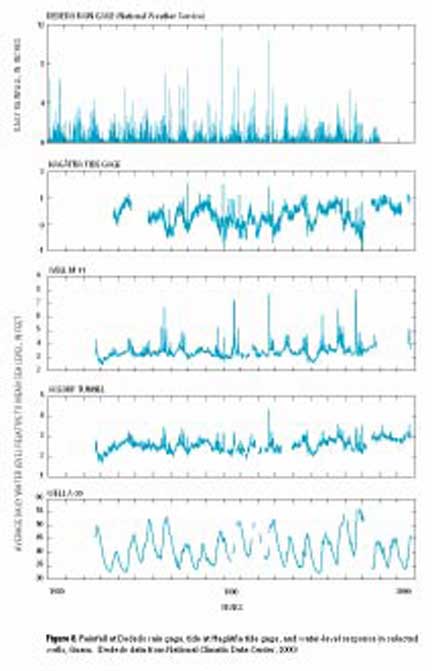
Figure 8. Rainfall at Dededo rain gage, tide at Hagatna tide gage, and water-level response in selected wells, Guam. (Dededo data from National Climatic Data Center, 2000)
Periodic measurements of specific conductance and chloride concentration, indicators of salinity, in deep wells that penetrate into or through the freshwater/saltwater transition zone provide information about the thickness and seasonal variation of the freshwater lens. Samples of water from various depths in the deep wells were collected starting in the early 1980's and were analyzed for specific conductance and chloride concentration. Beginning in 2000, profiles of salinity have been obtained using a conductivity/temperature/pressure sensor lowered into the deep wells. Plots (fig. 9) depict the depths at which the chloride concentration or salinity of water in the well was equal to 10, 50, and 90 percent of the chloride concentration or salinity of seawater. Each sample date allows the approximate depth of freshwater (less than 10 percent seawater for these plots) and the approximate thickness of the transition zone (between 10 and 90 percent seawater) to be estimated and the time series of samples shows the seasonal variations in the depth and thickness of the transition zone. The freshwater thickness is largest at well EX-1, ranging from about 150 to 200 ft thick and the transition-zone thickness also is the largest, ranging from about 100 to 250 ft thick. The reasons for such a thick transition zone are not understood but may be related to the relatively lower permeability of the sandy limestone in this area. The freshwater lens farther to the north is significantly thinner, about 100 ft thick, at wells EX-7 and EX-9 and the seasonal variability is less pronounced. The transition-zone thickness at well EX-7 ranges from 15 to 50 ft thick. The data from all three wells show how the freshwater lens gets thinner around the end of the dry season when recharge is reduced and thicker after increased recharge during the wet season.
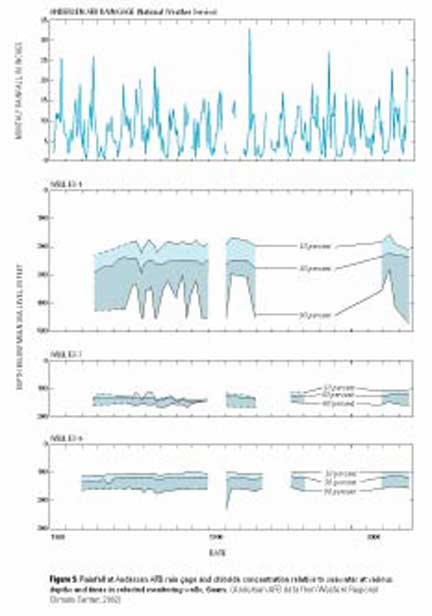
Figure 9. Rainfall at Andersen AFB rain gage and chloride concentration relative to seawater at various depths and times in selected monitoring wells, Guam. (Andersen AFB data from Western Regional Climate Center, 2002)
About 180 wells are used on Guam to withdraw ground water from the freshwater lens (fig. 10). The distribution and magnitude of pumping is based on available data provided by Guam Waterworks Authority (GWA), Guam Environmental Protection Agency (GEPA), the U.S. Navy (USN), and the U.S. Air Force (USAF). The pumping rates shown are the average pumping rate of each well between January 1996 and December 1998, the last period when data were readily available. The total average daily withdrawal during that period was about 35 Mgal/d with most of the wells individually withdrawing less than 0.4 Mgal/d. The two wells that withdrew the most water are well A-30 (1.1 Mgal/d) and well Y-15 (0.8 Mgal/d).
On an island, the chloride concentration of water is an indicator of the amount of seawater that has mixed with the fresh rainwater infiltrated to the freshwater-lens system. For the 180 wells with recent data, chloride concentrations ranged from 6 to 585 mg/L. Of the 234 wells and springs for which historical chloride-concentration data are available (pre-1962 to 1997), 32 percent have exceeded 250 mg/L in at least one sample (fig. 11). Another 5 percent have exceeded 200 mg/L and may be approaching the 250-mg/L guideline. The samples with the highest concentrations are generally clustered near the center of the island. Factors that may contribute to the high concentrations include: (1) excessive rates of ground-water withdrawal from a single well, (2) a cluster of wells that are too closely spaced, (3) wells that are drilled too deeply into the freshwater lens, or (4) higher permeability geologic formations that allow increased mixing of freshwater with the underlying saltwater (McDonald, 2001).
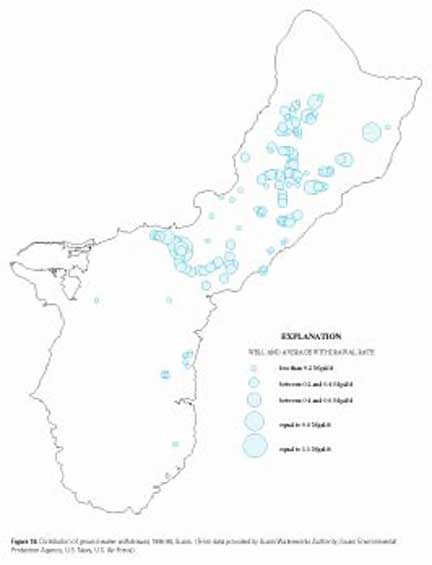
Figure 10. Distribution of ground-water withdrawal, 1996-98, Guam. (From data provided by Guam Waterworks Authority, Guam Environmental Protection Agency, U.S. Navy, U.S. Air Force)
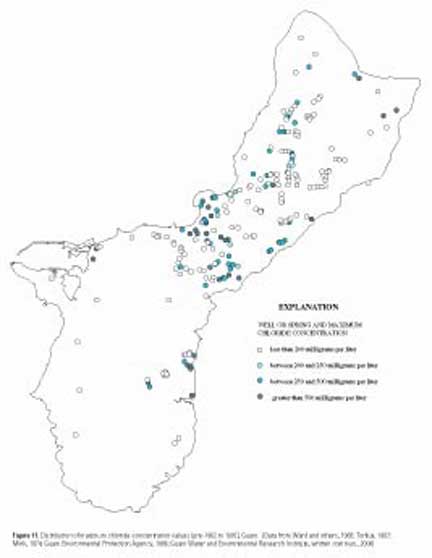
Figure 11. Distribution of maximum chloride-concentration values (pre-1962 to 1997), Guam. (Data from Ward and others, 1965; Torikai, 1997; Mink, 1974; Guam Environmental Protection Agency, 1986; Guam Water and Environmental Research Institute, written commun., 2000)
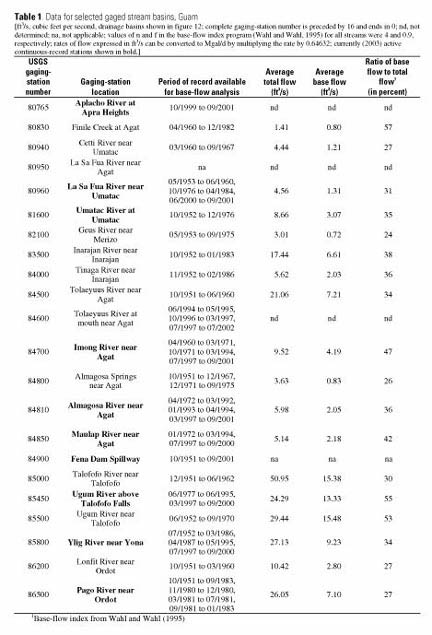
The USGS has at various times operated 22 continuously recording gages in southern Guam to record streamflow (fig. 12 and table 1). Hydrographs of two rivers, the Ylig and Maulap Rivers, show total flow and base flow estimated from a computerized hydrograph-separation technique (Wahl and Wahl, 1995) for the period January 1980-September 2000 (fig. 12). The gaged streams of southern Guam have a ratio of base flow to total flow ranging from 0.24 to 0.57 indicating that the low-permeability aquifer causes a significant part of streamflow to be from ground-water discharge (table 1). In other words, ground-water discharge constitutes 23 to 57 percent of total streamflow in the gaged basin. Similar ratios (0.38 to 0.56) are reported from eastern Kauai, Hawaii, where the low-permeability lava flows that form the aquifer have allowed water levels to build up hundreds of feet above sea level (Izuka and Gingerich, 1998).
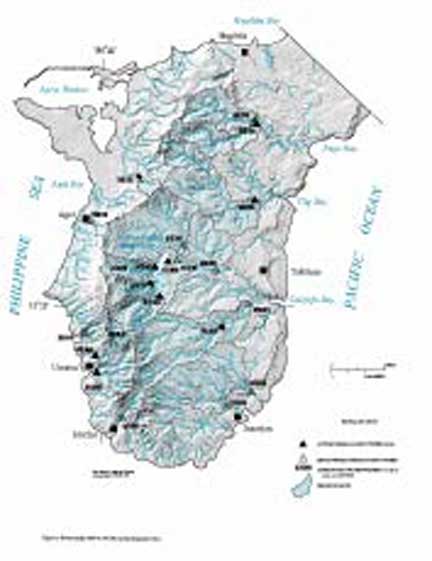
Figure 12. Stream-gaging stations and selected hydrographs, Guam.
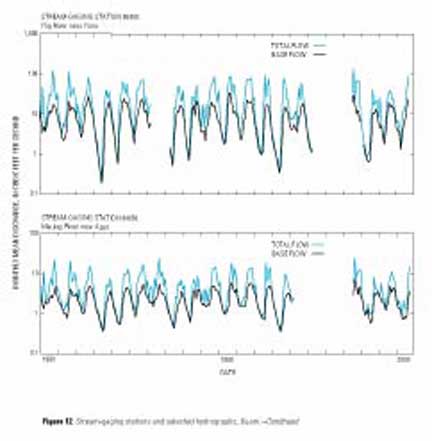
Figure 12. Stream-gaging stations and selected hydrographs, Guam.--Continued.
Table 1. Data for selectad gaged stream basins, Guam.
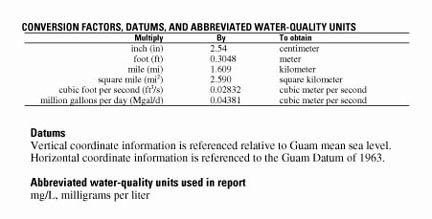
Conversion factors
Ground water supplies about 80 percent of the drinking water for the islands 150,000 residents and nearly one million visitors per year. In northern Guam, water is obtained from wells tapping a fresh ground-water lens in a highly permeable limestone aquifer. Nearly 180 wells withdraw about 35 Mgal/d of water with chloride concentrations ranging from 6 to 585 mg/L. In southern Guam, where low-permeability volcanic rocks are exposed over most of the area, about 9.9 Mgal/d of freshwater is obtained from surface reservoirs.
The high permeability of the limestone in northern Guam allows rapid infiltration of rainfall so surface runoff occurs locally only after intense rain. The limestone also offers little resistance to ground-water flow so only a thin freshwater lens has developed. Water levels in the freshwater lens vary several feet daily and seasonally in response to ocean tides, recharge, and ground-water withdrawal. The thickness of the freshwater lens varies seasonally, mainly in response to seasonal variations in recharge. Ground-water withdrawal has led to localized areas of increased chloride concentration, an indicator of saltwater intrusion or upconing. Factors that may contribute to the high concentrations include excessive rates of ground-water withdrawal from a single well, a cluster of wells too closely spaced, wells that are drilled too deeply into the freshwater lens, or higher permeability geologic units that allow increased mixing of freshwater with the underlying saltwater.
The low-permeability volcanic rocks of southern Guam allow less rainfall infiltration and slower flow of ground water. Heavy rainfall and high runoff cause intense flooding in the stream drainage basins. Because the volcanic rocks have low permeability, ground water saturates the aquifer to tens to hundreds of feet above sea level and discharges at springs and into stream valleys. Ground-water discharge constitutes 24 to 57 percent of total streamflow in the gaged stream basins.
Ayers, J.F., and Clayshulte, R.N., 1983, Feasibility study of developing valley-fill aquifers for village water supplies in southern Guam: Technical Report No. 41, Water and Energy Research Institute of the Western Pacific, University of Guam, 91 p.
Camp Dresser & McKee Inc., 1982, Northern Guam lens study, Groundwater management program, Aquifer yield report prepared for the Government of Guam, Guam Environmental Protection Agency, variously paged.
Contractor, D.N., and Srivastava, R., 1990, Simulation of saltwater intrusion in the Northern Guam Lens using a microcomputer, Journal of Hydrology, v. 118, p. 87-106.
Guam Environmental Protection Agency, 1986, Groundwater management program annual report, Agana, Guam, 140 p.
Izuka, S.K., and Gingerich, S.B., 1998, Ground water in the southern Lihue basin, Kauai, Hawaii: U.S. Geological Survey Water-Resources Investigations Report 98-4031, 71 p.
Jocson, J.M.U., Jenson, J.W., and Contractor, D.N., 2002, Recharge and aquifer response: Northern Guam Lens Aquifer, Guam, Mariana Islands: Journal of Hydrology, v. 260, p. 231-254.
Lander, M.A., 1994, Meteorological factors associated with drought on Guam: Technical Report No. 75, Water and Energy Research Institute of the Western Pacific, University of Guam, 39 p.
McDonald, M.Q., 2001, Analysis of saltwater intrusion in the Northern Guam Lens Aquifer based on chloride ion concentrations at production and observation wells: M.S. Thesis, University of Guam, variously paged.
Meijer, Arend, Reagan, Mark, Ellis, Howard, Shafiqullah, Muhammad, Sutter, John, Damon, Paul, and Kling, Stanley, 1983, Chronology of volcanic events in the eastern Philippine Sea in Hayes, D.E., ed., The tectonic and geologic evolution of southeast Asian seas and islands: part 2: American Geophysical Union, Geophysical Monograph 27, Washington, D.C., p. 349-359.
Meinzer, O.E., 1930, Ground water in the Hawaiian Islands in Stearns, H.T., and Clark, W.O., Geology and water resources of the Kau District, Hawaii: U.S. Geological Survey Water-Supply Paper 616, p. 1-28.
Mink, J.F., 1974, Groundwater resources of Guam: Occurrence and development, report to the Public Utility Agency, Guam, variously paged.
Nakama, L.Y., 1992, Storage capacity of Fena Valley Reservoir, Guam, Mariana Islands, 1990: U.S. Geological Survey Water-Resources Investigations Report 92-4114, 17 p.
National Climatic Data Center, 2000, Daily rainfall data, Dededo Rain gage, Guam: http://www4.ncdc.noaa.gov/cgi-win/wwcgi.dll?wwDI~StnSrch~StnID~20030347 accessed September 4, 2000.
Reagan, M.K., and Meijer, Arend, 1984, Geology and geochemistry of early arc-volcanic rocks from Guam: Geological Society of America Bulletin, v. 95, p. 701-713. Thurman, H.V., 1990, Essentials of oceanography (3d ed.): Columbus, Ohio, Merrill Publishing Company, 398 p.
Torikai, J.D., 1997, Rainfall, ground-water, and ocean-tide data, Guam, 1996: U.S. Geological Survey Open-File Report 97-239, 67 p., 1 pl. in pocket.
Tracey, J.I., Jr., Schlanger, S.O., Stark, J.T., Doan, D.B., and May, H.G., 1964, General geology of Guam: U.S. Geological Survey Professional Paper 403-A, 104 p., 3 pl.
U.S. Environmental Protection Agency, 1991, Secondary maximum contaminant levels (section 143.3 of part 143, National secondary drinking water regulations): U.S. Code of Federal Regulations, Title 40, Parts 100 to 149, revised through July 1, 1991.
Wahl, K.L., and Wahl, T.L., 1995, Determining the flow of Comal Springs at New Braunfels, Texas: Proceedings of Texas Water Â’95, A Component Conference of the First International Conference on Water Resources Engineering, American Society of Civil Engineers, August 16-17, 1995, San Antonio, Tex., p. 77-86.
Ward, P.E., Hoffard, S.H., and Davis, D.A., 1965, Hydrology of Guam: U.S. Geological Survey Professional Paper 403-H, 28 p., 1 pl.
Western Regional Climate Center, 2002, Anderson AFB Guam, Pacific Ocean monthly total precipitation data: http://www.wrcc.dri.edu/cgi-bin/cliMAIN.pl?piande accessed December 5, 2002.
View a PDF version (not accessible) [8,172,525 Kb] of this reportCitation: Gingerich, S.B., 2003, Hydrologic Resources of Guam: U.S. Geological Survey Water-Resources Investigations Report 03-4126, 2 Plates.