Link to USGS home page.

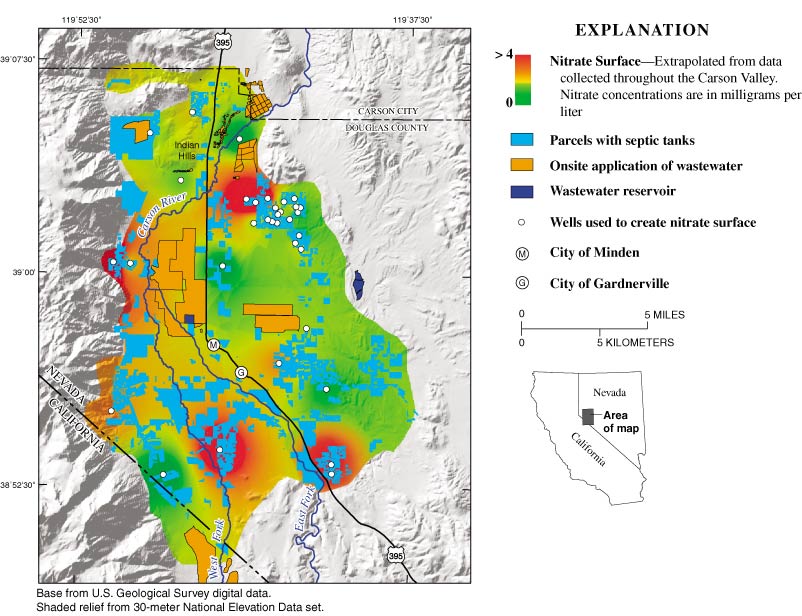
Figure 1. Generalized nitrate concentrations (as nitrogen) in ground water for the Carson Valley, 2000. Nitrate concentrations from 34 wells (not all of which were trend site locations) were used to construct the contours. Contours represent approximate boundaries of nitrate concentrations.

Map showing generalized nitrate concentrations (as nitrogen) in ground water for the Carson Valley, 2000. Nitrate concentrations from 34 wells (not all of which were trend site locations) were used to construct the contours. Contours represent approximate boundaries of nitrate concentrations.


Return to WRIR 03-4152.