Water-Resources Investigations Report 03-4152
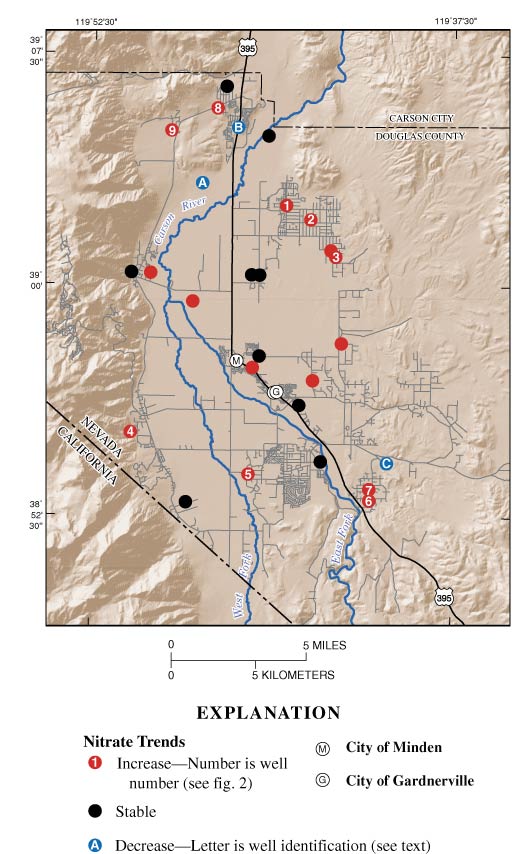
Figure 4. Trends in nitrate concentrations plotted by well location. Individual trends in nitrate concentrations of wells 1-9 are plotted in figure 2.
Return to WRIR 03-4152.