
In cooperation with the U.S. Environmental Protection Agency
WRIR 03-4216
METHODS OF PESTICIDE SAMPLING AND ANALYSIS
PESTICIDE OCCURRENCE IN TREATED AND UNTREATED WATER
Figure 1. Land use and selected features of the East Fork Little Miami Rive...
Figure 2. Annual precipitation variations for southwestern Ohio, including ...
Figure 3. Treatment methods at Bob McEwen Treatment Plant, 1999 and 2000. [...
Figure 4. Pesticide and degradate concentrations in samples collected at Ea...
Figure 5. Atrazine concentrations from samples collected at East Fork Littl...
Figure 6. Seasonal stratification of Harsha Lake, as shown by temperature c...
Figure 7. Concentrations of selected pesticides from samples collected from...
Table 1. Analytical methods for detecting pesticides and pesticide degradat...
Table 2. Summary of pesticide detections in samples collected at East Fork ...
Table 3. Summary of pesticide detections in samples collected at water inta...
Table 4. Summary of pesticide detections in treated drinking water from Bob...
Table 5. Percentage of selected compound remaining in treated water samples...
The U.S. Geological Survey (USGS) is committed to serve the Nation with accurate and timely scientific information that helps enhance and protect the overall quality of life, and facilitates effective management of water, biological, energy, and mineral resources (http://www.usgs.gov/). Information on the quality of the Nation's water resources is of critical interest to the USGS because it is so integrally linked to the long-term availability of water that is clean and safe for drinking and recreation and that is suitable for industry, irrigation, and habitat for fish and wildlife. Escalating population growth and increasing demands for the multiple water uses make water availability, now measured in terms of quantity and quality, even more critical to the long-term sustainability of our communities and ecosystems.
The USGS implemented the National Water-Quality Assessment (NAWQA) Program to support national, regional, and local information needs and decisions related to water-quality management and policy (http://water.usgs.gov/nawqa/). Shaped by and coordinated with ongoing efforts of other Federal, State, and local agencies, the NAWQA Program is designed to answer: What is the condition of our Nation's streams and ground water? How are the conditions changing over time? How do natural features and human activities affect the quality of streams and ground water, and where are those effects most pronounced? By combining information on water chemistry, physical characteristics, stream habitat, and aquatic life, the NAWQA Program aims to provide science-based insights for current and emerging water issues and priorities. NAWQA results can contribute to informed decisions that result in practical and effective water-resource management and strategies that protect and restore water quality.
Since 1991, the NAWQA Program has implemented interdisciplinary assessments in more than 50 of the Nation's most important river basins and aquifers, referred to as Study Units (http://water.usgs.gov/nawqa/nawqamap.html). Collectively, these Study Units account for more than 60 percent of the overall water use and population served by public water supply, and are representative of the Nation's major hydrologic landscapes, priority ecological resources, and agricultural, urban, and natural sources of contamination.
Each assessment is guided by a nationally consistent study design and methods of sampling and analysis. The assessments thereby build local knowledge about water-quality issues and trends in a particular stream or aquifer while providing an understanding of how and why water quality varies regionally and nationally. The consistent, multi-scale approach helps to determine if certain types of water-quality issues are isolated or pervasive, and allows direct comparisons of how human activities and natural processes affect water quality and ecological health in the Nation's diverse geographic and environmental settings. Comprehensive assessments on pesticides, nutrients, volatile organic compounds, trace metals, and aquatic ecology are developed at the national scale through comparative analysis of the Study-Unit findings (http://water.usgs.gov/nawqa/natsyn.html).
The USGS places high value on the communication and dissemination of credible, timely, and relevant science so that the most recent and available knowledge about water resources can be applied in management and policy decisions. We hope this NAWQA publication will provide you the needed insights and information to meet your needs, and thereby foster increased awareness and involvement in the protection and restoration of our Nation's waters.
The NAWQA Program recognizes that a national assessment by a single program cannot address all water-resource issues of interest. External coordination at all levels is critical for a fully integrated understanding of watersheds and for cost-effective management, regulation, and conservation of our Nation's water resources. The Program, therefore, depends extensively on the advice, cooperation, and information from other Federal, State, interstate, Tribal, and local agencies, non-government organizations, industry, academia, and other stakeholder groups. The assistance and suggestions of all are greatly appreciated.
Robert M. Hirsch
Associate Director for Water
CONVERSION FACTORS AND ABBREVIATED WATER-QUALITY UNITS
| Multiply | By | To obtain |
|---|---|---|
| mile (mi) | 1.609 | kilometer (km) |
| micrometer (µm) | 3.937 x 10⁻⁵ | inch (in.) |
| inch (in.) | 2.54 | centimeter (cm) |
| square mile (mi2) | 2.590 x 100 | square kilometer (km2) |
| liter (L) | 2.642 x 10⁻¹ | gallon (gal) |
Abbreviated water-quality units used in this report: Chemical concentrations in water are given in units of micrograms per liter (µg/L), a unit expressing the concentration of chemical constituents in solution as weight (micrograms) of solute per unit volume (liter) of water.
In 1999 and 2000, the U.S. Geological Survey National Water-Quality Assessment (NAWQA) Program conducted a national pilot study of pesticides and degradates in drinking-water supplies, in cooperation with the U.S. Environmental Protection Agency (USEPA). William H. Harsha Lake, which provides drinking water for several thousand people in southwestern Ohio, was selected as one of the drinking-water supplies for this study. East Fork Little Miami River is the main source of water to Harsha Lake and drains a predominantly agricultural basin. Samples were collected from the East Fork Little Miami River upstream from Harsha Lake, at the drinking-water intake at Harsha Lake, at the outfall just below Harsha Lake, and from treated water at the Bob McEwen Treatment Plant. These samples were analyzed using standardized methods developed for the NAWQA Program.
In all, 42 pesticide compounds (24 herbicides, 4 insecticides, 1 fungicide, and 13 degradates) were detected at least once in samples collected during this study. No compound in the treated water samples exceeded any drinking-water standard, although atrazine concentrations in untreated water exceeded the USEPA Maximum Contaminant Level (MCL) for drinking water (3 µg/L) on four occasions. At least eight compounds were detected with greater than 60 percent frequency at each sampling location. Herbicides, such as atrazine, alachlor, acetochlor, cyanazine, metolachlor, and simazine, were detected most frequently.
Rainfall affected the pesticide concentrations in surface waters of the East Fork Little Miami River Basin. Drought conditions from May through November 1999 led to lower streamflow and pesticide concentrations throughout southwestern Ohio. More normal climate conditions during 2000 resulted in higher streamflows and seasonally higher concentrations in the East Fork Little Miami River and Harsha Lake for some pesticides
Comparison of pesticide concentrations in untreated lake water and treated drinking water supplied by the Bob McEwen Treatment Plant suggests that treatment processes employed by the plant (chlorination, activated carbon) reduced pesticide concentrations to levels well below USEPA drinking-water standards. In particular, the percentage of pesticides remaining in treated water samples decreased significantly for several frequently occurring pesticides when the plant replaced the use of powdered activated carbon with granular activated carbon in November 1999. For example, the median percentage of atrazine remaining after treatment that included powdered activated carbon was 63 percent, whereas the median percentage of atrazine remaining after the switch to granular activated carbon was 2.4 percent.
In 1999, the U.S. Environmental Protection Agency (USEPA) and U.S. Geological Survey (USGS) National Water-Quality Assessment (NAWQA) Program began a pilot monitoring program to assess where and when pesticides occur in treated drinking water and untreated source water withdrawn from water-supply reservoirs in a variety of geographic settings throughout the Nation (Blomquist and others, 2001). Reservoirs selected for the study were considered vulnerable to pesticide inputs. Several of the selected reservoirs were downstream from established NAWQA sampling locations; William H. Harsha Lake in southwestern Ohio was among this group. The main stream contributing to Harsha Lake (fig.1) is the East Fork Little Miami River (referred to hereafter as "East Fork"). East Fork was monitored upstream from Harsha Lake for pesticides as part of the Great and Little Miami River Basins (MIAM-NAWQA) study.
The purpose of this report is to provide information about pesticides and pesticide degradates in East Fork, Harsha Lake, and treated drinking water supplied by Harsha Lake. Water samples were collected from March 1999 to September 2000. The report presents a comparison of pesticide concentrations in untreated lake water and treated drinking water and a qualitative assessment of the effect of the November 1999 switchover from powdered activated carbon (PAC) to granular activated carbon (GAC) treatment on the concentration of pesticide compounds in treated lake water.
One goal of the NAWQA Program is to determine how factors such as land use and environmental setting affect the quality of drinking-water sources. Pesticides are applied mainly in urban and agricultural settings to control weeds, insects, fungi, and other pests. Streams and rivers commonly contain detectable concentrations of one or more pesticides; many of these streams are used for public water supply, and some flow into reservoirs used to supply drinking water (Larson and others, 1997, 1999). Although most pesticides tend to adsorb onto soil particles or degrade quickly after application, some fraction of the compounds applied is transported to nearby storm sewers, drainage ditches, and streams during storm runoff, eventually flowing into downstream reservoirs. If the influx of pesticides flowing into a reservoir exceeds the amount removed by sorption, degradation, or reservoir outflow, then pesticide concentrations may accumulate to levels that could affect the health of humans and aquatic organisms. Public concern about pesticides in the environment has arisen because some pesticides have toxic or carcinogenic properties, whereas others disrupt endocrine systems and can affect the development, growth, and reproductive capability of aquatic and terrestrial organisms (Colburn and others, 1993; Cheremisinoff and King, 1994; Biradar and Rayburn, 1995). In addition, some pesticide breakdown products (hereafter termed "degradates") may be as toxic or more toxic than their parent compounds (Felsot and Pederson, 1991; Tessier and Clark, 1995; Sinclair and Boxall, 2002). In response to public concern, drinking-water standards, health advisories, and aquatic-life guidelines have been established by the USEPA for some pesticides. However, drinking-water standards have been established for only a few of the pesticides analyzed for in this study, and there are no standards for any of the degradates analyzed for. Pesticide concentrations in Harsha Lake are of interest because the reservoir is a source of drinking water for approximately 40,000 people and because concentrations of some regulated pesticides in lake water—atrazine, for example—occasionally exceed drinking-water standards. Nevertheless, treated drinking water from the reservoir has consistently met the drinking-water standards established by the USEPA (Eric Heiser, Clermont County Public Water System, written commun., 2003).
The East Fork drains an area of 499 mi2 before it flows into the Little Miami River. Harsha Lake was created when the East Fork was impounded in 1978. The total area that drains into Harsha Lake represents about 69 percent of the East Fork drainage basin or approximately 344 mi2. Upstream from Harsha Lake, the drainage basin is dominated by agriculture, although urban areas and forests become more prevalent around the lake and downstream from Harsha Lake dam (fig. 1). As a result of the large amount of cropland in the basin, agricultural pesticides such as atrazine, alachlor, cyanazine, and metolachlor are commonly detected in the East Fork and, consequently, Harsha Lake. The concentrations of these pesticides show a seasonal pattern, with peaks in the spring and early summer—coinciding with the heaviest application of pesticides to cropland and heavy rains—which lead to pesticide runoff (Shindel and others, 2000, 2001). Mixed urban and forested areas are also a source of pesticides and may differ from upstream agricultural areas in the timing, frequency, amount, and types of pesticides applied.
Precipitation was below normal for southwestern Ohio during summer and fall 1999, which resulted in little or no streamflow in East Fork after July. Near-normal precipitation, along with more normal streamflow, returned to the region in 2000 (fig. 2). Near-normal precipitation and streamflow patterns in 2000 probably contributed to higher pesticide concentrations observed in the East Fork and Harsha Lake in the spring and summer of that year.
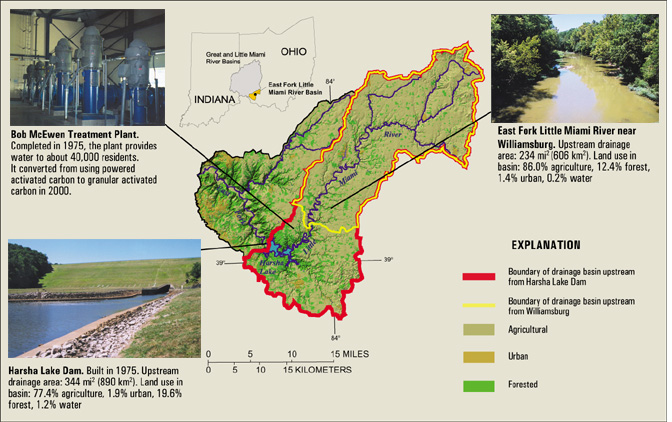
Figure 1. Land use and selected features of the East Fork Little Miami River Basin, Ohio.
During the course of the study, the Bob McEwen Treatment Plant—which supplies public drinking water from Harsha Lake—switched from PAC treatment to GAC treatment (fig. 3). The change from PAC to GAC treatment was completed on November 20, 1999, and was done to address taste and odor problems that typically occur in the fall and winter and to ensure adequate removal of pesticides during periods when pesticides concentrations in the lake are high, such as in the late spring and summer (Eric Heiser, Clermont County Public Water System, written commun., 2003). The change from PAC to GAC treatment resulted in greater exposure of water to activated carbon. Pesticide concentrations detected in samples treated by PAC were compared to pesticide concentrations detected in samples treated by GAC. In addition to activated carbon, a number of other treatment methods that could affect pesticide concentrations in treated water samples, such as addition of potassium permanganate and chlorine, are used at the Bob McEwen Treatment Plant (fig. 3). From 1999 to 2000, the amount of water treated at the plant ranged from 3 to 5 million gallons per day, with an estimated average detention time of approximately 24 hours in the plant (Eric Heiser, Clermont County Public Water System, written commun., 2003). Pesticide concentrations in a treated water sample collected on June 21, 2000, were higher than normal, probably due to testing of a nonionic polymer used to remove manganese and by routine maintenance of a flocculation-sedimentation basin. These activities during June 19–23 may have caused the flocculation-sedimentation process in the remaining basin to deviate from normal operating conditions, thereby reducing contact time with the activated carbon beds and reducing overall treatment efficiency (Eric Heiser, Clermont County Public Water System, written commun., 2003).
The U.S. Environmental Protection Agency (USEPA) Office of Pesticide Programs, the USGS National Water-Quality Assessment Program (NAWQA), and the USEPA Office of Ground Water and Drinking Water provided support for the pilot monitoring program, of which this study was a part.
Eric Heiser, Lead Operator at the Bob McEwen Treatment Plant, Clermont County Public Water Systems, provided valuable information about treatment and allowed sampling at the intake and the finished-water tap in the treatment plant. Paul Braash and John McManus at the Clermont County Office of Environmental Quality also provided support and information about the land use and hydrology of the watershed.
USGS personnel collected field data and samples using standard USGS protocols for collecting trace-level organic compounds (Wilde and others, 1998–99). Samples were collected from four locations: (1) East Fork near Williamsburg (USGS streamflow-gaging station 03246400), (2) the treatment plant intake at Harsha Lake, (3) the treated water tap at the Bob McEwen Treatment Plant, and (4) East Fork at 0.8 mi below the Harsha Lake Dam outfall (fig. 1). Sampling frequency was biweekly during spring and summer and quarterly during the remainder of the year. Some changes were implemented beyond the regular sampling design: for instance, upstream sampling for USGS method 2002 was eliminated after March 2000, and samples for acetamide herbicide degradates were collected less frequently and only at the intake and treated water sampling locations beginning in 2000. The upstream East Fork site also was not sampled in August 1999 because of a drought-induced lack of streamflow. Streamflow measurements were recorded at East Fork at Williamsburg (USGS station 03264500); these data are available in the USGS annual water data reports (Shindel and others, 2000, 2001). This station is 1 mi downstream from East Fork near Williamsburg (USGS station 03246400). As part of the national study, samples were also collected in 1999 from East Fork 0.8 mi below the Harsha Lake outfall. An analysis of these samples is not presented in this report; however, data from this site are available with data from the other three sites (U.S. Geological Survey, 2003).
Stream samples were collected either by the equal-width-increment method or at the stream centroid. All samples were filtered into a 1-L amber glass bottle with a 0.7-µm nominal pore diameter glass-fiber filter. Samples were processed according to methods described in Shelton (1994). Samples were packed in ice and shipped without chemical preservatives (no reducing agents or microbiocides) in sealed coolers to the respective laboratories for solid-phase extraction and analysis. Between sample collections, all sampling equipment was cleaned and decontaminated according to standard protocols (Shelton, 1994). Quality-control samples were periodically submitted to the laboratories as directed by the study protocol (Mueller and others, 1997; Blomquist and others, 2001).
Because sampling methods followed USGS protocols for ambient surface water, some issues should be addressed with regard to the treated water samples. These methods did not include addition of quenching agents or biocides to treated water samples to prevent chemical and microbiological alteration of the samples prior to analysis. As a result, data for these samples may be biased low because of pesticide degradation during storage. In addition, the quality-assurance plan for the study did not specify a paired sampling strategy for untreated and treated water samples. For logistical reasons, treated samples were usually collected before the untreated samples during this study. This nonsequential sampling precludes precise analysis of paired pesticide concentrations in untreated and treated water samples.
Four laboratory methods were selected for use during this study. Three methods (2001, 2002, and 2060) were performed at the U.S. Geological Survey's National Water Quality Laboratory (NWQL) in Denver, Colo. The fourth method (LCAA) was performed at the U.S. Geological Survey's Organic Geochemistry Research Laboratory (ORGL) in Lawrence, Kans. At the time of this study, only method 2001 was officially approved by the USGS. The other three methods, method 2002, method 2060, and method LCAA for analyzing acetamide herbicide degradates, were in development at the time of this study; hence, all data generated by these methods were considered provisional data. The three developmental methods were included to expand the available information on the presence of a wide number of pesticides and pesticide degradates in surface water across the Nation and to test for the presence of these compounds in drinking-water supplies. The analyses were included with the knowledge that the methods were provisional and that their performance may be more variable than would be expected of methods that have been thoroughly tested and approved (Blomquist and others, 2001). As of April 2001, all three developmental methods had been approved by the USGS without any changes in the procedures. Details concerning each method used in this study, including type of analysis, number of compounds analyzed, range of reporting levels, and references for each method are summarized in table 1. Method detection limits (MDLs) (see text box on reporting terminology) calculated for compounds analyzed by gas chromatography/mass spectroscopy (GC/MS) are often an order of magnitude lower than for compounds analyzed by high-performance liquid chromatography (HPLC) methods (table 1).
A backlog of samples submitted to NWQL for analysis by method 2060 in 1999 resulted in most samples being processed after the specified sampling-to-extraction holding time of 4 days. The NWQL performed a study to determine the effects that long holding times had on pesticide recoveries and found that many compounds had half-lives that were well below the median holding time of 97 days (Furlong and others, 2003). Therefore, reported concentrations and detection frequencies for method 2060 data may be biased low, and some compounds initially present in the water samples may not have been detected because of degradation over the long storage period. Because of this problem, all method 2060 data associated with samples collected between March 1, 1999, and December 31, 1999, have been flagged with USGS supplemental data-quality descriptors (Furlong and others, 2003).
Computed detection frequencies from samples collected in 1999 and 2000 were compared. Data from samples collected from the East Fork near Williamsburg and the water intake from Harsha Lake suggest that 1999 data for acifluorofen, bentazon, chlorimuron, dipenamid, diuron, imazaquin, and imazethapyr could have been affected by degradation during extended storage, because all these compounds had lower detection frequencies in 1999 than in 2000. However, higher rainfall and runoff or changes in use patterns could also explain the higher detection frequencies observed for these compounds in 2000 relative to 1999.
[GC-MS, gas chromatography/mass spectroscopy; HPLC-MS, high-performance liquid chromatography/mass spectroscopy; µg/L, micrograms per liter]
| U.S. Geological Survey Laboratory method | Type of analysis | Number of compounds (number of degradates) | Number of compounds permanently qualified (estimated values) | Reporting levels (µg/L) | Reference |
|---|---|---|---|---|---|
| 2001 | GC-MS | 47 (3) | 5 | 0.001 - 0.018 | Zaugg and others, 1995. |
| 2002 | GC-MS | 75 (41) | 34 | 0.004 - 0.031 | Sandstrom and others, 2001. |
| 2060 | HPLC-MS | 641 (12) | 27 | 0.010 - 0.16 | Furlong and others, 2001. |
| LCAA | HPLC-MS | 6 (6) | 0 | 0.05 | Zimmerman and others, 2000; Lee and others, 2001 |
1Caffeine is analyzed by method 2060 but is not reported here. Six compounds analyzed by method 2001 (atrazine, carbaryl, carbofuran, deethylatrazine, tebuthiron, and terbacil) are also analyzed by method 2060. Values from approved method 2001 were used in all data analysis (Gary Cottrell, U.S. Geological Survey, written commun., 2002).
Method detection limit (MDL). The concentration of a chemical at which confidence of detection or nondetection is 99 percent or greater. Compounds may be detected at concentrations lower than the minimum MDL, but the risk of a false positive identification is greater than 1 percent below the MDL.
Estimated values (E). These values represent estimates of a chemical concentration that is below the MDL for a compound that does not show consistent recoveries, or for results extrapolated above the calibration range. Therefore, for estimated values below the MDL, the chance of a false positive identification is greater than 1 percent.
Health Advisory – Lifetime (HA-L). The highest concentration of a contaminant in drinking water that is not expected to cause any adverse noncarcinogenic effect for a lifetime of exposure to humans. A health advisory is an estimate of acceptable drinking-water level for a chemical substance based on health-effects information; a Health Advisory is not a legally enforceable Federal standard but serves as technical guidance to assist Federal, state, and local officials (U.S. Environmental Protection Agency, 2000).
Maximum Contaminant Level Goal (MCLG). A nonenforceable health goal set at a level at which no known or anticipated adverse effect on the health of persons occurs and which allows an adequate margin of safety (U.S. Environmental Protection Agency, 2000).
Maximum Contaminant Level (MCL). The highest level of a contaminant that is allowed in drinking water. MCLs are set as close to the MCLG as feasible using the best available treatment technology and taking cost into consideration. MCLs are enforceable standards (U.S. Environmental Protection Agency, 2000).
Most spike recoveries were acceptable (between 75 and 125 percent of the expected concentrations) for compounds analyzed by method 2001, for which overall median recovery was 94 percent. However, there were some notable exceptions. Samples of treated water consistently showed very low recoveries (less than 20 percent) for organothiophosphate compounds (insecticides) and thiocarbamate compounds (herbicides), including butylate, chlorpyrifos, diazinon, dimethoate, disulfoton, S-ethyl dipropylthiocarbamate (EPTC), fonofos, malathion, methyl azinphos, methyl parathion, molinate, parathion, pebulate, phorate, terbufos, thiobencarb, and triallate. Metribuzin (a triazine herbicide) and terbacil (a uracil herbicide) also exhibited low spike recoveries in treated water. These results are consistent with literature reports ( Miltner and others, 1989: Aizawa and others, 1994), which indicate that these compounds degrade in the presence of residual chlorine. Samples analyzed by method 2001 were spiked before shipment to the NWQL, which would allow time for compounds to interact with any residual chlorine. A few other compounds exhibited variable recoveries (carbaryl, carbofuran, deethyl atrazine). These compounds often have variable recoveries in this method and are always designated as estimated values (Zaugg and others, 1995).
Spike recoveries for compounds analyzed by methods 2060 and 2002 were lower than the recoveries of those compounds analyzed by method 2001, with overall median recoveries of 64 percent for method 2060 compounds and 75 percent for method 2002 compounds. Because many compounds detected by these methods were degradates, the breakdown of parent compounds in the sample may have added to the concentration of degradates, making some spike results invalid. In addition, the fact that these methods were still in development may have contributed to lower precision of the results reported from the laboratory. Methiocarb, 2,2-ethyl 6-methyl-panol, 2-chloro 2,6-dimethylacetoaniline, and 3,4-dichloroaniline were detected in spiked samples from Harsha Lake but were rarely detected in spiked samples of treated water, indicating that chlorine degradation may have occurred with these compounds. Samples analyzed by methods 2060 and 2002 were spiked by NWQL personnel at the lab just prior to extraction; hence, no definitive statements about the effects of residual chlorine on the integrity of the spiked samples can be made.
No pesticides were detected in any of the field blanks collected. This indicates that pesticides were not introduced in the samples during processing by field crews nor during subsequent analysis at NWQL. Variability between replicate samples, measured by the relative percent difference (RPD) between the concentrations of each compound, was lowest for compounds analyzed by method 2001 (overall median RPD of 4.2 percent) and highest for compounds analyzed by method 2060 (overall median RPD of 13 percent). None of the samples submitted for replicate analysis contained any method 2002 analytes. Quality-assurance/quality-control sample data are available from U.S. Geological Survey (2003).
A series of consistent quality-assurance (QA) protocols and quality-control (QC) measures were implemented for this study. Three QC methods were used to determine the reliability of sampling and analytical techniques. Some samples were spiked with known quantities of pesticides, and the amount recovered was compared to the known value; recovery percentages were used as an indicator of chemical interference, masking, or other processes that might affect the laboratory results. In addition, some samples were replicated to gauge variability in field and laboratory methods. Samples of pesticide-free blank water also were processed and handled alongside the ambient samples to detect contamination introduced during the field and laboratory procedures. (See text box on quality-control results.)
Pesticides were grouped into four classes: herbicides, insecticides, fungicides, and degradates. In all, a total of 24 herbicides, 4 insecticides, 1 fungicide, and 13 degradates were detected at least once from one or more sites during the 18-month monitoring period. Concentrations of detected compounds typically were reduced as water progressed through the three sampling locations: upstream (East Fork near Williamsburg), at the Harsha Lake intake, and in treated water (fig. 4). For example, the median concentration of atrazine from samples collected during the 18-month monitoring period decreased from 1.2 µg/L at East Fork to 0.23 µg/L at Harsha Lake to 0.09 µg/L in treated water. No compound exceeded any drinking-water standard in treated water samples, although atrazine concentrations exceeded the USEPA drinking-water standard (3 µg/L) in untreated water samples collected from the Harsha Lake intake on four dates in July and August 2000. Atrazine is a herbicide applied primarily to cornfields in the East Fork drainage basin.
The compounds most commonly detected (detection frequency greater than 60 percent) in samples collected in 1999 at the East Fork near Williamsburg were the herbicides acetochlor, alachlor, atrazine, cyanazine, metolachlor, prometon, and simazine; the fungicide metalaxyl; and the degradates 2-hydroxyatrazine, deethyl atrazine, deisopropyl atrazine, and deethyldeisopropyl atrazine. In 2000, the same compounds were detected with greater than 60 percent frequency, with the addition of the herbicides bentazon, metribuzin, and tebuthiuron. Detection statistics for samples collected in calender years 1999 and 2000 at East Fork near Williamsburg are listed in table 2 (at back of report). Also listed are results of Wilcoxon rank-sum tests in which the median concentrations of selected analytes (USGS method 2001 data only) were tested for equivalence at significance level of 5 percent (p-values < 0.05). Significantly higher median concentrations were observed in 2000 for metribuzin and tebuthiuron than in 1999 (table 2, at back of report). Although not analyzed for at the East Fork site, results obtained at other streams in the Great Miami River Basin and elsewhere in the Midwestern United States indicate that ethane sulfonic acid (ESA) and oxanilic acid (OA) degradates of acetochlor, alachlor, and metolachlor are frequently detected in agricultural streams, often at concentrations exceeding those of parent compounds (Kalkhoff and others, 1998; Clark and others, 1999).
The compounds most commonly detected in samples collected in 1999 from the intake on Harsha Lake were mostly the same as those detected at the upstream East Fork site; however, prometon was not detected as frequently and metribuzin and tebuthiuron were detected more frequently in the Harsha Lake samples. The degradates acetochlor oxanilic acid (OA), alachlor ethane sulfonic acid (ESA), alachlor OA, metolachlor ESA, and metolachlor OA, which were not analyzed for in the upstream samples, were found in more than 60 percent of the Harsha Lake samples (table 3, at back of report). Similar compounds were frequently detected in samples collected at the Harsha Lake intake and the upstream East Fork site in 2000; however, bentazon and metalaxyl fell below the 60-percent threshold, whereas the herbicides 2,4-D and 2,4-D methyl ester and the insecticide diazinon were detected in at least 60 percent of the Harsha Lake samples (table 3). Higher detection frequencies for this group of compounds may reflect inputs from streams that drain more urbanized subbasins that surround Harsha Lake downstream from the Williamsburg site (fig. 1). Significantly higher median concentrations were observed in 2000 than in 1999 for acetochlor ESA and OA, diazinon, metribuzin, prometon, and simazine (table 3, at back of report). Despite increased runoff in 2000, median cyanazine concentrations decreased in 2000 relative to 1999—a trend also observed in East Fork data—perhaps reflecting decreased use of this compound in 2000.
The pesticides most commonly detected in the treated water samples collected in 1999 were the herbicides acetochlor, alachlor, atrazine, cyanazine, metolachlor, and simazine; the fungicide metalaxyl; and the degradates 2-hydroxy-atrazine, acetochlor OA, alachlor ESA, alachlor OA, deethyl atrazine, deisopropyl atrazine, deethyldeisopropyl atrazine, metolachlor ESA, and metolachlor OA (table 4, at back of report). The pesticides most commonly detected in the samples collected in 2000 included only the herbicides acetochlor, atrazine, and metolachlor and the degradates 2-hydroxyatrazine, deethyl atrazine, deethyldeisopropyl atrazine, metolachlor ESA, and metolachlor OA. In most cases, the detection frequencies and concentrations of the pesticides were lower in the treated water samples than the intake-water samples (fig. 4). Quality-control samples (see text box on quality-control results) suggest that some reduction of organothiophosphate and carbamate compounds could result from reaction with residual chlorine rather than removal by activated carbon during treatment (Miltner and others, 1989, Aizawa and others, 1994). Pesticides detected in treated drinking water were detected at concentrations below established USEPA drinking-water guidelines. However, the concentration of some degradates were higher than concentrations observed from samples collected at the Harsha Lake intake.
Major findings of this study are that (1) concentrations of selected pesticides and pesticide degradates in East Fork and Harsha Lake can vary widely depending on climatic and seasonal conditions, (2) treatment processes used by the Bob McEwen Treatment Plant reduce pesticide concentrations to levels below existing drinking-water standards, and (3) the percentage of pesticide remaining in treated water samples was generally lower in 2000 than in 1999. The decrease corresponds with the switch from PAC to GAC treatment and suggests that GAC removed pesticide compounds more effectively than PAC did.
Pesticide concentrations in the upstream and reservoir samples varied in response to seasonal and drought-related changes in rainfall and runoff during the monitoring period. A drought in 1999 resulted in low streamflow for the East Fork at Williamsburg (fig. 5) during summer and fall. The effects of the drought on pesticide concentrations recorded in the East Fork throughout the year are not readily apparent in the aggregate pesticide data. For example, the median atrazine concentration for all samples collected in water year 1999 (October 1, 1998–September 30, 1999) was not significantly different from that recorded in water year 2000 (p = 0.72, table 2). However, from May through June 1999—the period most atrazine was applied to cornfields—the median atrazine concentration in samples from the East Fork near Williamsburg was 1.8 µg/L, which was substantially lower than the median value of 9.7 µg/L that was recorded over the same timeframe in 2000 (fig. 5). Reduction in rainfall during the drought resulted in fewer runoff events, possibly allowing pesticides to degrade in the field before getting washed into streams. Because of this, pesticide loads into the reservoir were lower in 1999 than in 2000. During 2000, wetter conditions in the spring corresponded with more runoff events and higher atrazine concentrations in the East Fork during May and June. These high concentrations were, in turn, reflected in higher atrazine pesticide concentrations in Harsha Lake in July, August, and September 2000 (fig. 5).
Within each year, pesticide concentrations in samples from the East Fork near Williamsburg were highest in the spring and early summer. Surface runoff during this period carried recently applied pesticides into streams and eventually to Harsha Lake. High pesticide concentrations were observed in the reservoir samples collected during summer 2000 (fig. 5). Higher pesticide concentrations are commonly observed in agricultural streams throughout the Nation during and after periods of pesticide applications to crops (U.S. Geological Survey, 1999; Larson and others, 1999). Throughout the summer, pesticide application and runoff events contributed to the continued transport of pesticides to the East Fork and Harsha Lake.
In 2000, atrazine concentrations were highest during the spring flush to the East Fork and Harsha Lake. For example, atrazine concentrations in samples collected from the East Fork near Williamsburg was 19 µg/L on June 7, 2000 (the highest recorded during the study). In recent years, atrazine has been the most heavily applied pesticide in the Great and Little Miami River Basins (Debrewer and others, 2000).
Thermal stratification of Harsha Lake was another seasonal factor that affected pesticide concentrations in samples collected at the reservoir intake. When the water temperature near the surface of the reservoir increased (fig. 6), the deeper, cooler water of the reservoir did not mix with the inflowing water. Preliminary analysis suggests that only about half of the reservoir volume was well mixed during the summer months. As a result, inflowing pesticides probably were concentrated in warm waters near the surface until the lake mixed completely in the late autumn or winter. To avoid high pesticide concentrations and problems with taste and odor, the Bob McEwen Treatment Plant switched from a shallow-water intake to a deeper intake in May 1999 and then switched back to a shallow-water intake in December 1999. No changes occurred during the remainder to the sampling period (Eric Heiser, Clermont County Waterworks, written commun., 2002).
As mentioned previously, the use of PAC in water treatment was replaced with the use of GAC in November 1999 (fig. 3). Although pesticide concentrations from the intake samples were typically higher in 2000 than in 1999, pesticide concentrations in treated water samples were significantly lower in 2000 (p < 0.05), with the exception of acetochlor ESA, acetochlor OA, and prometon. Among the compounds detected most frequently in the treated samples, median concentrations of acetochlor, alachlor, atrazine, cyanazine, metolachlor, and simazine in the treated water samples were significantly lower (p < 0.05) after the conversion from PAC to GAC treatment (table 4, at back of report). This decrease is reflected in plots illustrating trends in the concentrations of selected pesticide compounds (atrazine, diazinon, metolachlor, metolachlor OA, and metributzin) with time (fig. 7).
General effects of the switch from PAC to GAC treatment on pesticide concentrations in treated drinking-water samples were evaluated by calculating the percentage of pesticide remaining after treatment. The percentage of pesticide remaining after treatment was computed to show the concentration differences in pesticides observed between samples collected from the Harsha Lake intake and the treated water. As noted previously, the treatment process at the Bob McEwen Treatment Plant takes approximately 24 hours. Because of this, paired samples from the intake and treated water were not actually drawn from the same parcel of water. However, data on untreated reservoir water suggest that the concentrations of compounds that were frequently detected above the MDL are relatively stable over periods of days to weeks, intervals that exceed the 24-hour retention time in the treatment plant (fig. 5). This finding further suggests that concentration differences for pesticide samples collected on the same day are suitable for evaluating the overall effect of water treatment on pesticide concentrations in treated water. The percentage pesticide remaining after treatment was calculated as follows:

The percentage pesticide remaining after treatment was computed for each compound detected in untreated water, and the results were compared for both years.
Computations for the percentage of pesticide remaining after treatment were limited by several factors. In some cases, the comparison of intake and treated water was impossible because a compound was detected only in the treated sample and not the intake sample. This situation may have arisen because (1) false negative values were reported for the intake, whereas estimated values were reported for the treated water (see "Quality-assurance and quality-control" section—false negatives are more common below the MDL), or (2) samples were from somewhat different parcels of water with different chemical mixtures because of different sampling and retention times in the treatment plant, or (3) a pesticide compound degraded into another detected compound during treatment. In most cases where a compound was detected in the treated water sample but not in the untreated sample, the compound was an infrequently detected pesticide or degradate. When such a situation occurred, the value for the paired sample was not evaluated.
Another problem in determining the percentage of pesticide remaining was the computation of negative values, implying that the concentration of a compound increased during the treatment process; that is, the concentration of a compound was higher in treated water than in raw water. In some cases— such as the case of degradates—this may have been true. In other cases, the reported values for the treated and untreated samples were within the precision of the method or were both qualified concentrations below the MDL. Hence, the error associated with the samples may have been larger than the actual difference between them. To review environmental sample and spike data used to compute the percentage of pesticide remaining, refer to U.S. Geological Survey (2003).
[OA, oxanilic acid; <, less than]
| Compound | Samples collected in 1999 | Samples collected in 2000 | Significance in difference between 1999 and 2000 (p-value) | ||||||
|---|---|---|---|---|---|---|---|---|---|
| Number of samples | Percent remaining | Number of samples | Percent remaining | ||||||
| Minimum | Maximum | Median | Minimum | Maximum | Median | ||||
| Acetochlor | 10 | 0 | 100 | 76.5 | 10 | 0 | 100 | 8.0 | 0.0059 |
| Alachlor | 10 | 51.6 | 100 | 92.8 | 10 | 0 | 47.8 | 0 | 0.0001 |
| Atrazine | 10 | 27.6 | 96.8 | 63.0 | 10 | 1.2 | 34.5 | 2.3 | <0.0001 |
| Deethylatrazine | 10 | 44.1 | 100 | 63.4 | 10 | 0 | 19.1 | 2.5 | 0.0001 |
| Cyanazine | 10 | 52.4 | 95.5 | 65.0 | 10 | 0 | 0 | 0 | <0.0001 |
| Metolachlor | 10 | 55.8 | 94.7 | 74.9 | 10 | 2.6 | 18.4 | 5.1 | <0.0001 |
| Metolachlor OA | 5 | 71.4 | 96.9 | 90.3 | 8 | 11.9 | 78.6 | 46.5 | 0.004 |
| Prometon | 10 | 0 | 100 | 0 | 10 | 0 | 17.9 | 0 | 0.098 |
Statistical comparisons of median pesticide concentrations (Wilcoxon rank-sum test) indicate a significant decrease in percentage pesticide remaining in treated water after the plant switched to GAC treatment (table 5). Trends in the percentage of atrazine, metolachlor, and metolachlor OA remaining after treatment also suggest that testing of the nonionic polymer and closing of the second filtration unit for maintenance in June 2000 appear to have temporarily affected treatment efficiencies in the plant. Most important, both treatment schemes used by the plant resulted in pesticide concentrations in finished drinking water that were well below USEPA drinking-water standards, even during periods when concentrations of certain pesticides (such as atrazine) in Harsha Lake were above drinking-water standards.
Some compounds—such as carbaryl, chlorpyrifos, diazinon, and metribuzin—were not detected in samples treated with PAC or GAC (metribuzin and diazinon are shown in fig. 7). These pesticides could have been removed by treatment, degraded by chlorination, or were absent at detectable concentrations before treatment; therefore, no statistically significant differences were observed between sampling years. Evaluations of the general effects of treatment processes on the concentrations of method 2060 compounds and other selected pesticides are precluded by previously described quality-control/quality-assurance issues. (See text box on quality-control results.)
Spiked samples of treated water collected from the Bob McEwen Treatment Plant consistently showed low spike recoveries for organothiophosphate and carbamate compounds, which include chlorpyrifos and diazinon. Metribuzin, terbacil, and several degradates also were affected. Residual chlorine in the treated water may have caused the degradation of these compounds (Aizawa and others, 1994), leading to low recoveries in the laboratory analysis. Alternatively, these compounds could exhibit interference or masking in the analysis of treated samples. Because the analytical methods were developed for environmental water samples instead of treated water, the quality-assurance methods were not designed to compensate for chemical reactions in treated water. Therefore, lower concentrations of these compounds in treated water may actually reflect degradation resulting from chlorination, not from removal by the treatment process. This distinction is important because it means degradation products may be present in treated water. Currently, little is known about the toxicity of such degradates.
Further study would be required to better understand the fate of pesticides in Harsha Lake and the East Fork drainage basin. With a more intensive sampling schedule and information about pesticide application in urban and rural parts of the basin, it would be possible to construct a transport model that relates application rates, precipitation, and instream transport of pesticides to observed pesticide concentrations in the reservoir. Understanding how pesticide concentrations vary with depth, particularly after thermal stratification has occurred in the lake, could also help treatment-plant operators manage pesticide concentrations in source water. Furthermore, the effects of sorption to sediment, transport out of Harsha Lake, or degradation might be distinguished. In the future, such a model might be used to estimate the accumulated pesticides in the sediment of the reservoir if it is dredged or becomes filled in with sediment.
Because the treatment process leads to degradation of some compounds, additional research on the toxicity of pesticide degradates would be helpful. Finally, as land use changes within the basin, the relation between land use and water quality could be explored further to provide water-resources managers with a means of predicting likely effects of land-use change on pesticides in Harsha Lake.
Aizawa, T., Magara, Y., Takagi, H., and Souna, F., 1994, Chlorination by-products of pesticides in drinking water: Water Supply, v. 12, no. 1–2, p. SS 11–6 to SS 11–9.
Biradar, D.P., and Rayburn, A.L., 1995, Chromosmal damage induced by herbicide contamination at concentrations observed in public water supplies, Journal of Environmental Quality, v. 24, p. 1222–1225.
Blomquist, J.D., Denis, J.M., Cowles, J.L., Hetrick, J.A., Jones, R.D., and Birchfield, N.B., 2001, Pesticides in selected water-supply reservoirs and finished drinking water, 1999–2000—Summary of results from a pilot monitoring program: U.S. Geological Survey Open-File Report 01–456, 65 p.
Cheremisinoff, N.P., and King, J.A., 1994, Toxic properties of pesticides: New York, Marcel Dekker, 344 p.
Clark, G.M., Goolsby, D.A., and Battaglin, W.A., 1999, Seasonal and annual load of herbicides from the Mississippi River Basin to the Gulf of Mexico: Environmental Science & Technology, v. 33, p. 981–986.
Colburn, T., Vom Saal, F.S., and Soto, A.M., 1993, Developmental effects of endocrine disrupting chemicals in wildlife and humans: Environmental Health Perspectives, v. 101, p. 378–384.
Debrewer, L.M., Rowe, G.L., Reutter, D.C., Moore, R.C., Hambrook, J.A., and Baker, N.T., 2000, Environmental setting and effects on water quality in the Great and Little Miami River Basins, Ohio and Indiana: U.S. Geological Survey Water-Resources Investigations Report 99–4201, 98 p.
Felsot, A.S., and Pedersen, W.L., 1991, Pesticidal activity of degradation products, in Somasundaram, L., and Coats, J.T., eds., Pesticide transformation products: American Chemical Society Symposium Series, v. 459, p. 172–187.
Furlong, E.T., Anderson, B.D., Werner, S.L., Soliven, P.P., Coffey, L.J., and Burkhardt, M.R., 2001, Methods of analysis by the U.S. Geological Survey National Water Quality Laboratory—Determination of pesticides in water by graphitized carbon-based solid-phase extraction and high-performance liquid chromatography/mass spectrometry: U.S. Geological Survey Water-Resources Investigations Report 01–4134, 73 p.
Furlong, E.T., Blomquist, J.D, and Gilliom, R.J., 2003, Data reporting conventions and implications for interpreting results from custom method 9060 for samples collected from March 1, 1999, to December 31, 1999: U.S. Geological Survey National Water Quality Laboratory Technical Memorandum No. 03.01, 19 p.
Kalkhoff, S.J., Kolpin, D.W., Thurman, E.M., Ferrer, Imma, and Barcelo, Damia, 1998, Degradation of chloroacetanilide herbicides—The prevalence of sulfonic and oxanilic acid metabolites in Iowa groundwaters and surface waters: Environmental Science & Technology, v. 32, no. 11, p. 1738–1740.
Larson, S.J., Capel, P.D., and Majewski, M.S., 1997, Pesticides in surface waters—Distribution, trends, and governing factors: Chelsea, Mich., Ann Arbor Press, 390 p.
Larson, S.J., Gilliom, R.J., and Capel, P.D., 1999, Pesticides in streams of the United States—Initial results from the National Water-Quality Assessment Program: U.S. Geological Survey Water-Resources Investigations Report 98–4222, 92 p.
Lee, E.A., Kish, J.L., Zimmerman, L.R., and Thurman, E.M., 2001, Methods of analysis by the U.S. Geological Survey Organic Geochemistry Research Group—Update and additions to the determination of chloroacetanilide herbicide degradation compounds in water using high-performance liquid chromatography/mass spectrometry: U.S. Geological Survey Open-File Report 01–10, 17 p.
Miltner, R.J., Baker, D.B., Speth, T.F., and Fronk, C.A., 1989, Treatment of seasonal pesticides in surface waters: Journal of the American Water Works Association, v. 81, no. 1, p. 43–52.
Mueller, D.K., Martin, J.D., and Lopes, T.J., 1997, Quality-control design for surface-water sampling in the National Water-Quality Assessment Program: U.S. Geological Survey Open-File Report 97–223, 17 p.
National Climatic Data Center, 2002, Ohio, Division 8, precipitation 1895–2002: CLIMVIS–Climate Division Drought Data, accessed August 27, 2002, at URL http://www.ncdc.noaa.gov/tmp/drought_10877.txt
Sandstrom, M.W., Stroppel, M.E., Foreman, W.T., and Schroeder, M.P., 2001, Methods of analysis by the U.S. Geological Survey National Water Quality Laboratory—Determination of moderate-use pesticides and selected degradates in water by C-18 solid-phase extraction and gas chromatography/mass spectrometry: U.S. Geological Survey Water-Resources Investigations Report 01–4098, 70 p.
Sinclair, C.J., and Boxall, A.B.A., 2002, Assessment of the environmental properties and effects of pesticide transformation products: Silsoe, U.K., Cranfield University, Cranfield Centre for EcoChemistry, Contract JA3756a, final report, 55 p.
Shelton, L.R., 1994, Field guide for collecting and processing stream-water samples for the National Water-Quality Assessment Program: U.S. Geological Survey Open-File Report 94–455, 42 p.
Shindel, H.L., Mangus, J.P., and Trimble, L.E., 2000, Water resources data, Ohio, water year 1999: U.S. Geological Survey Water-Data Report OH–99–2, 528 p.
Shindel, H.L., Mangus, J.P., and Trimble, L.E., 2001, Water resources data, Ohio, water year 2000: U.S. Geological Survey Water-Data Report OH–00–2, 440 p.
Tessier, D.M., and Clark, J.M., 1995, Quantitative assessment of the mutagenic potential of environmental degradative products of alachlor: Journal of Agricultural and Food Chemistry, v. 43, no. 9, p. 2405–2512.
U.S. Environmental Protection Agency, 2000, Drinking water standards and health advisories: Office of Water, EPA 822–B–00–001, 12 p.
U.S. Geological Survey, 1999, The quality of our Nation's waters—Nutrients and pesticides: U.S. Geological Survey Circular 1225, 82 p.
U.S. Geological Survey, 2003, Great and Little Miami River Basins surface-water quality data: URL http://oh.water.usgs.gov/maim/swq_data.html
Wilde, F.D., Radtke, D.B., Gibs, Jacob, and Iwatsubo, R.T., eds., 1998–99, National field manual for the collection of water-quality data: U.S. Geological Survey Techniques of Water-Resources Investigations, book 9, chaps. A1–A5.
Zaugg, S.D., Sandstrom, M.W., Smith, S.G., and Fehlberg, K.M., 1995, Methods of analysis by the U.S. Geological Survey National Water Quality Laboratory—Determination of pesticides in water by C-18 solid-phase extraction and capillary-column gas chromatography/mass spectrometry with selected-ion monitoring: U.S. Geological Survey Open-File Report 95–181, 60 p.
Zimmerman, L.R., Hostetler, K.A., and Thurman, E.M., 2000, Methods of analysis by the U.S. Geological Survey Organic Geochemistry Research Group—Determination of chloroacetanilide herbicide metabolites in water using high-performance liquid chromatography-diode array detection and high-performance liquid chromatography/mass spectrometry: U.S. Geological Survey Open-File Report 00–182, 28 p.
[µg/L, micrograms per liter; *, method 2060 compound; --, not applicable; E, estimated value]
[µg/L, micrograms per liter; *, method 2060 compound; --, not applicable; E, estimated value; ESA, ethane sulfonic acid; OA, oxanilic acid]
[µg/L, micrograms per liter; *, method 2060 compound; --, not applicable; E, estimated value; ESA, ethane sulfonic acid; OA, oxanilic acid]
Document Accessibility: Adobe Systems Incorporated has information about PDFs and the visually impaired. This information provides tools to help make PDF files accessible. These tools convert Adobe PDF documents into HTML or ASCII text, which then can be read by a number of common screen-reading programs that synthesize text as audible speech. In addition, an accessible version of Acrobat Reader 6.0, which contains support for screen readers, is available. These tools and the accessible reader may be obtained free from Adobe at Adobe Access.
| AccessibilityFOIAPrivacyPolicies and Notices | |
 |
|