
 Estimation of Monthly Evaporation from Lake Ashtabula in North Dakota,
Orwell Lake in Minnesota, and Lake Traverse in Minnesota and South Dakota,
1931-2001
Estimation of Monthly Evaporation from Lake Ashtabula in North Dakota,
Orwell Lake in Minnesota, and Lake Traverse in Minnesota and South Dakota,
1931-2001Water-Resources Investigations Report 03-4282
Prepared in cooperation with the Bureau of Reclamation
View Entire Report as a pdf file
View Abstract
View Table of Contents
The full report is available in pdf format and is 476K bytes in size. Click HERE to view the report.
If you have Adobe® Acrobat® or Adobe® Acrobat® Reader® installed on your computer, you may view and print the PDF version of this report. Acrobat Reader, is a free download it from Adobe Systems, Inc.
Reservoirs on tributaries of the Red River of the North provide water for Fargo and Grand Forks, N. Dak., and other cities along the river. Adequate estimates of evaporative losses from the reservoirs are needed to determine the total water supply in the Basin. Many equations could be used to estimate lake or reservoir evaporation. However, in addition to measurements of air temperature, the equations require measurements of net radiation, wind speed, and relative humidity. Evaporation and air temperature data from energy budget evaporation sites at Wetland P1 in North Dakota and at Williams Lake in Minnesota are available. Air temperature data collected from climate stations near Lake Ashtabula in North Dakota, from Orwell Lake in Minnesota, and from Lake Traverse in Minnesota and South Dakota also are available. Therefore, the combined data sets were used to estimate monthly evaporation from Lake Ashtabula, Orwell Lake, and Lake Traverse. Averaged monthly mean air temperatures determined for each reservoir study site were used to calculate monthly evaporation data sets for 1931-2001. Results from the procedure that estimates reservoir evaporation indicate that slight downward trends in annual evaporation occurred from 1931-2001. The trends may have been caused by the selected time period of the study, which began with the drought conditions in the mid 1930's and ended with the more wet conditions in the late 1990's. Average annual evaporation values for each reservoir for 1931-2001 correspond well with published average annual lake evaporation values for 1946-55.
Abstract
Introduction
Methods of estimating evaporation
Data acquisition
Estimation of reservoir evaporation
Method considerations and limitations
Summary
References
Figures
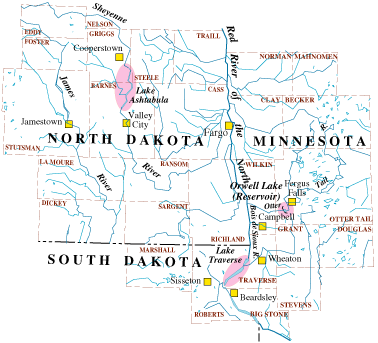
Map showing location of the Lake Ashtabula, Orwell Lake, and Lake Traverse study sites, climate stations, and
Wetland P1 and Williams Lake energy budget evaporation sites in North Dakota, Minnesota, and South Dakota
Graph showing monthly evaporation in relation to monthly mean air temperature determined from the energy
budget evaporation site at Wetland P1 in North Dakota, 1982-85 and 1987
Graph showing monthly evaporation in relation to monthly mean air temperature determined from the energy
budget evaporation site at Williams Lake in Minnesota, 1982-86
Graph showing annual evaporation determined from the regression equation for Lake Ashtabula in North Dakota,
Orwell Lake in Minnesota, and Lake Traverse in Minnesota and South Dakota, 1931-2001
Tables
Distances from reservoir study sites to Wetland P1 in North Dakota and to Williams Lake in Minnesota and
fractional contributions applied to the evaporation data sets from Wetland P1 and Williams Lake to obtain
estimated monthly evaporation from Lake Ashtabula in North Dakota, Orwell Lake in Minnesota, and
Lake Traverse in Minnesota and South Dakota
Estimated monthly evaporation, in centimeters, from Lake Ashtabula in North Dakota, 1931-2001
Estimated monthly evaporation, in centimeters, from Orwell Lake in Minnesota, 1931-2001
Estimated monthly evaporation, in centimeters, from Lake Traverse in Minnesota and South Dakota, 1931-2001
| AccessibilityFOIAPrivacyPolicies and Notices | |
 |
|