National Water-Quality Assessment (NAWQA) Program
Congress has charged the U.S. Geological Survey's National Water-Quality Assessment (NAWQA) Program with conducting an assessment of the quality of the Nation's water resources. The goals of the NAWQA Program are to describe the status and trends in the quality of a large representative part of the Nation's streams and ground-water resources and to provide a sound, scientific understanding of the primary natural and human factors that affect the quality of these resources (Leahy and Wilber, 1991). Since its passage in 1972, the Federal Water Pollution Control Act (commonly referred to as the Clean Water Act) has focused on efforts to reduce discharges of pollutants from sewage-treatment plants and other point sources. The ultimate goal of the Clean Water Act is to restore and maintain the chemical, physical, and biological integrity of the Nation's waters. However, in 1990, approximately 37 percent of the U.S. river miles that were tested still did not fully support the uses designated to them by the States (U.S. Environmental Protection Agency, 1992).
Until recently, little was known about the magnitudes of the various nonpoint and point sources of nitrogen. This knowledge gap has made it difficult to develop a national strategy for nonpoint-source pollution prevention and control.
Many of the water-pollution-control measures instituted since 1972 have focused on reducing discharges from point sources. However, one recognized limitation of the Clean Water Act is its lack of controls on nonpoint-source pollution (Knopman and Smith, 1993). These sources are called "nonpoint" because they contribute pollutants to the receiving rivers and streams at numerous and widespread locations, rather than at a single discharge point. Commercial fertilizer and animal manure are two important nonpoint sources of nitrogen. Both are applied to agricultural land throughout the United States. Atmospheric deposition is another important nonpoint source of nitrogen but receives much less recognition than other sources.
Eutrophication of surface waters is the major environmental effect of excessive nutrient inputs. The abundant growth of algae and aquatic plants that may develop in nutrient-rich waters is often unsightly and can restrict recreational uses of lakes and slow-moving rivers and streams. When this vegetation decomposes, it consumes large quantities of oxygen, which leads to fish kills, foul odors and tastes, and increased water-treatment costs.
On an annual basis, about 11.5 million tons of nitrogen are applied as commercial fertilizer for agricultural purposes throughout the United States (figure 1).
Between 1945 and 1985, commercial nitrogen fertilizer use increased twentyfold in the United States, from about 594,000 to almost 11.5 million tons per year (Alexander and Smith, 1990). A portion of the fertilizer that is applied to fields returns to the atmosphere as ammonia gas, and most of the rest is either taken up by plants or converted to nitrate in the soil. Consequently, most of the dissolved nitrogen that enters streams from runoff of agricultural fertilizer occurs as nitrate. Nitrate is a very mobile form of nitrogen--it is not readily retained by the soil and is highly soluble in water. Because of the mobility of nitrate, farmers may apply it in greater quantities than crops require. Also, given its high solubility, nitrate may be washed into adjacent streams by rain, or it may leach into the ground-water system.
Each year the 7 billion farm animals in this country produce millions of tons of manure that contains an estimated 6.5 million tons of nitrogen (figure 2).

If not properly handled and disposed of, this manure can add to the nitrogen in streams. Where farm animals are allowed to roam freely, large amounts of nitrogen are distributed over the landscape and represent a true nonpoint source of nutrients. However, where animals are confined to feedlots, barns, or sheds, they become more of a point-source nitrogen problem. In these situations, large quantities of manure commonly are concentrated in one location, and the nutrients that leach to ground and surface waters from storage areas may pose a water-quality problem.
The nitrogen in atmospheric deposition originates primarily from the combustion of fossil fuels, such as coal and oil (figure 3).

Atmospheric deposition may be in a wet form as rain, snow, hail, fog, and freezing rain or in a dry form as particulates, gases, and droplets. The largest sources are point sources--coal- and oil-burning electric utilities and large industries that together account for about 53 percent of nitrogen emissions. However, automobiles, trucks, buses, and other forms of transportation account for approximately 38 percent of nitrogen emissions.
Atmospheric inputs, in particular, have been largely ignored within the context of nonpoint-source pollution because they do not fit the traditional definition of a nonpoint source. For example, releases of nitrogen into the air from point sources, such as the com-bustion processes of powerplants and industries, are called nonpoint sources of water pollution when that nitrogen reaches water bodies through precipitation. More than 3.2 million tons of nitrogen are deposited in the United States each year from the atmosphere (figure 4).
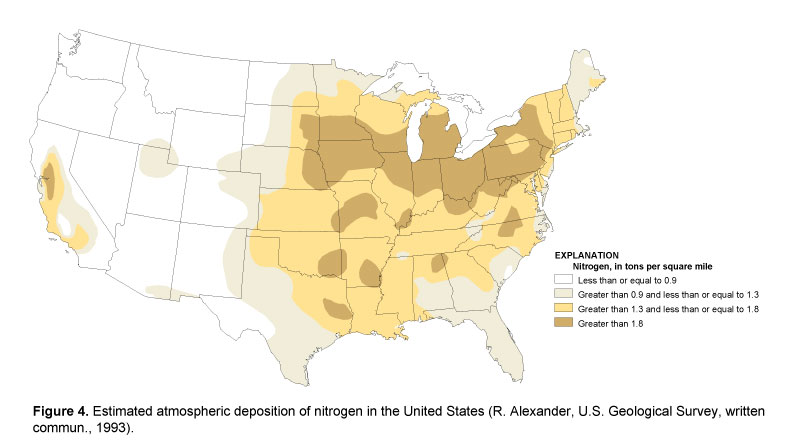
This means that about 54 percent of the nitrogen emitted from fossil-fuel-burning plants, vehicles, and other sources in the United States (Sisterson, 1990) is deposited on U.S. watersheds.
Point sources of nitrogen consist primarily of a variety of large and small industries and publicly and privately owned wastewater-treatment plants. They are distinguished from nonpoint sources in that they discharge directly into streams at a discrete point. The most recent nationwide estimates of nonpoint- and point-sources of pollution were compiled in 1984 (Gianessi and Peskin, 1984). These estimates indicated that during the period 1978 through 1981, point sources discharged approximately 1.3 million tons of nitrogen per year compared to 21.4 million tons from nonpoint sources. Industrial sources and municipal sewage-treatment plants accounted for about 26 and 74 percent, respectively, of the point-source total. However, point sources represented only 5.7 percent of the total nitrogen added to the environment, whereas agricultural nonpoint sources accounted for 93.5 percent.
The contribution of nonpoint sources to the total nitrogen added to major watersheds of the United States varies nationally from nearly zero in some predominantly urban watersheds to as much as 100 percent in agricultural and other rural watersheds (figure 5).
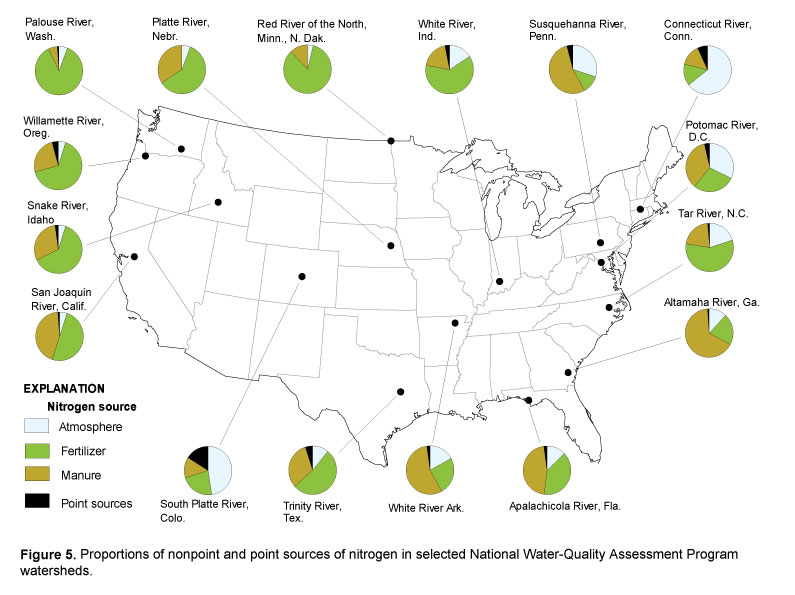
In spite of this variability, some broad generalizations can be made. In the Western United States, where agriculture is intensive, commercial fertilizers are the dominant source of nitrogen. Atmospheric deposition is the second most important source, particularly in those western watersheds devoted to forestry or in remote headwater areas. In watersheds of the Central and the Southeastern United States, commercial fertilizers are the dominant nitrogen source, again due to intensive agricultural. Animal manure is an important secondary source in the Central and the Southeastern watersheds as a result of cattle, hog, poultry, and other livestock production. In the Northeastern United States, where agriculture is less intensive, atmospheric deposition is the dominant source of nitrogen in most watersheds, and animal manure is the second most important source.
Areas of the country with the greatest rainfall and atmospheric pollution also have the greatest amounts of nitrogen deposited from the atmosphere (figure 4).
For example, in the Northeastern United States, atmospheric deposition of nitrogen in rain, snow, and other forms accounts for about one-third of the total nitrogen inputs to watersheds. The amount of nitrogen carried by streams also is generally greatest where runoff is greatest. Runoff is greatest in the Northeastern United States as are the amounts of nitrogen transported in streams (figure 6).

The proportion of in-stream nitrogen accounted for by point sources is also variable in the NAWQA Program watersheds (figure 7).
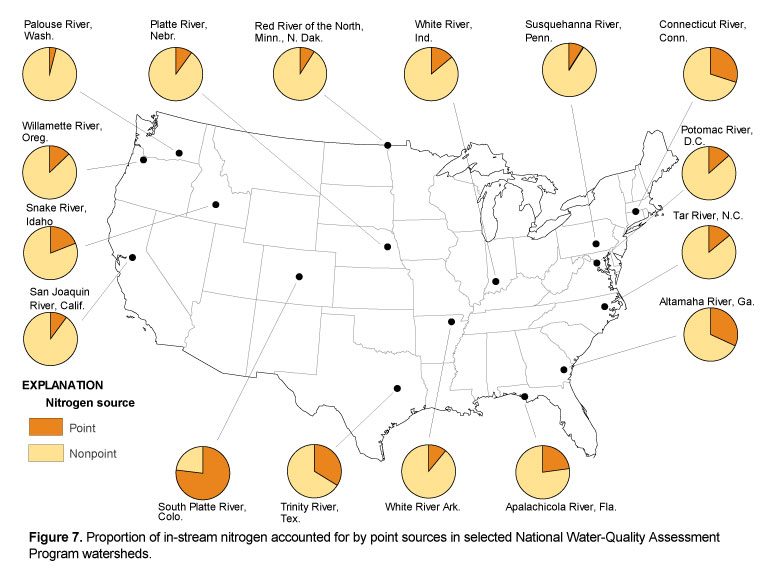
Streams near large cities such as Denver in the South Platte River Basin, Colorado, Dallas-Fort Worth in the Trinity River Basin, Texas, and Atlanta in the Appalachicola-Chattahoochee-Flint River Basin, Georgia receive relatively large proportions (up to 77 percent) of their nitrogen from point sources, such as sewage-treatment plants. However, point-source inputs of nitrogen account for less than 10 percent of the in-stream nitrogen in more than 50 percent of the watersheds studied, and less than one-half of the nitrogen in 90 percent of the watersheds studied. This means that in more than 90 percent of those watersheds, nonpoint sources of nitrogen account for more than one-half of the nitrogen in streams.
In watersheds that are largely agricultural, such as the Red River of the North in North Dakota and Minnesota and the Palouse River in Washington, nitrogen from commercial fertilizers accounts for 84 and 87 percent, respectively, of the total nitrogen added to the watersheds. Similarly, in watersheds where animals are raised in large quantities, such as the Susquehanna River in Pennsylvania and the White River in Arkansas, nitrogen from animal manure accounts for 54 and 56 percent, respectively, of the total nitrogen added to the watersheds.
Because dominant nitrogen sources vary among watersheds, it would be difficult to implement a single management strategy for nitrogen reduction that would be effective throughout the Nation. The proportion of nutrients deposited in the watershed that eventually find their way into streams also is variable. In most of the watersheds examined, only a small percentage of the nitrogen deposited in the watershed immediately reaches and is measured in the stream--the rest is removed with harvested crops, incorporated into woody vegetation, returned to the atmosphere by biological and chemical processes, or transported to the ground-water system. If water enters the ground-water system, then it may take a long time before the water is discharged to a stream. Therefore, the effects of current land-use practices may continue to show up in streams years or even decades from now.
Proportions of nonpoint and point sources of nitrogen vary from watershed to watershed throughout the United States, not necessarily following political boundaries. These proportions vary as a function of land use, population, hydrologic conditions, climate, and physiography. This variability suggests that in addition to efforts to reduce nitrogen releases from all sources to the extent feasible, pollution-prevention plans need to be developed on an individual watershed basis. In this way, the importance of sources, as well as differences in climate, soils, and water-management practices, can be taken into consideration. Developing a more complete understanding of which sources have the greatest effects on water chemistry in watersheds, and the timing of those effects, is essential to providing effective prevention and control programs.
Point sources are commonly a major source of nitrogen to streams near large urban areas. In many areas of the United States waste-treatment plants and other urban point sources still release large amounts of nitrogen to downstream river reaches. Localized effects of these point sources can exceed those of nonpoint sources scattered throughout the watershed. Therefore, concentrating pollution-prevention efforts entirely on nonpoint sources may not remedy water-quality problems near major cities.
Atmospheric deposition of nitrogen can be a major source of nitrogen that is not addressed by water-quality legislation. Because most of the sources of atmospheric deposition are point sources, this form of pollution is currently controlled by reducing nitrogen oxide emissions. Commonly these point sources are located outside of the political boundaries of watersheds that receive this atmospherically deposited nitrogen and, therefore, may not be controlled through State and local government regulations. Recent amendments to the Clean Air Act (1990) have mandated a 2-million-ton reduction in nitrogen oxide emissions (approximately 10 percent) below 1980 levels by 2000. However, after 2000, nitrogen oxide emissions are projected to increase again, which means that atmospheric deposition of nitrogen will remain a factor that needs to be considered in nitrogen-management plans.
Eutrophication of large rivers, lakes, reservoirs, estuaries, and shallow marine environments is the most immediate environmental consequence of nitrogen pollution in surface waters. Estuarine and shallow marine environments, such as the Gulf of Mexico, Puget Sound, Chesapeake Bay, Albemarle and Pamlico Sounds, Long Island Sound, and others, are considered to be sensitive to large inputs of nitrogen. Environmental planners for the Chesapeake Bay have found it necessary to control the cumulative amount of nitrogen from all watersheds that contribute to the bay as part of their management plan (Fisher and Oppenheimer, 1991). Water-quality managers in other areas of the Nation will probably find that a similar approach is required in their watersheds. For example, nitrogen discharged to the Gulf of Mexico from the Mississippi River may originate as fertilizer, animal manure, or atmospheric deposition in Minnesota, Arkansas, or Ohio.
Quantitative information is meager or unavailable for several potentially important sources of nitrogen. Leachate from septic systems, urban runoff, combined sewage overflow, and contaminated ground water are several potentially important nitrogen sources that are difficult to quantify, either because they are poorly understood or because little data on them exists. It is important to determine the amount of nitrogen contributed by these undocumented sources in watersheds to target those that contribute most to nitrogen-pollution problems. For example, it might be of little value to mandate reductions in commercial fertilizer application rates if combined sewage overflows contribute a proportionally greater amount of the total nitrogen to a stream.
Data needed to develop pollution-prevention plans are either often not being collected or not readily available. A significant limitation in determining the importance of nonpoint and point sources of nitrogen or other contaminants is the general lack of coordination between point-source- effluent monitoring and water-quality monitoring pro-grams (Zogorski and others, 1990). For example, most wastewater-treatment plants are required to monitor their effluent for ammonia nitrogen, but not for nitrate or organic nitrogen. Therefore, the total amount of nitrogen that enters critical estuaries and water bodies must be estimated. Source estimates could be improved by mandating that chemical-constituent data required by effluent-monitoring programs be consistent with those required by stream-water-quality monitoring programs.
The U.S. Geological Survey implemented the NAWQA Program in 1991 to provide water-quality information that will be useful to policymakers and managers at the national, State, and local levels. To meet this goal, the NAWQA Program is currently assessing the status and trends in the quality of a large representative part of the Nation's streams and ground waters. Liaison committees of interested national, State, and local managers and scientists meet regularly with the NAWQA Program staff to ensure that program findings are relevant to the needs of water-resources managers, provide review of products, provide assistance in field activities, and identify management implications of findings. The NAWQA Program also is designed to provide a sound, scientific understanding of the natural and human factors that affect water quality (Leahy and Wilber, 1991). In addition to determining the sources and assessing the effects of nitrogen and other nutrients on water quality, the NAWQA Program investigators are evaluating the effects of pesticides and volatile organic compounds in water and collecting aquatic biological data as indicators of overall water-quality conditions.
The NAWQA Program consists of studies of 60 major river and aquifer systems, which are referred to as "study units" (figure 8).

As a group, the 60 study units account for about one-half of the land area of the conterminous United States and 60 to 70 percent of its water use and population served by public water supply. The NAWQA Program is using a watershed-based approach to assess the quality of the Nation's ground and surface waters. The NAWQA Program results have already influenced State legislation and management plans for pesticides and organic compounds in Kansas, Washington, and elsewhere.
The water-quality and much of the nutrient source data in this report were retrieved from electronic data bases, verified, and analyzed by the following U.S. Geological Survey personnel: Scott K. Anderholm, Clyde E. Asbury, Richard W. Bell, Hugh E. Bevans, Joel D. Blomquist, Bernadine A. Bonn, Gary R. Buell, Gregory M. Clark, James C. Ebbert, Suzanne R. Femmer, Gary T. Fisher, Douglas A. Freehafer, Elizabeth A. Frick, Karen E. Greene, Robert A. Hainly, Charles R. Kratzer, David W. Litke, Jeffrey D. Martin, Gerard McMahon, Patrick J. Phillips, David C. Reutter, Dale M. Robertson, John K. Stamer, Lan H. Tornes, Peter C. Van Metre, Michael D. Woodside, and Marc J. Zimmerman. Four of the illustrations were compiled and formatted from electronic data bases by Kerie J. Hitt.
Alexander, R.B., and Smith, R.A., 1990, County-level estimates of nitrogen and phosphorus fertilizer use in the United States, 1945 to 1985: U.S. Geological Survey Open-File Report 90-130, 12 p.
Fisher, D.C., and Oppenheimer, M., 1991, Atmospheric nitrogen deposition and the Chesapeake Bay Estuary: Ambio, v. 20, p. 102-108.
Gianessi, L.P., and Peskin, H.M., 1984, An overview of the RFF Environmental Data Inventory--Methods and preliminary results: Resources for the Future, Washington, D.C., 111 p.
Kohout, E.J., Miller, D.J., Nieves, D.S., Saricks, C.L., and Stodolsky, F., 1990, Month and state current emission trends for NOx, SOx, and VOC--Methodology and results: Argonne National Laboratory.
Knopman, D.S., and Smith, R.A., 1993, Twenty years of the Clean Water Act--Has U.S. water quality improved?: Environment, v. 35, no. 1, p. 16-41.
Leahy, P.P., and Wilber, W.G., 1991, National Water-Quality Assessment Program: U.S. Geological Survey Open-File Report 91-54, 2 p.
Sisterson, D.L., 1990, Detailed SOx-S and NOx-N mass budgets for the United States and Canada, in Acidic deposition--State of Science and Technology, Appendix 8A: National Acid Precipitation Assessment Program, Washington, D.C., p. 8A-1--8A-10.
U.S. Environmental Protection Agency, 1992, National Water Quality Inventory--1990 report to Congress: U.S. Environmental Protection Agency, p. 5.
Zogorski, J.S., Blanchard, S.F., Romack, R.D., and Fitzpatrick, F.A., 1990, Availability and suitability of municipal wastewater information for use in a National Water-Quality Assessment--A case study of the Upper Illinois River Basin in Illinois, Indiana, and Wisconsin: U.S. Geological Survey Open-File Report 90-375, 68 p.