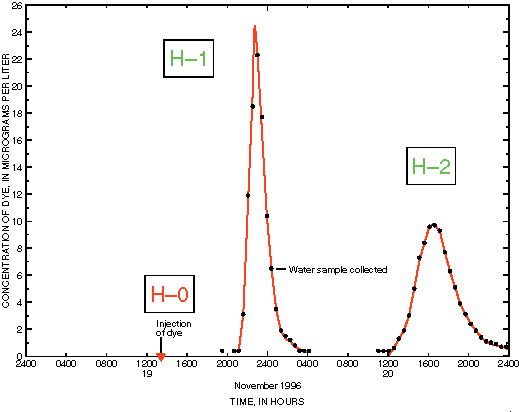
Graph showing time-concentration curves for sampling sites H–1 and H–2.
Back to Contents | Back to text