
Estimates of Bridge Scour at Two Sites on the Virgin River, Southeastern
Nevada Using a Sediment-Transport Model and Historical Geomorphic Data
U.S. Geological Survey Water-Resources Investigations Report 97-4073
By Marsha M. Hilmes and J.E. Vaill
Contents
Abstract
Introduction
Description of BRI-STARS Model
Using the Model to Estimate Bridge Scour
Assessment of General Scour
Geomorphic Processes Affecting Virgin River
Summary And Conclusions
References Cited
Contributing U.S. Geological Survey Staff
Appendix A: 1995 Surveyed Cross Sections in Relation to Resulting Model Cross
Sections
Appendix B: Channel Geometry of Cross Sections Surveyed in 1993, 1994, and 1995
Reach 1, Cross Sections 1 and 2
Reach 1, Cross Sections 3 and 4
Reach 2, Cross Sections 1 and 2
Reach 2, Cross Section 3
Reach 3, Cross Sections 1 and 2
Reach 3, Cross Sections 3 and 4
Reach 4, Cross Sections 1 and 2
Reach 4, Cross Section 3
Reach 5, Cross Sections 1 and 2
Reach 5, Cross Sections 3 and 4
Reach 6, Cross Sections 1 and 2
Reach 7, Cross Sections 1 and 2
Reach 7, Cross Section 3
Appendix C: 1994 Channel Geometry in Relation to Channel Geometry After
Synthesized 100- and 500-Year Floods
Appendix D: Name, Size, and Description of Input and Output Files for the
Estimate of Bridge Scour on the Virgin River, Southeastern Nevada
Figures
Frontispiece. Photographs showing people standing on
a recently completed bridge at Mesquite, Nev., during the flood of February 9, 1932,
and the remains of a bridge at Riverside, Nev., after the 1932 flood.
Figure 1. Map showing location of bridge sites, study reaches,
and drainage area of Virgin River upstream from Littlefield, Ariz., gaging station
Figure 2. Graph showing recorded March 1995 hydrographs and synthesized 100- and 500-year
flood hydrographs for Virgin River at Littlefield, Ariz., and Riverside, Nev.,
used in model
Figure 3. Graph showing flood-frequency curve for Virgin River at Littlefield, Ariz.
Figure 4. Graph showing cross sections of channel-bed altitude for 1996 (initial
altitudes) and for peak of 100- and 500-year floods at Mesquite and Riverside,
Nev., bridges
Figure 5. Graph showing relation of stage, mean annual discharge, and peak discharge for
Virgin River at Littlefield, Ariz., for 1929-95
Figure 6. Photographs showing Mesquite, Nev., bridge
in 1924 and 1996
Figure 7. Photograph showing Riverside, Nev., bridge circa late 1920's and in 1996
Figure 8A and B. Aerial photographs showing Mesquite, Nev., bridge area in 1938 and 1954
Figure 8C and D. Aerial photographs showing Mesquite, Nev., bridge area in 1978 and
1995
Figure 9A and B. Aerial photographs showing Riverside, Nev., bridge area in 1938
and 1953
Figure 9C and D. Aerial photographs showing Riverside, Nev., bridge area in 1978
and 1995
Figure 10. Graph showing mass curves of precipitation at St. George, Utah, and streamflow
at Virgin River at Littlefield, Ariz.
Figure 11. Graph showing annual peak discharge and annual mean discharge for Virgin River
at Littlefield, Ariz.
Figure 12. Landsat Thematic Mapper images of Riverside, Nev., bridge area May 10, 1988,
before Quail Creek Dam failure, and April 11, 1989, after dam failure
Tables
Table 1. Location of cross section end points
Table 2. Thalweg altitudes predicted by model and surveyed in 1995
Table 3. Simulated maximum contraction, channel, pier, scour or fill at Mesquite and
Riverside, Nev., bridges for 100- and 500-year flood
Table 4. Channel change for surveyed cross sections, 1993-95
Table 5. Depth of scour or fill calculated from model for 100- and 500-year floods
Table 6. Inventory of digital imagery and aerial photography used for the study of
Virgin River
Table 7. Flow angle of attack on Mesquite and Riverside, Nev., bridges as measured
from aerial photographs
Table 8. Summary of geomorphic characteristics and changes for four periods at
Mesquite and Riverside bridge sites
- Table 8.(page 1) General channel characteristics,
precipitation, streamflow and sediment transport
- Table 8.(page 2) Channel avulsion, vegetation changes, and
anthropogenic changes
Temperature: Degrees Celsius (°C) can be converted to degrees Fahrenheit
(°F) by using the formula °F = [1.8(°C)]+32. Degrees Fahrenheit
can be converted to degrees Celsius by using the formula °C =
0.556(°F-32).
Sea level: In this report, "sea level" refers to the National Geodetic
Vertical Datum of 1929 (NGVD of 1929, formerly called "Sea-Level
Datum of 1929"), which is derived from a general adjustment of the
first-order leveling networks of the United States and Canada.
Water year: A water year is the 12-month period from October 1 through
September 30. The water year is designated by the calendar year
in which it ends.
U.S. DEPARTMENT OF THE INTERIOR
BRUCE BABBITT, Secretary
U.S. GEOLOGICAL SURVEY
GORDON P. EATON, Director
Any use of trade names in this publication is for descriptive purposes only
and does not constitute endorsement by the U.S. Government
For additional information write to:
District Chief
U.S. Geological Survey
333 West Nye Lane, Room 203
Carson City, NV 89706-0866
email: usgsinfo_nv@usgs.gov
http://wwwnv.wr.usgs.gov
Copies of this report can be purchased from:
U.S. Geological Survey
Branch of Information Services
Box 25286
Denver, CO 80225-0286
(303) 202-4210
http://mapping.usgs.gov/
Orders should specify WRIR 97-4073
A bridge-scour study by the U.S. Geological Survey, in cooperation with the
Nevada Department of Transportation, began in April 1996 to evaluate the
Mesquite, Nevada, and Riverside, Nevada, bridges on the lower Virgin River using a
sediment-transport model and historical geomorphic data. The BRIdge Stream Tube
model for Alluvial River Simulation (BRI-STARS) was used to estimate bridge scour.
The model was first calibrated using data for the Virgin River flood of March 12,
1995. Surveyed channel-geometry data were available at 11 cross sections for dates
before and after the March 1995 flood to allow for evaluation of the model results.
The model estimated the thalweg altitude within plus or minus 1 meter at 10 of the
11 cross sections.
The calibrated model then was used to estimate the contraction, channel, pier, and
total scour for synthesized hydrographs for 100- and 500-year floods at the two
bridge sites. The estimated maximum total scour at the Mesquite bridge was 1.30
meters for the 100-year flood and 1.32 meters for the 500-year flood. The maximum
total scour at the Riverside bridge was 1.90 meters for the 100-year flood and 2.01
meters for the 500-year flood.
General scour was evaluated using stage-discharge relations at nearby
streamflow-gaging stations, 1993-95 channel-geometry data, and channel-geometry
data for the 100- and 500-year floods. On the basis of stage and discharge at the
Littlefield, Arizona, gaging station, no long-term trend in aggradation or
degradation was found. However, several cycles of aggradation and degradation had
occurred during the period of record; the difference between the highest and
lowest stage was 0.87 meter for a chosen low-flow discharge of 5.66 cubic meters
per second for 1929-95. The value of 0.87 meter is probably the best estimate of
general scour. The cross sections had an average scour depth of 0.07 meter between
1993 and 1994 and 0.16 meter between 1994 and 1995. The model simulated little
general scour for the 100- and 500-year floods at the cross sections and did not
give a good estimate of general scour, probably because the duration (days) of the
floods used in the model was relatively short when compared with the duration
(months or years) of geomorphic processes that influence long-term aggradation or
degradation.
Historical geomorphic changes of the Virgin River at the bridge sites and the
causes of those changes were documented using aerial photographs from 1938-95 and
other historical information. The Virgin River has become narrower and more
sinuous through time, the vegetation on the flood plain has increased, and the
channel has shifted laterally many times. The processes associated with these
channel changes were found to be long-term changes in precipitation and streamflow;
the duration, magnitude, and timing of floods; sediment-transport characteristics;
channel avulsion; changes in density of vegetation; and anthropogenic influences.
The Nevada Department of Transportation (NDOT) has determined that the bridges at
Riverside, Nev., (B-85) and Mesquite, Nev., (B-89) on the lower Virgin River will
be replaced in the near future. The Federal Highway Administration (FHWA) has
recognized the need for better procedures of designing bridges for scour
(Richardson and Davis, 1995). The FHWA, as outlined by Richardson and Davis (1995),
recommends that a bridge be designed to withstand the effects of scour from a
500-year flood, or a flow 1.7 times the 100-year flood when the 500-year flood is
unknown. Scour depths can be computed from data in a detailed hydraulic analysis
that uses procedures recommended by Richardson and Davis (1995) or by a fluvial
study using either a physical or a digital model. The BRIdge Stream Tube model for
Alluvial River Simulation (BRI-STARS; Molinas, 1990) is a digital model that has
been used to compute sediment transport and to simulate scour depths at bridges
in previous studies (Vaill, 1995; Waltemeyer, 1995). Another important aid in the
bridge-design process is an understanding of the geomorphic processes acting on
the river in combination with bridge scour.
The U.S. Geological Survey (USGS), in cooperation with NDOT, began a study in April
1996 to evaluate scour at the Mesquite and Riverside bridges on the Virgin River.
Data for 1994 (prior to the flood of March 1995) were used as input to BRI-STARS
and the model was calibrated to the documented channel changes at and near the two
bridge sites resulting from the March 1995 flood. Then the calibrated model was
used to compute scour depths for 100- and 500-year floods. An additional part of
the study was to describe the geomorphic processes in the study area. This
information will be used by NDOT to aid in the design process for the new bridges.
The flood of March 12, 1995, on the Virgin River caused major channel changes
(lateral migration of the thalweg, aggradation, and degradation). These changes
were documented by channel-geometry data collected in water years 1994 and 1995
by the USGS. The instantaneous peak flow recorded at the USGS streamflow-gaging
station at Littlefield, Ariz. (number 09415000), hereafter referred to as the
Littlefield gaging station, was 581 m3/s. This peak flow was approximately a 25-year
flood based on a log-Pearson Type III analysis (Interagency Advisory Committee on
Water Data, 1982) of 64 years of record.
This report describes the application of BRI-STARS to evaluate the documented
channel changes between field-surveyed cross-section data collected before and
after the flood of March 12, 1995, and to estimate scour depths for 100- and 500-
year floods. The report also describes the historical geomorphic changes and
associated geomorphic processes within the study area as documented by several
methods.
Historical aerial photography, channel-geometry data, bed-material particle-size
distributions, sediment-discharge data, and continuous streamflow data are
available for the Virgin River within the study area. The amount of information
provides a unique opportunity to apply the BRI-STARS model to compute channel
aggradation and degradation during a flood and to compare the results with
documented channel changes. These historical data also help to define the
geomorphic processes acting within the study area.
The Virgin River begins above Zion National Park, Utah, at an altitude of 2,621 m
above sea level, and flows southwestward through Kane and Washington Counties in
Utah, before entering the Virgin River Gorge (fig. 1). The lower Virgin River
begins where the river exits the Virgin River Gorge in Mohave County, Ariz., at
an altitude of 560 m. Upon exiting the gorge, the Virgin River flows westward and
then southward through Mohave County, Ariz., and into Clark County, Nev., before
entering Lake Mead, Nev., at an altitude of 366 m. The study area is within the
Virgin River Hydrographic Area.(footnote 1) The lower Virgin River
Valley, 0.3-1 km wide, is entrenched in terrace deposits of Quaternary age, the
highest being 85 m above the modern channel.
The USGS operates two streamflow-gaging stations on the Virgin River. The
Littlefield gaging station (number 09415000) has a drainage area of 13,183 km2
(fig. 1) and has been a continuous-recording site since 1929. The mean
annual flow for the period of record is 6.9 m3/s. The highest
instantaneous peak flow was 1,730 m3/s on January 1, 1989, as a result
of the Quail Creek Dam failure near St. George, Utah. The highest natural
instantaneous peak flow was 997 m3/s on December 12, 1966. The
instantaneous peak flow for water year 1995 was 581 m3/s on March 12.
The sediment record at Littlefield, Ariz., consists of daily sediment data for
1947-68, periodic data for 1977-79 and 1986-92, and daily sediment data for 1992-95.
At Littlefield, Ariz., the mean annual air temperature is 18°C and the
mean annual rainfall is 16 cm (National Climatic Data Center, 1992).
The Virgin River near Riverside, Nev., gaging station (number 09415190), hereafter
referred to as the Riverside gaging station, has a drainage area of 15,488
km2 and
was operated from December 1970 to September 1974 and from October 1992 to December
1995. The gage is approximately 1 km downstream from the Riverside bridge (B-85;
fig. 1). The instantaneous peak flow recorded during the period of record was 498
m3/s on September 20, 1972. The instantaneous peak flow on March 12, 1995, was 425
m3/s. The sediment record at Riverside, Nev., consists of daily
sediment data for 1992-94 and periodic data for 1994-95. Historical climate data
are not available at Riverside, Nev.; however, climatic conditions are similar to
those at Littlefield, Ariz.
Several reaches along the Virgin River from near Littlefield to downstream from
Riverside (reaches 1 through 7 on fig. 1) have available channel-geometry
information, bed-material particle-size data, historical aerial photography, and
other geomorphic data. The upstream bridge (B-89) at Mesquite is approximately
1.5 km downstream from reach 3. The downstream bridge (B-85) near Riverside is
within reaches 5 and 6, which overlap each other (fig. 1).
The object of the BRI-STARS model (Molinas, 1990) is to study complicated
sedimentation problems where the flowing water-sediment mixture interacts with the
alluvial river-channel boundaries. To accomplish this, the water-surface profile
and other hydraulic variables must be computed without interruption for
subcritical, supercritical, or a combination of both flow conditions during a
specified time step. BRI-STARS has three major components: (1) step-backwater
computations for water-surface profiles, (2) sediment-routing computations, and
(3) stream-power minimization computations. At each time step, these components
are linked together to (1) provide water-surface profile computations for the
entire channel reach, (2) compute the lateral locations of the stream tubes
(footnote 2) and other hydraulic variables for each stream tube, and
(3) route sediment transport through each stream tube satisfying the sediment
continuity equation. At the end of these computations for each time step,
bed-material compositions are revised and channel-bed altitudes are adjusted for
the next time step.
Computer modeling of stream sedimentation problems is not an easy task because the
problems tend to be multidisciplinary and multidimensional. Sedimentation models
have the limitations of being heavily data dependent and of being limited to the
character ranges of the data used to develop them. In the numerical modeling of
river systems, many variables require value assignments to properly execute the
computational processes. An advisory committee (Fan, 1988, p. 23) has stated that
"computer modeling of sedimentation problems is in the developmental stages, it is
not a true representation, but at best, an approximation of the solution to a
problem."
Owing to a lack of data during natural phenomena and to operating conditions in
physical experiments, these variables may have a large range of acceptable values.
Accuracy of the model depends on how close the values assigned to variables are to
true values of the river system.
Molinas (1990, p. 73) indicates the relative importance of the variables used
in sediment routing models. The importance is also a measure of the sensitivity of
the variables. If a variable has a high level of sensitivity, the model output
will differ significantly with small changes in the input variable and the input
variable value will need to be close to the value that occurs naturally. A
variable that has a low level of sensitivity has a wider range of input values
that can be used in the model before substantial changes in the model output
result. Unlike many other sedimentation modeling projects, an observed data base
for the Virgin River was available for use in this study to calibrate the model.
Actual data values were available for all variables identified by Molinas (1990)
as having a high degree of importance in increasing the degree of accuracy for
model results. Therefore, results of applying the BRI-STARS model in the Virgin
River should compare favorably with results from other BRI-STARS applications.
Data requirements for the model are channel geometry, bed-material size
distributions, hydrographs (streamflow and sediment-inflow), water-surface
altitudes at the initial downstream cross section, water temperature, roughness
coefficients, and a sediment-transport equation. Model-input data are available
upon request from the USGS, Nevada District office, Carson City, Nev. (appendix D).
Channel geometry can be determined from field surveys of cross sections or from
top ographic maps. Cross sections can be synthesized at different locations in
the study reach by extending survey data using valley slopes from field surveys or
computed from topographic maps. Bed-material size distributions are determined
from sieve analyses of samples collected at the study sites or from particle
counts from the study sites. Recorded hydrographs from streamflow-gaging stations
can be used in the model or synthetic hydrographs may be used after they have been
divided into periods of equal discharge for a given time step (discretized).
Sediment hydrographs based on recorded data can be used in the model or the model
can be allowed to create a sediment-inflow hydrograph using a specified
sediment-transport equation and data on the size distribution of bed material. Initial
water-surface altitudes are determined from stage-discharge relations developed
for the initial cross section or from a separate computation analysis of
water-surface profiles. Water temperatures can be estimated or a measured value can be
used in the model. Roughness coefficients for the channel and flood plain can be
estimated during a field inspection of the study sites or from inspection of
aerial photography and ground photographs of the sites.
Channel-geometry data are available from field surveys done in 1993, 1994, and
1995 for 23 cross sections in seven reaches of the study area (fig. 1). The
Universal Transverse Mercator (UTM) coordinates of the 23 surveyed cross section
end points are listed in table 1. Not all of the historical cross sections were
used in the model because some were too closely spaced, resulting in computation
problems. The 1994 cross sections used in the model are indicated in table 1.
Cross sections surveyed after the March 1995 flood were used for comparison with
cross sections generated by BRI-STARS to determine how accurately the model
simulated the observed channel changes.
To supplement the historical cross sections, additional cross sections were
synthesized by extending surveyed data using valley slopes computed from
topographic maps and from the shape of surveyed cross sections. Cross-section
data from an indirect determination of discharge at the Mesquite bridge in
January 1989 (following the Quail Creek Dam failure) were included to supplement
the historical cross-section data. Cross sections at the downstream opening of
each bridge site were surveyed in May 1996. Cross sections one bridge width
upstream from the bridge (approach section) and one bridge width downstream from
the bridge (exit section) were determined from 0.61-m contour maps provided by
NDOT.
Two subreaches that include the bridge sites and historical cross sections were
selected for use in BRI-STARS. The length of each subreach selected and the cross
sections used differed depending on the cross-section spacing and location. The
subreaches were selected to include as many historical cross sections as feasible
on the basis of the amount of synthesized data required between surveyed sites and
the increase in computational time required for model completion.
The subreach selected for model input for the Mesquite bridge (B-89) near Mesquite,
Nev., extended from 13,716 m upstream from the bridge to 5,182 m downstream from
the bridge and included five historical cross sections in reaches 2 and 3. The
subreach selected for model input for the Riverside bridge (B-85) near Riverside,
Nev., extended from 6,096 m upstream from the bridge to 2,286 m downstream from
the bridge and included six historical cross sections in reaches 4, 5, and 6.
Bed-material size distributions at the cross-section locations were available
from samples collected in 1994 and 1995. The 1995 data (Bauer and others, 1996,
p. 537-539) were used for model input unless the data were not available, such
as when the sites could not be sampled due to streamflow conditions, then the
1994 data (Clary and others, 1995, p. 564-569) were used. The size distributions
were determined from sieve analyses of the samples using 11 standard sieve sizes
(0.0625 to 64 mm) or random-walk particle counts of 100 clasts (Wolman, 1954) at
the cross sections. Generally, a cobble armor layer with a sand layer on top,
which changes in depth with space and time, is found throughout the study area.
This armoring effect was accounted for in the model by limiting the thickness of
the active layer.
The periods selected for model calibration were March 1-20, 1995, for the Mesquite
bridge and March 10-16 for the Riverside bridge. The period used for the Riverside
bridge was less than that for the Mesquite bridge because discharge data were
missing when the stream gage malfunctioned prior to the March 12 peak and on the
recession after March 13. The recorded hydrographs used in the model are shown in
figure 2. The March flood was selected for modeling because observed changes
during the January and February floods were minimal. Longer periods were not
modeled because BRI-STARS does not include algorithms that adequately describe the
dynamic processes of bank saturation from previous high flows and mass wasting
that would have contributed to the antecedent conditions of the March flood.
A 2-hour time step was selected for use in the model for the Mesquite bridge and
discharge values were selected from the recorded hydrograph for March 1-20, 1995,
from the Littlefield gaging station. A 1.5-hour time step was selected for use in
the model for the Riverside bridge and discharge values were selected from the
recorded hydrograph for March 10-16, 1995, from the Riverside gaging station.
Initial water-surface altitudes at the most downstream cross section for each
discharge value selected in each channel reach modeled were determined by a
slope-conveyance computation at the cross section.
Magnitudes of the 100- and 500-year floods were computed from a log-Pearson Type
III analysis (Interagency Advisory Committee on Water Data, 1982) of 64 years of
record at the Littlefield gaging station (1930-94) that excluded the 1989 Quail
Creek Dam failure flood. No log-Pearson Type III analysis was made for the
Riverside gaging station due to the short period of record (less than the 10 years
recommended by the Interagency Advisory Committee on Water Data, 1982). The
flood-frequency curve for the Littlefield gaging station is shown in figure 3.
The magnitude of the 100-year flood at the Littlefield gaging station was
determined to be 969 m3/s and the 500-year flood was 1,597
m3/s. On the basis
of the flood-frequency analysis for the Mesquite bridge, the December 1966 flood
(997 m3/s) was approximately equal to the 100-year flood. The 1989 Quail Creek
Dam failure flood (1,730 m3/s) was approximately equal to the 500-year flood.
Therefore, the 1966 and 1989 flood magnitudes only were used to represent the
magnitudes of the 100 and 500-year floods, respectively, in the hydrograph
synthesis.
Attenuation of peaks between the Littlefield and Riverside gaging stations was
found to be approximately 30 percent on the basis of comparison of concurrent
recorded hydrographs at the two gaging stations. For the Riverside bridge, the
1972 flood peak recorded at the Riverside gage was approximately equal to the
100-year flood when the 30 percent attenuation is applied to the flood frequency
curve (fig. 3) for the Littlefield gaging station.
Synthesized hydrographs were developed for the 100- and 500-year floods by
applying a ratio to the recorded March flood hydrographs. The value used to
increase the recorded March hydrographs was computed as the ratio of the design-flood magnitude (100- and 500-year) and the magnitude of the peak on March 11-12.
The ratios used at the Mesquite bridge were 1.72 for the 100-year flood hydrograph
and 2.98 for the 500-year flood hydrograph. The ratios used for the Riverside
bridge were 1.71 for the 100-year flood hydrograph and 2.96 for the 500-year
flood hydrograph. This approach was used to simulate flood peaks that are
representative of an actual storm and of antecedent conditions common to the time
of year when most flooding takes place. These synthesized flood hydrographs are
shown in figure 2.
The synthesized flood hydrographs described above were compared to flood
hydrographs developed using a method described by Eychaner (1976). This method is
based on analysis of 364 floods from 18 continuous gaging stations in the Colorado
River Basin of southern Utah. The drainage area for the Littlefield gage is
considerably greater than the range of drainage areas used to develop the Eychaner
method (13-777 km2) and may be a limitation of using this method. The shape and
duration of the synthetic hydrographs developed using the method described by
Eychaner (1976) were evaluated by comparison with the hydrographs for the peak
flows of record at the Littlefield gaging station in water years 1967 (997
m3/s) and 1989 (1,730 m3/s). In general, the hydrographs
developed using the method from Eychaner (1976) resulted in a shorter duration of
the peak flow than recorded by hydrographs for naturally occurring floods.
Therefore, on the basis of this analysis, the synthetic 100- and 500-year flood
hydrographs developed by applying a ratio to the March 11-12 flood hydrograph were
used in the model.
Bridge scour is limited by the availability of bed material and the capacity of the
stream to transport eroded material. The sediment-inflow hydrograph at the most
upstream cross section in a study reach can be supplied from sediment-discharge
data, or the model can develop a sediment-inflow hydrograph based on the sediment-
transport equation. If a sediment-inflow hydrograph is available, BRI-STARS
requires it to be supplied in the form of discretized sediment discharges. If the
model develops a sediment-inflow hydrograph, BRI-STARS uses a specified sediment-
transport equation from the model and the bed-material-size data to produce a
sediment-inflow hydrograph at the most upstream cross section. Current options in
the model for selection of a sediment-transport equation have been defined by Chang
(1988) and are (1) the 1973 Yang method, (2) the Acker and White method, (3) the
Engelund and Hansen method, and (4) the Meyer-Peter Mueller method. A fifth option
is to supply a generic equation of a given form. The equations from the different
methods are applicable to particle sizes of 0.0625 mm and greater.
No previously determined sediment-transport equations were available for the study
sites. On the basis of a calibration analysis of the equations available for use
in the model, the 1973 Yang method was selected for the Mesquite bridge study
reach where the predominant bed-material size was sand and the Meyer-Peter Mueller
method was selected for the Riverside bridge where the predominant bed-material
sizes were relatively coarse sand. The methods used in this study were chosen for
the model because of their accuracy and the short computational times associated
with them. The calibration analysis was done by determining which equation
resulted in the best comparison of the 1995 data with the model results.
BRI-STARS was allowed to develop sediment-inflow hydrographs at both sites using
the specified equations and the available bed-material data.
Roughness coefficients were selected by visual observation in the field during
the 1996 survey of the bridge sites. The coefficients were modified slightly after
inspection of numerous photographs taken during the field surveys. Roughness
coefficients used in the model ranged from 0.035 to 0.038 in the main channel and
from 0.060 to 0.070 for the flood plain in the Mesquite bridge reach and from
0.032 to 0.040 in the main channel and from 0.050 to 0.065 for the flood plain in
the Riverside bridge reach. Water temperature was assumed to be 18.3°C for all
floods modeled although BRI-STARS is not sensitive to temperature.
Scour is the result of the erosive action of flowing water as it excavates and
carries away material from the bed and banks of the stream. All streambed material
is susceptible to scour, but the magnitude of scour depth primarily depends on
site conditions and hydraulic characteristics of the bridge reach, so each site is
unique. The rate at which maximum scour is reached depends on the ability of the
streambed material to withstand the factors that cause scour. Total scour at a
river crossing consists of three components that, in general, are additive:
- General scour - long-term changes in the riverbed altitude,
whether from natural or human-induced causes;
- Contraction scour - constriction of the channel, either
naturally or due to the bridge, and the bridge approaches encroaching on the
flood plain; and
- Local scour - interference of the flow pattern by piers or
abutments that accelerate the flow, creating vortices that erode material
surrounding the piers or abutments.
BRI-STARS computes sediment transport as a function of shear stress, streamflow
velocity, or some other variable, and then computes contraction scour according
to the sediment-transport equation selected. Contraction scour is indicated by the
amount of channel degradation (or aggradation) computed by the model. If bridge
piers are present in the study reach, an option is available to compute local scour
due to piers. Equations recommended by Richardson and Davis (1995) are available
as options in the model; the Colorado State University equation was chosen for
this study.
A minimization routine is available in BRI-STARS that allows the model to change
channel widths or altitudes after each computational time step based on the
Minimum Stream Power Theory (Chang, 1988, p. 229). The theory states that
"for an alluvial channel, the necessary and sufficient condition of
equilibrium occurs when the stream power per unit channel length  QS
is a minimum subject to given constraints. Hence, an alluvial channel with water
discharge Q and sediment load Qs as independent variables tends to establish its
width, depth, and slope such that QS is a minimum. Since Q is a
given parameter, minimum QS also means minimum channel slope S."
QS
is a minimum subject to given constraints. Hence, an alluvial channel with water
discharge Q and sediment load Qs as independent variables tends to establish its
width, depth, and slope such that QS is a minimum. Since Q is a
given parameter, minimum QS also means minimum channel slope S."
If alteration of the channel width results in lower total stream power than raising
or lowering of the channel, channel adjustments are made in the lateral direction;
otherwise, the adjustments are made in the vertical direction.
An option in the minimization routine of BRI-STARS allows imposition of physical
limitations on the amount of lateral and vertical change in a cross section if
prior knowledge exists of any vertical constraints (bedrock, boulders, diversion
weirs, or other anthropogenic features) or lateral constraints such as levees or
riprap. A few features were noted within the study reaches but were not at the
surveyed cross-section locations. To allow the model to simulate observed changes
at the surveyed cross sections, no limits were imposed in the vertical or lateral
directions for either study subreach.
A part of a model for Water-Surface PROfile computations (WSPRO; Shearman, 1990)
has been incorporated as an option in BRI-STARS to allow analysis of sediment
transport through the bridge reach under bridge-backwater conditions. Bridge
backwater is the amount of backwater caused by encroachment on the flood plain
by the bridge and the upstream extent of bridge-affected water-surface altitudes
exceeding those of unconstricted flow. If the use of WSPRO bridge-hydraulics
routines is requested, the WSPRO data are prepared separately and stored in a
different data file. This associated data file must comply with restrictions
imposed in WSPRO. These restrictions include location of a cross section one
bridge-width upstream from the bridge (approach section), a cross section at
the downstream bridge opening that includes bridge geometry (bridge section),
a cross section at the downstream side of the bridge that represents natural
channel conditions without the bridge in place (full valley section), and a
cross section one bridge-width downstream from the bridge (exit section) for
use in the bridge hydraulics routines. Including the cross sections dictated
by WSPRO (approach, bridge, full valley, and exit) can substantially affect the
BRI-STARS computations by decreasing the flow length between cross sections and
decreasing the amount of sediment transport during each time step of the model.
Separate input files were made for each bridge according to the limitations
imposed by WSPRO. The geometry for the approach and exit cross sections was
determined from 0.61-m contour maps provided by NDOT and from data of an indirect
discharge measurement at the Mesquite bridge in January 1989. Field-surveyed data
from May 1996 were used for the bridge section.
To calibrate the BRI-STARS model for use on the study reaches of the Virgin River,
the hydrograph for the period of the March 12, 1995, flood was routed through the
study reaches using the surveyed 1994 cross-section data as model input. The
resulting cross sections were then compared with the surveyed 1995 cross sections
to determine how well the model would simulate the observed changes.
Several computational options, which include selection of a sediment-transport
equation, the time step, the number of sediment computations for each time step,
the number of streamtubes used, and the thickness of the active layer, were
evaluated to obtain the optimal combination. The optimal combination showed the
best correspondence of the resulting model cross sections to the 1995 surveyed
data. The sediment-transport equations selected for each bridge reach (see section
"Sediment Hydrographs") are not the equations that might be chosen on the basis
of bed-material size distributions in the bridge reaches; however, the best
results were obtained using these selected equations. Specifying one sediment
computation for each time step was sufficient due to the relatively short time
steps (1.5 and 2 hours) selected. Increasing the number of sediment computations
for each time step did not improve the comparison of the resulting model cross
sections with the 1995 surveyed data and also greatly increased the computational
time of the model. Two streamtubes were selected for each bridge reach.
Increasing the number of streamtubes did not improve the comparison of the model
results with the surveyed data. The thickness of the active layer was adjusted
to correspond to conditions observed during the field surveys and during the
collection of bed-material samples.
Thalweg altitudes of the resulting model cross sections and of the 1995 surveyed
cross sections, and the differences between them, are given in table 2. Plots of
the 1995 cross sections in relation to the resulting model cross sections are
shown in appendix A. The thalweg altitudes for the resulting model cross
sections as compared to the thalweg altitudes for the 1995 cross sections
were �1 m at all cross sections (table 2, appendix A) except cross section 3-3,
which is immediately downstream from the drop structure at the Bunkerville
diversion. For this cross section, the difference between model-simulated and
documented (1995) scour was greater than �1 m. This difference is because of the
"unnatural" features (concrete blocks, old cars) in the channel at this cross
section that reduce velocity and protect the channel bed that cannot be accounted
for in the model. Although the thalweg altitudes compared reasonably well, the
model results did not indicate the widening and lateral shifting of the channel
that was observed in 1995 at many of the cross sections, especially in reaches 5
and 6 near the Riverside bridge. This difference is because the model does not
include a mass-wasting routine and cannot account for the complex channel
avulsion(footnote 3) that occurred in these reaches. In summary,
the comparison between the calibration results and the observed channel changes
between 1994 and 1995 indicates that the model provides a good overall estimate
of aggradation or degradation at the bridges.
After the model was calibrated, contraction, channel, pier, and total scour were
calculated for the 100- and 500-year floods at each of the bridge sites (table 3).
Bridge cross sections at the initial channel-bed altitude (from 1994) and at the
peak of the 100- and 500-year floods are shown in figure
4. The simulated scour
for the 100- and 500-year floods was less than anticipated at the bridges,
especially at the cross sections, on the basis of scour simulated for the lower
magnitude flood of March 1995 used in the calibration process. The resulting
low scour may be due to the large amount of sediment that is transported during
the time step in which the peak flow occurs and then is deposited in the next
downstream cross section during the following time step on the hydrograph
recession. Sediment in transport at high flows will not be moved any further
downstream than the next downstream cross section by design of the model.
The BRI-STARS model does not have a component to compute general scour.
Therefore, other methods were used to estimate long-term aggradation or
degradation of the channel. Estimation is often difficult because of the
lack of long-term data. Additionally, the processes responsible for the
degradation or aggradation are important to understand so they can be
incorporated when designing new bridges.
One method for determining long-term degradation or aggradation is to evaluate
changes in gage height through time for a given discharge. On the lower Virgin
River, the Littlefield gaging station has a long period of record (1929-95).
However, approximately 20 years of the gage-height data were not available.
Although this gage is upstream from the bridge sites, it is the closest and has
the longest period for which data are available. However, two large diversion
drop structures are between the gaging station and the bridge sites. How these
structures may influence general scour estimates made upstream and applied to
the bridge sites is unknown.
Relations of stage, mean annual discharge, and peak discharge with time for the
Littlefield gaging station are shown in figure 5. A low-flow discharge of 5.66
m3/s was chosen for this analysis(footnote 4) because this flow would
be confined within the channel. This analysis was repeated for a slightly higher
discharge (11.33 m3/s) with similar results. Figure 5 shows no general, long-term
trend of aggradation or degradation;(footnote 5) however, several
cycles of aggradation and degradation occurred during 1929-95. The periods of
aggradation are generally associated with periods of lower discharge; the periods
of degradation are generally associated with periods of higher discharge, except
for a high peak flow in 1967 that resulted in aggradation. On the basis of rating
curves(footnote 6) in use on October 1 of each year of record (1929-95),
which have been adjusted to a common datum, the difference between highest and
lowest stage for the chosen low flow (5.66 m3/s) is 0.87 m. This value (0.87 m)
is the best estimate of general scour.
As shown in figure 5, approximately 20 years of gage-height data are unavailable
for use in the stage-discharge analysis. However, some interpretations about what
may have occurred during the period of missing data can be inferred from the
streamflow statistics. A series of aggradation and degradation cycles during
this period probably resulted in the 0.51 m of degradation between 1937 and 1959.
The first major period of degradation probably was associated with the high
annual mean discharge during the 1941 water year. A period of gradual aggradation
probably followed during the relatively dry period of the 1940's and early 1950's.
According to the data, the highest gage height may have been in about 1950.
Another period of degradation probably occurred during water year 1952 when the
annual mean discharge was above average. This may have been followed by a few
years of relative stability and then another period of degradation associated
with higher streamflows in 1958. Estimates from the data indicate that the lowest
gage heights of record may be associated with the degradation cycle in 1958.
The channel-geometry data that were collected for 1993-95 at the study reaches
are relatively short term, but the data cover a large part of the river and,
thus, allow for a more comprehensive understanding of changes in the system.
Figures in appendix B show the cross-section altitudes for 1993, 1994, and 1995.
Depth of scour as calculated from the difference between the thalweg altitudes
from the survey data of 1993-95 are listed in table 4. The average scour depth
for all the cross sections was 0.07 m between 1993 and 1994 and 0.16 m between
1994 and 1995.
The reach with the greatest amount of scour was reach 5, which is immediately
upstream from the Riverside bridge. Between 1993 and 1994, all four cross sections
in this reach scoured. Between 1994 and 1995, three of the four cross sections
scoured, with cross section 5-2 having the largest amount of scour (1.14 m) of
all the cross sections. The large amount of scour at cross section 5-2 was
accompanied by channel widening of approximately 58 m on the left bank, resulting
in a shift of the channel thalweg to the left bank. Some of the scour in this
reach may be linked to the lateral instability of the river in this section. The
instability appears due in part to the natural constriction at the downstream end
of this reach, which is also the site of the Riverside bridge. No other localized
causes of scour were noted.
Reach 3, upstream from the Mesquite bridge, showed relatively little scour. This
reach is at the Bunkerville diversion dam. Two of the cross sections are upstream
from the diversion and two are downstream. The two cross sections upstream from
the dam (cross sections 3-1 and 3-2) showed more scour than those below (cross
sections 3-3 and 3-4). Thus, the drop structure on the diversion dam does not
have much influence on channel scour downstream.
The dynamics of the river are seen by the large variability in the scour depths
within the reaches. For example, in reach 7 between 1993 and 1994, cross section
7-1 at the upstream end of the reach in a straight section was scouring (0.24 m),
cross section 7-2 on a meander showed only a minor amount of fill (0.02 m), and
cross section 7-3, the most downstream cross section and also in a straight
section, was filling (0.41 m). No field evidence suggests a localized cause for
this variability.
Another method used to gain a long-term estimate of general scour was to examine
the amount of scour at the historical cross sections on the basis of the
synthesized 100- and 500-year floods. Figures in appendix C show the initial
1994 channel geometry and the channel geometry after the 100- and 500-year floods
for each of the historical cross sections. The scour depth of the thalweg for the
100- and 500-year floods is listed in table 5.
These data show that the model simulated little scour for the 100- and 500-year
floods at most of the cross sections. This is probably because of the short
duration hydrograph that was used for the 100- and 500-year floods. This technique
does not give a good estimate of general scour because the duration (days) used
in the flood model was relatively short when compared with the duration (months
or years) of geomorphic processes that influence long-term aggradation or
degradation.
Understanding the geomorphic processes that are affecting the river is important
to help explain past bridge scour and design new structures. Often, only vertical
changes are examined when looking at bridge scour; however, in many rivers such
as the Virgin River, lateral changes also are important because of the high
mobility of the channel banks. Both lateral and vertical changes should be
considered to fully understand the scour processes and to quantify channel
stability.
In an attempt to gain the longest record of channel change, a variety of
historical information, including aerial photography, was used to document
the channel changes of the Virgin River through time. Understanding why the
channel has changed is difficult. Possible causes of geomorphic change include
long-term changes in streamflow, climate, sediment loads, or land use; extreme
floods; vegetation encroachment on the flood plain; diversions or dams; or other
anthropogenic influences.
Historical documents, including diary and journal entries, cadastral surveys,
(footnote 7) and early ground photographs, are the first records of
channel characteristics. These resources provide only fairly general information
related to channel characteristics, but they do extend the information time-frame.
These general descriptions of channel characteristics can be used to infer some
geomorphic processes.
Early explorers who described the lower Virgin River include Jedediah Smith, John
C. Fremont, William Henry Jackson, and Lieutenant George M. Wheeler. In 1826,
Jedediah Smith briefly described the lower Virgin River as being muddy and a
little brackish (Fletcher, 1980). In May 1844, John C. Fremont camped near present
day Littlefield, Ariz., and described the river in more detail:
- The most dreary river I have ever seen--a deep rapid stream, almost a
torrent, passing swiftly by, and roaring against obstructions (Fletcher, 1980).
Fremont visited the area in May and probably observed the river during snowmelt
runoff. His description suggests that velocities were fast and the river was
probably transporting a lot of sediment (as suggested by his use of "dreary").
In January 1867, William Henry Jackson, the well-known western photographer, wrote
in his journal describing the area near Littlefield, Ariz., at the con-fluence of
Beaver Dam Wash and the Virgin River:
- Went down Beaver Dam about a mile until we struck the Rio Virgin, a swift
turbid & very red stream. * * * Sand deep & rolling very hard. * * *
Found a great plenty of dry mesquite wood (Hafen and Hafen, 1959).
Unfortunately, Jackson did not photograph the lower Virgin River. His description
suggests that a great deal of sediment was being transported. In addition, the
description implies the dominant vegetation was mesquite and not tamarisk as it
is today.
A few years later, in 1869, Lieutenant George M. Wheeler, on a reconnaissance of
southern Nevada, described the lower Virgin River near the confluence of the
Muddy River (before Lake Mead) as:
- Its sandy bed, widened by each successive freshet [flood], changeable on account
of quicksands, carries its channel now to the one, now to the other side with a
tortuous elasticity, and most of the crossings are uncertain because of changes
in the banks and beds of quicksand (Wheeler and Lockwood, 1875).
Wheeler's description suggests that in 1869 the river was dynamic with many
channel changes, especially channel widening, occurring as the result of floods.
On the basis of his description, the channel was tightly meandering, possibly
similar to the planform of the river today in some areas. The quicksand banks
Wheeler described suggest saturation similar to visual observations made after
the series of winter floods in 1995.
Early land surveys of the Virgin River were done in 1881 by the General Land
Office. Descriptions of the vegetation and measurements of channel width and
bank height were obtained from the field notes. Vegetation mentioned included
cottonwood, mesquite, branch grass, greasewood, and willow. Measurements of the
channel width varied considerably, but in some places it was noted as being more
than 305 m wide. Compare this to the widest areas today at approximately 200-230
m. Directly comparing measurements of channel width and bank height from these
notes to present conditions is difficult because little detail was given as to
what was considered part of the channel and what was considered the top of bank.
In addition, the accuracy of some of these early surveys is questionable. A
survey done in 1912-13 of the area near the Nevada-Arizona border appears to be
more accurate and detailed than the 1881 survey. The channel in the 1912-13
survey was in some places twice as wide as at present. Vegetation in the 1912-13
survey was similar to that noted in 1881.
Ground photographs were obtained for the Mesquite and Riverside bridges that
pre-date the available aerial photography. Figure 6A was taken in 1924 at the
Mesquite bridge. The bridge shown pre-dates the current bridge and was slightly
upstream. At that time, the channel was wide and shallow. A 1996 photograph
(fig. 6B) shows a decrease in channel width, an increase in the amount of
vegetation on the flood plain, and an increase in urban development. The current
bridge at Mesquite was completed in 1931.
Figure 7A is a pre-1932 view of the bridge at Riverside, Nev. A flood in 1932
destroyed this bridge. Figure 7B is a photograph in 1996 showing the present
bridge at the same site. Comparing these two photographs shows a decrease in
channel width and an increase in the amount of vegetation.
Examination of aerial photography is one of the best ways to document long-term
channel changes. A series of aerial photographs and digital images was examined
for the two bridge sites (table 6). The earliest photographs date to 1938; the
most recent were from June 1995. Thus, they provide nearly 60 years of
information.
The first known aerial photograph for the Mesquite bridge is from 1938 (fig. 8A)
and shows a braided, wide, shallow channel that spanned the entire bridge
opening. Large, unvegetated bars were adjacent to the channel and little
vegetation was on the rest of the flood plain. Extensive agriculture was across
the entire valley, except in the active flood plain. By 1953 (fig. 8B),
the channel had narrowed to approximately one-third of the bridge width and
was less braided. Vegetation on the flood plain had become dense. Comparing
aerial photographs taken in 1964 with those taken in 1966 (not shown in fig. 8)
for an area upstream from the bridge shows that a meander on the right bank was
cut off and the channel was straight downstream from the Bunkerville diversion.
This straight channel appears to be the result of natural channel avulsion,
probably the result of a series of floods during November and December 1965,
and not due to channelization associated with the diversion. Upstream from the
diversion, the channel was meandering in 1966. The Bunkerville diversion
structure was first built when the town of Bunkerville was settled in the late
1870's. The diversion structure was replaced many times because it was frequently
destroyed by floods (Larson, 1961). In 1957, the Soil Conservation Service
completed the permanent structure at the present site.
By the early 1970's, agriculture had increased on the right bank downstream from
the bridge. Sewage treatment ponds had been built on the right bank, immediately
upstream from the bridge. Both the increase in agriculture and the construction
of the treatment ponds encroached on the flood plain and further confined the
channel as it went through the bridge. At this time, the channel was relatively
straight with some braiding. During 1976 to 1977, a distinct low-flow channel
had formed and was relatively straight approaching the bridge. This low-flow
channel spanned approximately one-eighth of the bridge. Prominent channel banks
had formed, indicating vertical scour. In 1978, additional treatment ponds were
built upstream from the bridge extending further into the flood plain (fig. 8C),
further constricting the channel upstream from the bridge. A meander formed on
the upstream edge of the treatment ponds and the channel widened and became more
sinuous. Vegetation continued to become dense and occupy more of the flood plain.
In the early 1980's, the channel upstream and downstream from the bridge shifted
laterally several times and became more sinuous. However, near the bridge, the
channel was confined not only by the bridge but also by development on the right
bank flood plain, which restricted the river from meandering as much as in areas
where the channel was not confined. In this confined zone, the valley width
available for the channel to migrate across was approximately one-quarter of the
width of the valley upstream and downstream. By the 1990's, the channel had
become dramatically narrower (fig. 8D) with vegetation covering any area that
was not part of the active channel. Also, by the early 1990's, the right-bank
flood plain changed from agricultural to urban use. In 1993 and 1995, migration
and avulsion of the channel increased in the unconfined areas of the valley
upstream from the Bunkerville diversion and downstream from the Mesquite bridge.
In the confined area near the bridge, a meander formed immediately upstream and
threatened the treatment ponds. Channelization was done after the flood of March
1995; the channel was straightened through the bridge opening in an attempt to
save the treatment ponds. In May 1996, a bank stabilization project, which
included filling and riprapping of the right bank, was completed at the bridge.
The angle of attack on the bridge piers, which can be measured from the aerial
photographs (table 7), has changed through time. From 1938-77, the angle of
attack was fairly constant at 10-17 degrees southwest. An exception was in 1973,
when the angle was 15 degrees northwest because a mid-channel bar had formed.
In the late 1970's and early 1980's, the channel was relatively straight and was
not attacking the piers at an angle. The 1990's showed an increase in the angle
of attack primarily because of the meander that had formed upstream from the
bridge.
The first known aerial photograph for the Riverside bridge was from 1938
(fig. 9A). The valley is wide upstream from the bridge and narrows below the
bridge (to approximately one-quarter of the upstream width) as a result of a
natural constriction. At that time, the river was broadly meandering and was
wide and shallow, with the width of the river spanning the entire bridge opening.
The natural constriction was enhanced by the bridge further constricting the
channel. In 1938, several unvegetated bars were adjacent to the channel.
Agricultural development was not on the flood plain at that time. By 1953
(fig. 9B), the channel had narrowed and spanned only two-thirds of the bridge
width. Vegetation had become dense on the flood plain and agricultural areas
on the left bank immediately downstream from the bridge and in a small area
upstream from the bridge further constricted the channel.
Several changes occurred between 1953 and 1973. Several large meanders formed
upstream from the bridge and two meanders had been cut off, decreasing the
sinuosity of the river. The timing of these changes is unknown, but multiple
floods during the period may have been responsible as indicated by the differences
in vegetation density in the abandoned meanders. The agricultural area seen
in 1953 upstream from the bridge was gone by 1973. By 1978 (fig. 9C), the channel
had widened in several places and several of the meanders had changed shape
and moved upstream. In 1980, several channel changes were noticeable. The most
distinctive was that the channel had straightened, cutting off the large meanders
and decreasing the sinuosity once again. The channel also widened in some areas.
By 1984, some of the areas that had been cut in 1980 were stabilizing with
vegetation, thus decreasing the channel width. In the late 1980's, a new meander
began to form in the area where the old meander was cut off.
In 1994, multiple channels had formed and the channel appeared to have widened
recently, as evidenced by a lack of vegetation on the channel margins. This
widening was probably the result of high flows in 1993. The large meander
upstream from the bridge appeared ready to be cut off by another meander
through the center. A smaller meander had formed immediately upstream from the
bridge. The 1995 photo (fig. 9D) shows some dramatic changes upstream from the
bridge, with another meander being cut off and a major shift of the channel
toward the left bank, accompanied by channel widening. Two smaller meanders
had formed in place of the larger meander. Downstream from the bridge, just
beyond the edge of the photograph (fig. 9D), the channel moved toward the left
bank approximately 150 m, leaving the Riverside gaging station abandoned.
The angle of attack on the bridge piers, which can be measured from the aerial
photographs (table 7), has changed through time. In the 1938 and 1953 photos,
the angle of attack was 45 and 49 degrees southwest, respectively. Between 1973
and 1980, the angle fluctuated back and forth from a northwest angle to a
southwest angle. Fluctuation continued in the angle of attack during the 1980's
and 1990's, with variations between 0 and 25 degrees to the northwest. This
fluctuation is associated with the changing meandering pattern of the river
and is indicative of the lateral instability at this site.
Several key geomorphic processes have been identified that are important in
understanding the changes seen near the bridge sites and for designing bridges
to account for future scour. Historical records, including climate, streamflow,
and sediment, along with field observations, were used to help relate channel
change to specific causes. The geomorphic characteristics and changes for four
periods at the bridge sites are summarized in table 8 (page 1;
page 2). These periods were chosen
on the basis of channel changes that relate to distinct changes in climate and
streamflow. Table 8 can be used to understand the complex relation of the
processes and geomorphic changes discussed in this section.
Most of the channel changes since 1938 correlate well with changes in
precipitation and streamflow, although factors such as changes in land use have
affected the stability of the river. Four periods showing major changes in
precipitation and streamflow were identified by plotting mass curves of the
long-term records of precipitation at St. George, Utah, and streamflow at
Littlefield, Ariz. (fig. 10). Climate data from St. George, Utah, were used
because most runoff in the lower Virgin River drainage basin is from southern
Utah. Other precipitation sites within the basin show similar trends. The
Littlefield gaging station provides the only long-term streamflow record.
On the basis of figure 10, the following observations are made. The late 1920's
(beginning of data) until the mid 1940's had relatively high precipitation and
streamflow. Ground and aerial photographs indicate that the channel was wide
and shallow during this period, with sparse vegetation on the flood plain.
A second period, mid-1940's to the mid-1970's, is characterized by lower
precipitation and streamflow, although the largest natural peak flood (997
m3/s)
occurred during this period. Also, during this period, the channel narrowed
considerably, probably due to aggradation and to vegetation becoming established
on the channel bars and the flood plain. A third period, the mid-1970's to
mid-1980's, is marked by an increase in precipitation and streamflow that
resulted in major channel changes, including channel widening and channel
avulsion. During a fourth period, the mid-1980's to mid-1990's, precipitation
and streamflow decreased again, and the curves have slopes similar to the
second period. This decrease resulted in the channel again narrowing as vegetation
was able to reestablish along the channel margins that had been widened during
the previous wet period. Water years 1993 and 1995 were above average for
streamflow, and major channel avulsions also occurred during these 2 years.
Some vegetation along the channel margins was removed as a result of the
channel widening during the floods. These trends in channel change related
to precipitation and streamflow over time are similar to those noted by
Hereford (1995, p. 61-62) for the upper Virgin River in Zion Canyon.
The relation of flood magnitude and duration appears to be an important factor
with regard to channel changes of the lower Virgin River. Annual peak discharge
and annual mean discharge for the Littlefield gaging station are shown in figure
11. When data in figure 11 are compared to the aerial photographs, flood
magnitude does not relate well to periods of lateral change, but annual mean
discharge better relates to periods of lateral change. For example, in 1980,
major channel changes were observed near both bridge sites including several
meanders being cut off and lateral shifting of the channel. The peak flow for
1980 was 294 m3/s, approximately a 5-year flood, whereas the annual mean discharge
was the second highest on record at 18 m3/s.
Additional evidence supporting the statement that peak flow is not a good
indicator of geomorphic change on the lower Virgin River involves the flood
resulting from the failure of Quail Creek Dam. On January 1, 1989, the dam on
Quail Creek Reservoir, an off-stream storage reservoir near St. George, Utah,
failed, resulting in a peak flow of 1,730 m3/s at the Littlefield gaging station.
This was nearly twice the discharge of the largest natural flood on record
(December 5, 1966). Enzel and others (1994) determined that the magnitude of
the flood associated with the Quail Creek Dam failure was similar in magnitude
to natural paleofloods on the lower Virgin River during the last 1,000 years.
The flood associated with the dam failure was of short duration, remaining near
peak stage for 1.5-2 hours (Carlson and Meyer, 1995). The Quail Creek Dam was
rebuilt after the 1989 flood.
The erosion and deposition that resulted from the Quail Creek Dam failure are
described by Carlson and Meyer (1995). Major channel changes occurred for
approximately 80 km downstream from the dam. For the lower Virgin River, the
effects were less evident. Carlson and Meyer (1995) noted that the channel
filled 0.03 m with sand at the Littlefield gaging station and that the flood
plain had both aggradation and degradation that decreased downstream. They did
not discuss any major lateral shifts in the channel position.
Landsat Thematic Mapper (TM) images taken before and after the Quail Creek Dam
failure for the area near the Riverside bridge are shown in figure 12. As
previously discussed, this section of the river historically has been one of the
most geomorphically dynamic reaches in the lower Virgin River, especially with
respect to lateral migration. However, the Landsat images show little evidence of
major lateral movement of the channel as a result of this flood. Other areas of
the lower Virgin River were examined on the Landsat images and no major lateral
shifts of the channel were observed. This short-duration, but extremely high peak
flow did not result in major geomorphic change in the study area.
The lack of lateral geomorphic change may be due to the short duration of the
flood. This hypothesis is supported by Costa and O'Connor (1995), who found
minimal geomorphic changes downstream from two small dam breaks in Oregon and
Washington. They attributed the lack of lateral and vertical geomorphic change
to the short duration of the flood and not to insufficient stream power
(footnote 8) (Nanson and Hean, 1985) or extraordinary stabilization
of surfaces by vegetation (Zimmerman and others, 1967). In the lower Virgin
River, major channel changes, such as in 1980, have historically resulted from
floods that had much lower peak flows and thus lower stream power than that
associated with the 1989 flood from the Quail Creek Dam failure. During some
of these lower peak discharge floods, new channels have been cut through the
vegetation or the channel has been widened resulting in major scour of a
vegetated bank. Therefore, lack of lateral geomorphic change as a result of
the 1989 Quail Creek Dam failure was not the result of insufficient stream power
or stabilization by vegetation.
Duration of the flood is more important than the magnitude of the flood when
examining the geomorphic effectiveness on the Virgin River. Longer duration
floods of moderate magnitude result in more geomorphic change than short-duration, high-magnitude floods. This is because, for the longer duration
floods, the average flood stream power per unit area is high, and total energy
expended by the flood is large (Costa and O'Connor, 1995, p. 54). This has the
potential to result in tremendous changes to alluvial channels, such as the
Virgin River, because stream power remains above the alluvial erosion threshold
(Costa and O'Connor, 1995, fig. 11) for a longer time.
The timing of floods also appears to be an important factor when attempting to
relate geomorphic processes to channel changes. As previously discussed, the
years with high annual mean flow are the years that generally have more geomorphic
changes. These years are characterized by multiple floods, generally in the
winter, and commonly are followed by high snowmelt runoff in the spring. Water
year 1995 was an excellent year to observe how the channel changed during extended
periods of high flows and to better understand the geomorphic processes that are
acting during such years.
Two small floods (peak flows, 41 m3/s and 24 m3/s, as measured at the Littlefield
gaging station) in January 1995 were followed by a larger flood in February (309
m3/s), and then two larger, closely spaced floods (544 m3/s and 581
m3/s) at the
beginning of March. Relatively little channel change was observed during the
January and February floods. On the basis of visual observations during and after
the floods, some deposition on the flood plain, removal of vegetation, and minor
bank collapse occurred near the bridge sites. The banks were saturated and in
some places quicksand was a hazard. The first flood in March resulted in
increased deposition on the flood plain in some areas and some widening and shifting of the channel upstream from the Riverside bridge. The meander upstream from
the Mesquite bridge continued to cut into the right bank near the sewage
treatment ponds. The banks were saturated after this flood and quicksand was
abundant. However, most of the major changes in the channel happened during the
second March 1995 flood.
A series of moderate, longer duration, flood-inducing storms, which generally
occur in winter, is necessary to cause major channel change. Earlier floods
saturate the banks, thus allowing future floods to easily cut a new channel,
which in turn results in channel avulsion. A high spring snowmelt runoff, as
in March 1995, helps to further establish the channel in its new position.
The period of the late 1970's and early 1980's, when good aerial photographic
coverage is available to document channel changes, also shows a large amount of
channel avulsion resulting from a series of moderate, longer duration winter
floods, specifically in 1978 and 1980.
The suggestion that winter floods generally result in large amounts of geomorphic
change is further supported by analyses of seasonal variations of suspended-sediment load of the lower Virgin River (Hilmes, 1996). More than 20 years of
sediment data show that the highest instantaneous and daily sediment loads
generally occur during winter floods, although summer and fall floods often
produce the highest instantaneous and daily sediment concentrations. The loads
are higher for the winter floods because the winter floods are generally of
longer duration and have a higher water discharge than the summer floods.
Therefore, sediment transport is generally higher for the winter floods than the
summer floods, and it directly affects channel morphology by aggradation,
degradation, or lateral shifting.
Hilmes (1996) also compared loads from water year 1993 to the historical record
of water years 1948-68 and found that the Quail Creek Dam failure did not
deplete or increase the amount of sediment available for transport in the lower
Virgin River. Annual suspended-sediment loads before and after the Quail Creek
Dam failure were commonly greater than 4 million metric tons at the Littlefield
gaging station. The highest annual suspended-sediment load on record was
6,360,000 metric tons in 1955. These data also suggest that the construction
of Quail Creek Reservoir in 1985 did not result in decreased sediment loads.
Because Quail Creek Reservoir is an off-stream impoundment and does not interfere
with the high sediment loads carried by floods on the Virgin River, it was not
unusual to find no change in the sediment loads of the mainstem river.
On the lower Virgin River, channel avulsion appears to be a much more important
process than the slower, more gradual channel migration process seen on many
rivers. Migration of meander bends does occur, and is more noticeable during the
lower streamflow years because it is often overshadowed during high streamflow
years by the much more noticeable process of channel avulsion. One important
process relating to channel avulsion is the plugging of the channel with
sediment, or aggradation. The channel becomes plugged with sediment and the river
then cuts through the saturated bank, forming a new channel and thereby
abandoning the former channel (which is usually a meander bend). Channel-geometry
surveys between 1994 and 1995 show up to 2 m of aggradation in some of the
recently abandoned channels. Sediment loads in the Virgin River, like in many
southwestern United States streams, can be high. The highest instantaneous
suspended-sediment load for the March 1995 flood measured at the Riverside bridge
was 1,430,000 metric tons per day, with an associated suspended-sediment
concentration of 40,300 mg/L and a water discharge of 411 m3/s (Bauer and others,
1996, p. 65). Bedload was not measured because of the high streamflow velocities.
However, visual analysis of the sediment deposited from the March 1995 flood
showed that large cobble-size material (median diameter, 46 mm) was transported
as bedload. These high sediment loads result in the plugging of the channel with
sediment, which leads to channel avulsion.
Vegetation changes on the flood plain of the lower Virgin River have affected
channel stability. Today, the flood plain is covered almost entirely by tamarisk
(saltcedar). Tamarisk is a non-native species, indigenous to the Mediterranean
area, that was introduced in the United States first as an ornamental plant and
then later as an erosion-control plant (Robinson, 1958). Tamarisk was thought
to have been introduced into many southwestern United States streams in the late
1800's to early 1900's when tamarisk "escaped from cultivation" (Robinson, 1965,
p. A1). However, Escalante reportedly identified tamarisk in 1776 in Fort Pierce
Wash, a tributary to the Virgin River, near the Utah-Arizona border (Christensen,
1962, p. 53).
On the basis of historical research of many southwestern streams, Christensen
(1962) found that tamarisk spread rapidly from approximately 1925 to 1960, with
the greatest invasion from approximately 1935 to 1955. This increase corresponds
with the observed changes in vegetation density seen in the historical aerial
photography for the lower Virgin River. In the 1938 photos (figs. 8A and 9A),
vegetation is sparse on the flood plain, but by 1953 (figs. 8B and 9B) the
vegetation density has greatly increased. Although the type of vegetation cannot
be positively determined from the aerial photography, tamarisk presumably
dominates.
By 1953, the vegetation occupied areas that had been part of the old channel and
this coincides with the period when channel narrowing was observed. Thus, the
vegetation encroachment and channel-narrowing process were related and probably
occurred simultaneously as a result of decreased discharges during the mid-1940's
to mid-1970's. Aggradation of the flood plain also probably occurred when the
river overflowed the banks. These geomorphic processes are consistent with those
observed on many southwestern streams (Graf, 1978, 1987; Hereford, 1984, 1986,
1995).
Tamarisk has continued to play an important role in the more recent channel
stability of the river. The density of vegetation on the flood plain continues
to increase, although it is often destroyed in localized areas along the channel
margins during higher streamflow, such as in the late 1970's-early 1980's. The
only time that large amounts of flood-plain vegetation are destroyed is when
channel avulsion occurs. However, tamarisk quickly recolonizes exposed bars
and begins to stabilize them, resulting in continued channel narrowing and
deepening. Recently, more native plants, such as willows, have begun revegetating
some of the newly exposed bars and margins of the channel where widening was
localized during the wet years of 1993 and 1995. The native vegetation may
continue to dominate these areas or the tamarisk may eventually outcompete
the native vegetation, as in the past. Regardless of the type of vegetation
now occupying the channel margins, the channel is likely to remain narrow and
meandering unless a long-term increase in streamflow results in the removal
of the vegetation on the flood plain.
Anthropogenic influences are important for understanding many of the observed
channel changes, especially at the Mesquite bridge site. The Virgin River Valley
was first colonized in 1864 at a site approximately 1.6 km upstream from
Littlefield, Ariz., near the mouth of Beaver Dam Wash. The largest early
settlement was Bunkerville, Nev., established in 1877. Bunkerville was a Mormon
agricultural community that grew cotton, grain, and fruit. The town of Mesquite
was first established in 1879, but was abandoned in 1891 due to a flood (Hulse,
1972) and then reestablished in 1895. Bunkerville, just across the river from
Mesquite, continued to be the larger town until the segment of Interstate 15 west
of Mesquite was completed, bypassing Bunkerville. In the past several years,
Mesquite has been growing rapidly as a major tourist center; the increased urban
development has resulted in many changes to the flood plain of the Virgin River,
and thus to the channel stability.
The first anthropogenic change to the flood plain was from agriculture. To
irrigate the agricultural area, several irrigation diversions were built along
the river and many are still in operation, having been rebuilt after almost every
major flood. These diversions generally control the position of the river at
least to some degree, but during periods of high streamflow the river often
destroys these structures and cuts a new channel. Through time, many owners of
these agricultural areas have tried to use some form of bank stabilization (old
cars and tires, for example) in an attempt to keep the Virgin River from eroding
the land. Stabilization efforts were often unsuccessful, especially during larger
floods. During periods of low to moderate streamflow, the bank stabilization has
constricted the channel and not allowed the river to utilize the entire flood
plain as it had historically, resulting in a narrow, deep channel with confined
meanders and steep channel gradients.
In addition to agriculture encroaching on the flood plain, more recent urban
developments, such as the sewage-treatment ponds, have further confined the
valley width and the area in which the channel is able to migrate. This
confinement appears to be a major factor associated with the scour problem at
the Mesquite bridge. The channel reach that includes the bridge is naturally
constricted compared to channel reaches upstream and downstream. The natural
constriction is further enhanced by the encroaching agriculture and sewage-treatment ponds. By forcing the river to go through a narrower opening, the
river must find a way to dissipate its energy. The two most obvious ways for
the river to dissipate its energy are to meander, reducing the channel gradient,
or to downcut, resulting in scour. Beginning about 1978, according to the aerial
photographs, the river began forming a meander that threatened the sewage
treatment ponds. This meander has been physically removed several times by
channelization, but continues to reform as the river minimizes its energy
in the constricted zone. By limiting lateral migration and further confining
the channel by continued development on the flood plain, the expected result will
be an increase in scour, causing increased problems for the structural stability
of the Mesquite bridge.
A similar response has been observed at the Riverside bridge, although this study
reach has not been as greatly influenced by anthropogenic changes. Agricultural
areas have encroached on the flood plain immediately downstream from the bridge.
The natural valley constriction at the Riverside bridge is prominent. The
response of the river has been to form large meanders upstream from the bridge.
The meandering process has not been altered and is thought to be a main reason
for the reduced scour problem at this bridge as compared with scour at the
Mesquite bridge.
A bridge-scour study by the U.S. Geological Survey, in cooperation with the
Nevada Department of Transportation, began in April 1996 to evaluate the
Mesquite, Nev., and Riverside, Nev., bridges on the lower Virgin River using a
sediment-transport model and historical geomorphic data. The BRIdge Stream Tube
model for Alluvial River Simulation (BRI-STARS) was used to estimate bridge scour.
The model was first calibrated using information from a flood on March 12, 1995.
Model-input data included channel geometry, bed-material size distributions,
streamflow-hydrograph data, water-surface altitudes at the initial downstream
cross section, a water-temperature value, roughness coefficients, and a
sediment-transport equation. Channel geometry was surveyed at 11 cross sections
for dates before and after the March 1995 flood to evaluate the model results.
The model estimated the thalweg altitude within �1 m at 10 of the 11 cross
sections. On the basis of the calibration results compared to the observed channel
changes between 1994 and 1995, the model provides a good estimate of scour at
the bridges.
The calibrated model then was used to estimate the contraction, channel, pier,
and total scour or fill for synthesized hydrographs of the 100- and 500-year
floods for the two bridge sites. The maximum contraction and channel scour or
fill at the Mesquite bridge was 0.20 m of fill for the 100-year flood and 0.22 m
of fill for the 500-year flood and at the Riverside bridge was 0.41 m of scour
for the 100-year flood and 0.47 m of scour for the 500-year flood. The maximum
pier scour at the Mesquite bridge was 1.50 m of scour for the 100-year flood and
1.54 m of scour for the 500-year flood and at the Riverside bridge was 1.49 m of
scour for the 100-year flood and 1.54 m of scour for the 500-year flood. The
maximum total scour at the Mesquite bridge was 1.30 m for the 100-year flood and
1.32 m for the 500-year flood and at the Riverside bridge was 1.90 m for the
100-year flood and 2.01 m for the 500-year flood. The simulated scour for the
100- and 500-year floods was less than anticipated at the bridges on the basis
of the scour computed for the lower magnitude floods used in the calibration
process. The cross sections also showed little scour for the 100- and 500-year
floods. The low scour may be attributed to the large amount of sediment being
transported and how the model was designed.
General scour was evaluated using stage-discharge relations, 1993-95 channel
cross sections, and channel-geometry data for the modeled 100- and 500-year
floods. No long-term trend of aggradation or degradation was determined from
analysis of stage and discharge at the Littlefield gaging station. However,
several cycles of aggradation and degradation were observed and the difference
between the highest and lowest stage was 0.87 m for 1929-95 for a chosen low-flow
discharge of 5.66 m3/s. This value is probably the best estimate of general
scour. The cross sections had an average depth of scour of 0.07 m between 1993
and 1994 and 0.16 m between 1994 and 1995. The model results for the 100- and
500-year floods showed little scour at the cross sections and did not give a good
estimate of general scour, probably because the duration (days) of the floods
used in the model was relatively short compared with the duration (months or years)
of geomorphic processes that influence long-term aggradation or degradation.
Channel morphology of the Virgin River near the Mesquite and Riverside bridges has
changed dramatically, as evident from the historical aerial photography. The
Virgin River has become narrower and more sinuous through time, the vegetation on
the flood plain has increased, and the channel has shifted laterally many times.
To understand why the river has changed through time and how this relates to the
current bridge-scour problem, all the geomorphic processes and factors need to be
considered.
Climate and streamflow records indicate that the early 1990's was a relatively
dry period, with 1993 and 1995 being abnormally high streamflow years.
Historically, the greatest channel changes have occurred during longer duration
floods that were generally part of a series of floods in which the first few do
not result in much geomorphic change, but subsequent ones result in greater
channel change, probably due to saturated channel bank conditions. Channel
avulsion, a result of sediment plugging the old channel, appears to be the
process that results in the most noticeable channel changes. Sediment loads
are higher for winter floods because winter floods are generally of longer
duration and have a greater water discharge than the summer floods. Construction
of Quail Creek Reservoir near St. George, Utah, did not result in decreased
sediment loads in the Virgin River because the reservoir is off-stream. When
Quail Creek Dam failed on January 1, 1989, the resulting flood did not cause
much geomorphic change to the lower Virgin River, probably because of its short
duration. Vegetation and anthropogenic influences, especially those related to
flood-plain encroachment, have played important roles in channel stability and
are probably key factors in the vertical scour at the bridge sites.
If any of these geomorphic factors change in the future, accompanying changes
are likely in the stability of the river. Some of these factors, such as
long-term trends in streamflow as a result of climate change and the channel
avulsion process, cannot be easily managed. However, anthropogenic influences
such as encroachment on the flood plain and regulation of flow, can be
controlled. The geomorphic processes acting on the Virgin River are among the
factors to be considered when designing bridges and other structures.
- Bauer, D.J., Foster, B.J., Joyner, J.D., and Swanson, R.A., 1996, Water
resources data, Nevada, water year 1995: U.S. Geological Survey Water-Data
Report NV-95-1, 734 p.
- Cardinalli, J.L., Roach, L.M., Rush, F.E., and Vasey, B.J., 1968, State
of Nevada hydrographic areas: Nevada Division of Water Resources map, scale
1:500,000.
- Carlson, D.D., and Meyer, D.F., 1995, Flood on the Virgin River, January
1989, in Utah, Arizona, and Nevada: U.S. Geological Survey Water-Resources
Investigations Report 94-4159, 21 p.
- Chang, H.H., 1988, Fluvial processes in river engineering: Malabar, Fla.,
Krieger Publishing Company, 432 p.
- Christensen, E.M., 1962, The rate of naturalization of Tamarix in Utah:
The American Midland Naturalist, v. 68, no. 1, p. 51-57.
- Clary, S.L., McClary, D.R., Whitney, Rita, and Reeves, D.D., 1995, Water
resources data, Nevada, water year 1994: U.S. Geological Survey Water-Data
Report NV94-1, 768 p.
- Costa, J.E., and O'Connor, J.E., 1995, Geomorphically effective floods,
in Costa, J.E., Miller, A.J., Potter, K.W., and Wilcock, P.R., eds., Natural and
anthropogenic influences in fluvial geomorphology: American Geophysical Union,
Geophysical Monograph 89, p. 4556.
- Enzel, Yehouda, Ely, L.L., Martinez-Goytre, Juan, and Vivian, R.G., 1994,
Paleofloods and a dam-failure flood on the Virgin River, Utah and Arizona:
Journal of Hydrology, v. 153, p. 291-315.
- Eychaner, J.H., 1976, Estimating runoff volumes and flood hydrographs in
the Colorado River basin, southern Utah: U.S. Geological Survey Water-Resources
Investigations Report 76-102, 18 p.
- Fan, Shou-shan, ed., 1988, Twelve selected computer stream sedimentation
models developed in the United States: Federal Energy Regulatory Commission,
Interagency Advisory Committee on Water Data.
- Fletcher, F.N., 1980, Early Nevada--The period of exploration 1776-1848:
Reno, University of Nevada Press, 183 p.
- Graf, W.L., 1978, Fluvial adjustments to the spread of tamarisk in the
Colorado Plateau region: Geological Society of America Bulletin, v. 89, p.
1491-1501.
- -----1987, Late Holocene sediment storage in canyons of the Colorado
Plateau: Geological Society of America Bulletin, v. 99, p. 261-271.
- Hafen, L.R., and Hafen, A.W., eds., 1959, The diaries of William Henry
Jackson, frontier photographer--to California and return, 1866-67; and with
the Hayden Surveys to the central Rockies, 1873, and to the Utes and cliff
dwellings, 1874: Glendale, Calif., A.H. Clark Co., The Far West and the Rockies
Historical Series, 1820-1875, v. 10, 345 p.
- Hereford, Richard, 1984, Climate and ephemeral-stream processes--
Twentieth-century geomorphology and alluvial stratigraphy of the Little Colorado
River, Arizona: Geological Society of America Bulletin, v. 95, p. 654-668.
- -----1986, Modern alluvial history of the Paria River basin, southern
Utah: Quaternary Research, v. 25, p. 293-311.
- -----1995, Geomorphic history of the Virgin River in the Zion National
Park area, southwest Utah: U.S. Geological Survey Open-File Report 95-515, 75 p.
- Hilmes, M.M., 1996, Seasonal variation of suspended-sediment transport
in the lower Virgin River, Arizona and Nevada: Sixth Federal Interagency
Sedimentation Conference, Subcommittee on Sedimentation, Interagency Advisory
Committee on Water Data, Las Vegas, March 1996, Proceedings, v. 2, p. poster
6 - poster 11.
- Hulse, J.W., 1972, The Nevada adventure--A history: Reno, University
of Nevada Press, 324 p.
- Interagency Advisory Committee on Water Data, 1982, Guidelines for
determining flood flow frequency: Washington, D.C., Interagency Advisory
Committee on Water Data, Hydrology Subcommittee Bulletin 17B, 183 p.
- Larson, A.K., 1961, I was called to Dixie: Salt Lake City, Utah,
Deseret News Press, 681 p.
- Molinas, Albert, 1990, User's Manual for BRI-STARS--BRIdge Stream Tube
model for Alluvial River Simulation: Fort Collins, Colo., Hydrau-Tech, Inc.,
National Cooperative Highway Research Program Project Report, 80 p.
- Nanson, G.C., and Hean, D., 1985, The West Dapto flood of February
1984--Rainfall characteristics and channel changes: Australian Geography, v. 16,
no. 4, p. 249-258.
- National Climatic Data Center, 1992, Monthly station normals of
temperature, precipitation, and heating and cooling degree days, 1961-90:
National Oceanic and Atmospheric Administration, Climatography of the United
States no. 81, 21 p.
- Richards, Keith, 1982, Rivers, form and process in alluvial channels:
New York, Methuen and Company, 361 p.
- Richardson, E.V., and Davis, S.R., 1995, Evaluating scour at bridges:
Federal Highway Administration Hydraulic Engineering Circular 18, Publication
FHWA-IP-90-017, 203 p.
- Robinson, T.W., 1958, Phreatophytes: U.S. Geological Survey Water-Supply
Paper 1423, 84 p.
- -----1965, Introduction, spread, and areal extent of salt-cedar
(Tamarix) in the western states: U.S. Geological Survey Professional
Paper 491-A, 12 p.
- Rush, F.E., 1968, Index of hydrographic areas in Nevada: Nevada Division
of Water Resources, Information Report 6, 38 p.
- Shearman, J.O., 1990, User's manual for WSPRO--A computer model for
water-surface profile computations: Federal Highway Administration Publication
FHWA-IP-89-027, 177 p.
- Vaill, J.E., 1995, Application of a sediment transport model to estimate
bridge scour at selected sites in Colorado, 1991-93: U.S. Geological Survey
Water-Resources Investigations Report 95-4179, 37 p.
- Waltemeyer, S.D., 1995, Bridge-scour analysis on Cuchillo Creek at the
Interstate 25 crossing near Truth or Consequences, New Mexico: U.S. Geological
Survey Water-Resources Investigations Report 95-4050, 29 p.
- Wheeler, G.M., and Lockwood, D.W., 1875, Preliminary report upon a
reconnaissance through southern and southeastern Nevada [Geographical Surveys
West of the 100th Meridian]: Washington, D.C., Government Printing Office, 72
p.
- Wolman, M.G., 1954, A method of sampling coarse river-bed material:
American Geophysical Union Transactions, v. 35, no. 6, p. 951-956.
- Zimmerman, R.C., Goodlett, J.C., and Comer, G.H., 1967, The influence
of vegetation on channel form in small streams: International Association of
Hydrologic Science Publication, v. 75, p. 225-275.
DATA-COLLECTION SUPPORT
- Lynn Metcalf, Hydrologist
- Ronald F. Locke, Hydrologic Technician
- Gary C. Gortsema, Hydrologic Technician
- DeLoy C. Emmett, Hydrologic Technician
- Darren D. Reeves, Hydrologic Technician
- Thomas G. Kane, Hydrologic Technician
- Ron P. Collins, Hydrologic Technician
- Alan D. Robl, Hydrologic Technician
- Daniel E. Hitch, Supervisory Hydrologic Technician
REMOTE-SENSING SUPPORT
- Brian D. Reece, Hydrologist
- J. LaRue Smith, Hydrologist
- Marianne August, Physical Scientist
PUBLICATIONS SUPPORT
- Robin L. Sweet, Technical Editor
- Shannon C. DeMeo, Editorial Assistant
- J. Christopher Stone, Scientific Illustrator
- Graham A. Patterson, Scientific Illustrator
TECHNICAL SUPPORT
- K. Michael Nolan, Regional Surface-Water Specialist
- Glen W. Hess, acting District Surface-Water Specialist
- Stephen E. Hammond, Hydrologist
- Joseph P. Capesius, Hydrologist
Footnotes
-
(1)
- Formal hydrographic areas in Nevada were delineated
systematically by the U.S. Geological Survey and Nevada Division of Water
Resources in the late 1960's (Rush, 1968; Cardinalli and others, 1968) for
scientific and administrative purposes. The official hydrographic-area names,
numbers, and geographic boundaries continue to be used in U.S. Geological
Survey scientific reports and Division of Water Resources administrative
activities.
-
(2)
- A stream tube is a section of channel that carries a
constant discharge along its length.
- (3)
- Avulsion is the process where the river cuts a new
channel by shifting laterally in a rapid, somewhat random manner. Gradual
lateral migration of the river is not considered avulsion.
- (4)
- The metric value of 5.66 m3/s is equivalent to 200
cubic feet per second.
- (5)
- NDOT compared bridge-construction plans and the
approximate current flowline and determined that the river bed has lowered
more than 2 m at the bridge sites (Paul Frost, NDOT, written commun., 1996).
The estimated 2 m of scour at the bridges as reported by NDOT is due in part to
contraction and local scour and, therefore, is not representative of general
scour.
- (6)
- Rating curves graphically relate gage height to water
discharge.
- (7)
- Cadastral surveys are the original land
surveys used for defining property boundaries.
- (8)
- Stream power is the rate of potential energy
expenditure per unit length of channel, or the rate of doing work
(Richards, 1982, p. 13).
Return to WRIR 97-4043 homepage
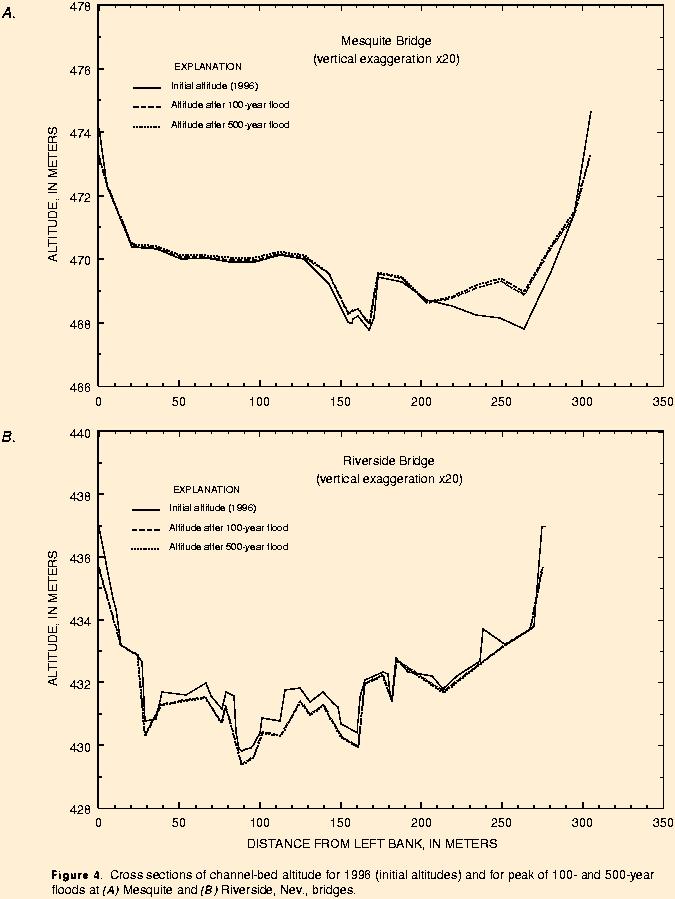