![]()

This document also is available in pdf format: ![]() WRIR 98–4236
WRIR 98–4236
(Requires Adobe
Acrobat Reader)
| Figure 1. Location of study area, sampling sites, and general land use in the Eagle River Basin. |
|
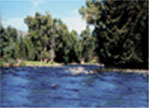
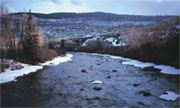
Low-flow conditions at site 3 in September. Photograph by Cory Stephens. |
Five sites were selected on the Eagle River to collect water-quality and stream-biota data during two low-flow periods (fig. 1). Site 1 represents minimal effects from urban/recreational land use. Sites 2, 3, and 4 are within areas of increasing urban/recreational land use. Site 5 is near the mouth of the Eagle River and represents the outlet from the study area and the cumulative effects of all land uses. Low-flow periods can be important from water-quality and stream-ecology perspectives because less water is available to dilute any contaminants entering the streams.
This study was based on a limited data set from only two sampling periods. The objectives of this study were to (1) characterize the current water quality and biological community at selected sites in the Eagle River; (2) assess relations among nutrient concentrations and stream biota at selected sites; (3) describe changes in the algal community over time at one site; and (4) assess differences in summer low-flow conditions and peak winter recreational-use low-flow conditions. This report presents results of field measurements and chemical (major ions and nutrients) and biological (benthic algae and macroinvertebrates) sampling during summer (1997) and winter (1998) low-flow conditions.
Water and biological samples were collected in September 1997 and February 1998. Water samples were collected using the equal-width-increment method and processed using standard surface-water protocols (Shelton, 1994). Water samples were analyzed for major ions and nutrients. Field measurements consisted of temperature, pH, specific conductance, dissolved oxygen, and streamflow. Habitat characteristics were documented at each site using Rapid Bioassessment Protocols (Barbour and others, 1997). A composite of five each of algae and macroinvertebrate samples was collected in riffle areas in the stream and analyzed for species composition and abundance and biomass for algal samples (Cuffney and others, 1993; Porter and others, 1993).
|
Figure 2. Annual hydrograph and streamflow during the sampling period. |
Major-ion chemistry (ions that represent the majority of the dissolved-solids content [Hem, 1992]) and field measurements commonly change as the sources of water generating the streamflow change. Concentrations of the major ions from the samples collected during the two periods are listed in table 1. The water chemistry changed in a downstream direction as the water flowed from the higher mountainous areas down into the lower Eagle River Basin where sedimentary rocks predominate. The Eagle Valley Evaporite and the Eagle Valley Formation are common in the lower part of the study area at sites 4, 5, and to some extent site 3 (Tweto and others, 1978). The sites in the lower part of the study area, especially site 4, had greater percentages of sodium and chloride than sites upstream. Concentrations of the major ions increased downstream and were greater in the February samples than in the September samples. Water chemistry was different between the two sampling periods possibly because the percentage of flow contributed by or interacting with ground water increased. For example, the percentage of sulfate was generally greater in the February than the September samples.
Table 1. Major-ion concentrations
[Concentrations in milligrams per liter; <, less than]
|
Site
number |
Site
|
Site name
abbreviation |
Cations
|
|||||||
|
Calcium
|
Magnesium
|
Sodium
|
Potassium
|
|||||||
|
Sept.
1997 |
Feb.
1998 |
Sept.
1997 |
Feb.
1998 |
Sept.
1997 |
Feb.
1998 |
Sept.
1997 |
Feb.
1998 |
|||
|
1
|
Eagle River below Minturn |
Minturn
|
17
|
33
|
6.4
|
12
|
2.0
|
12
|
0.6
|
1.1
|
|
2
|
Eagle River at Avon |
Avon
|
32
|
48
|
7.7
|
13
|
4.2
|
12
|
0.9
|
1.3
|
|
3
|
Eagle River at Edwards |
Edwards
|
37
|
54
|
8.7
|
14
|
5.0
|
11
|
1.0
|
1.5
|
|
4
|
Eagle River near Wolcott |
Wolcott
|
44
|
72
|
9.9
|
17
|
39
|
79
|
1.6
|
3.0
|
|
5
|
Eagle River at Gypsum |
Gypsum
|
75
|
100
|
14
|
22
|
44
|
64
|
2.0
|
2.8
|
|
Site
number |
Site
|
Site name
abbreviation |
Anions
|
|||||||
|
Alkalinity
|
Chloride
|
Fluoride
|
Sulfate |
|||||||
|
Sept.
1997 |
Feb.
1998 |
Sept.
1997 |
Feb.
1998 |
Sept.
1997 |
Feb.
1998 |
Sept.
1997 |
Feb.
1998 |
|||
|
1
|
Eagle River below Minturn |
Minturn
|
53
|
70
|
0.6
|
2.3
|
<0.1
|
<0.1
|
19
|
81
|
|
2
|
Eagle River at Avon |
Avon
|
71
|
90
|
3.2
|
7.9
|
<0.1
|
0.1
|
43
|
90
|
|
3
|
Eagle River at Edwards |
Edwards
|
78
|
96
|
4.0
|
8.9
|
<0.1
|
0.1
|
52
|
98
|
|
4
|
Eagle River near Wolcott |
Wolcott
|
112
|
111
|
58
|
120
|
<0.1
|
0.1
|
65
|
140
|
|
5
|
Eagle River at Gypsum |
Gypsum
|
113
|
135
|
49
|
93
|
<0.1
|
0.1
|
140
|
210
|
Data from field measurements for the two sampling periods are shown in figure 3. The specific conductance of the water (an indication of the dissolved ionic concentration) increased rapidly as the water moved between sites 3 and 4, probably as a result of point and nonpoint influences and interactions with the sedimentary geology of the lower Eagle River Basin. Dissolved oxygen was at or near saturation at all sites during both data-collection periods. The greater dissolved-oxygen concentrations for February are a result of the colder water temperatures (water temperatures during the September sampling period ranged from 13 to 18.5 degrees Celsius and during the February sampling period ranged from 2 to 4.5 degrees Celsius). The pH ranged from 8.1 to 8.8, and the maximum value was measured at site 4 during both periods.
Nutrients (nitrogen and phosphorus) are essential for plant growth. Algae and aquatic vegetation depend on nitrogen and phosphorus compounds for nutrient supply (Hem, 1992). Excessive concentrations of nutrients may lead to an overabundance of aquatic plants. Selected results from the sampling for nutrients are shown in figure 4. Ranges of concentrations for all samples collected by other programs of the USGS during water years 1993 to 1997 for sites 2 and 5 also are shown in figure 4. The ranges of 1993 to 1997 data are shown to provide comparison of data collected for this study to longer term data and concentrations that represent other seasons. Data are from the U.S. Geological Survey National Water Information System (NWIS).
Nutrient concentrations generally were low but increased in a downstream direction, most often reaching maximum concentrations at site 4. The increase in concentrations reflected inputs from point and nonpoint sources. Nutrient concentrations of the February period were nearly always greater than those of the September period. Nitrate concentrations were less than the 10 mg/L (milligram per liter) stream standard and ammonia was less than the State of Colorado aquatic life standards that vary according to temperature and pH. The ammonia and nitrite plus nitrate data collected during the September and February samplings are similar to the intermediate range of the 1993–97 data. The September phosphorus value is near the minimum observed 1993–97 data at sites 2 and 5 (fig. 4). Total phosphorus concentrations are not shown because the dissolved concentrations are within 0.02 mg/L of the total concentrations; thus, most of the phosphorus was detected in the dissolved state during these sampling periods.
The loads for dissolved inorganic nitrogen (DIN) (ammonia plus nitrite plus nitrate) and dissolved phosphorus are shown in figure 5. The loads generally were greater during the February period and exhibited similar downstream changes for both sampling periods. Loads increased substantially between sites 2 and 4 (as a result of point and nonpoint sources), reaching peak values at site 4. Dissolved inorganic nitrogen loads then decreased slightly at site 5, and phosphorus loads decreased substantially at site 5.
One important aspect of relating biological communities to water quality is the assessment of available habitat for aquatic organisms. Habitat is the physical environment in which aquatic organisms live. Biological communities may be affected by habitat quality as well as water quality. Rapid Bioassessment Protocols (RBPs) (Barbour and others, 1997) are qualitative and evaluate instream habitat, channel morphology, bank features, and riparian vegetation. This protocol involves rating 10 habitat parameters as optimal, suboptimal, marginal, or poor. Habitat scores for the sampling sites in this study were in the optimal and suboptimal ranges, which indicated suitable habitat was present for aquatic communities at all of the study sites. The RBPs are used as a screening tool and may not account for subtle differences in habitat that can affect biological communities.
Benthic algae are important primary producers in streams and are a food source for macroinvertebrates. Algal communities and algal biomass can be indicators of water-quality conditions. Algae integrate water-quality conditions from several weeks to months. Relative abundance of the different taxa in an algal community can be useful in interpretation of water-chemistry constituents, especially nutrients. Although nitrogen and phosphorus are essential for aquatic life, an overabundance of nutrients in surface water can cause nuisance growth of algae. The overabundance of algae can lead to water-quality concerns, including large shifts in dissolved oxygen. Aquatic life, such as fish, can be adversely affected by these shifts if concentrations of dissolved oxygen become too low.
Chlorophyll-a values were used to estimate the algal biomass at the sampling locations (fig. 6). The chlorophyll-a values reported in this study are indicative of unenriched to moderately enriched streams. Median chlorophyll-a values for unenriched and moderately enriched streams are 1.7 and 21 milligrams per square meter, respectively (Biggs, 1996). Algal biomass generally increased as nutrient concentrations increased except at site 4.
Distributions of the major algal divisions are shown in figure 7. Diatoms comprised more than 97 percent of the algal biomass at the study sites. Because diatoms represent most of the algal biomass, diatom tolerance groups for nutrients were used to assess changes in the algal community (Bahls, 1992). The tolerance groups are based on the species and categorized as “sensitive” (oligotrophic), “less sensitive” (mesotrophic), and “most tolerant” (eutrophic). All five sampling sites contained predominantly “sensitive” and “less sensitive” species. The percentages of the “most tolerant” species among sites are shown in figure 8. Sites 3 and 4 had the largest percentages of the “most tolerant” species. For both sampling periods, the percentage of the “most tolerant” species generally followed patterns similar to the DIN concentrations (fig. 8). Several factors may contribute to these changes in the algal community in September and February; however, the most likely reason for the changes is nutrients from point and nonpoint sources.
Site 4 was sampled for algal biomass and community composition once each month from September through February to assess changes in the algal community over time. The median chlorophyll-a value was 0.9 milligram per square meter, indicating that the algal biomass generally was low during the sampling period. The median value for the percentage of “most tolerant” species was 8 percent. This percentage remained fairly consistent and resembled the September and February results shown in figure 8.
|
|
||||
|
Macroinvertebrates can integrate water-quality conditions from several months to a year. The relative percentage of the macroinvertebrate groups indicates changes in the macroinvertebrate community in a downstream direction (fig. 9). Diversity of organisms commonly is used as an indicator of water-quality conditions. As diversity in a macroinvertebrate community decreases, water quality generally degrades. The Shannon-Weaver index is calculated on the basis of species and number of organisms. The Shannon-Weaver diversity index indicates a decrease in diversity when comparing site 1 to downstream sites (fig. 10). The percentage of Trichoptera (caddisflies) increased in a downstream direction, with maximum percentages at site 4. Site 4 also had the highest number of macroinvertebrates. The community at site 4 was dominated by one organism, the caddisfly Brachycentrus occidentalis. This caddisfly accounted for 73 and 55 percent of the entire macroinvertebrate community in September and February at site 4, respectively. Although these organisms prefer to filter feed from the water column, they are capable of grazing on benthic algae when limited drifting food resources are available (Gallepp, 1977). Grazing on algae by these organisms may be one factor for reduced algal biomass at site 4 (fig. 6); however, more data are needed to explain the anomaly at site 4.
|
|
The differences in the macroinvertebrate community at sites 4 and 5 between the sampling periods may reflect the larger increase in algal biomass at site 5 in February, compared to September. In February, the larger sized organisms (Trichoptera) were not as abundant at site 5. The smaller sized organisms, Diptera (midges), comprised a larger percentage of the macroinvertebrates at site 5 in February. The smaller sized organisms may require less food resources compared with the larger caddisflies found at site 5 during September.
| Low-flow conditions at site 4 in February. Photograph by Norm Spahr. |
Although changes occurred in the biological communities at sites located downstream, State standards for nutrients were not exceeded. The algae did not appear to be at nuisance levels during the sampling period. However, continued water-quality and stream-biota monitoring of the Eagle River will be important to assess the effects of continued population growth in Eagle County.
Bahls, L.L., 1992, Periphyton bioassessment methods for Montana streams: Helena, Mont., Department of Health and Environmental Sciences, Water Quality Bureau, 18 p., plus appendices.
Barbour, M.T., Gerritsen, J., Snyder, B.D., and Stribling, J.B., 1997, Revision to rapid bioassessment protocols for use in streams and rivers—Periphyton, benthic macroinvertebrates and fish: U.S. Environmental Protection Agency, Office of Water, Washington, D.C., EPA 841–D–97–002, variously paged.
Biggs, B.J.F., 1996, Patterns in benthic algae of streams, chap. 2, in Stevenson, R.J., Bothwell, M.L., and Lowe, R.L., eds., Algal ecology—Freshwater benthic ecosystems: San Diego, Academic Press, Harcourt Brace and Company, p. 31–56.
Britton, L.J., and Greeson, P.E., 1987, Methods for collection and analysis of aquatic biological and microbiological samples: Techniques of Water-Resources Investigations of the U.S. Geological Survey, book 5, chap. A4, 363 p.
Cuffney, T.F., Gurtz, M.E., and Meador, M.R., 1993, Methods for collecting benthic invertebrate samples as part of the National Water-Quality Assessment Program: U.S. Geological Survey Open-File Report 93–406, 66 p.
Gallepp, G.W., 1977, Responses of caddisfly larvae (Brachycentrus spp.) to temperature, food availability and current velocity: American Midland Naturalist, v. 98, p. 59–84.
Hem, J.D., 1992, Study and interpretation of the chemical characteristics of natural water: U.S. Geological Survey Water-Supply Paper 2254, 263 p.
Porter, S.D., Cuffney, T.F., Gurtz, M.E., and Meador, M.R., 1993, Methods for collecting algal samples as part of the National Water-Quality Assessment Program: U.S. Geological Survey Open-File Report 93–409, 39 p.
Shelton, L.R., 1994, Field guide for collecting and processing stream-water samples for the National Water-Quality Assessment Program: U.S. Geological Survey Open-File Report 94–455, 42 p.
Tweto, Ogden, Moench, R.H., and Reed, J.C., Jr., 1978, Geologic map of the Leadville 1° X 2° Quadrangle, northwestern Colorado: U.S. Geological Survey Miscellaneous Investigations Series Map I–999.
U.S. Bureau of the Census, 1970, 1990, 1970–1990 Census of population and housing: Washington D.C., data on CD-ROM.
Water Resources of Colorado
Contact: webmaster_co@usgs.gov
| AccessibilityFOIAPrivacyPolicies and Notices | |
 |
|