WRIR 99-4079: Estimates of Ground-Water Discharge as Determined from Measurements of Evapotranspiration, Ash Meadows Area, Nye County, Nevada
1-2. Maps showing for Ash Meadows area, Nevada:
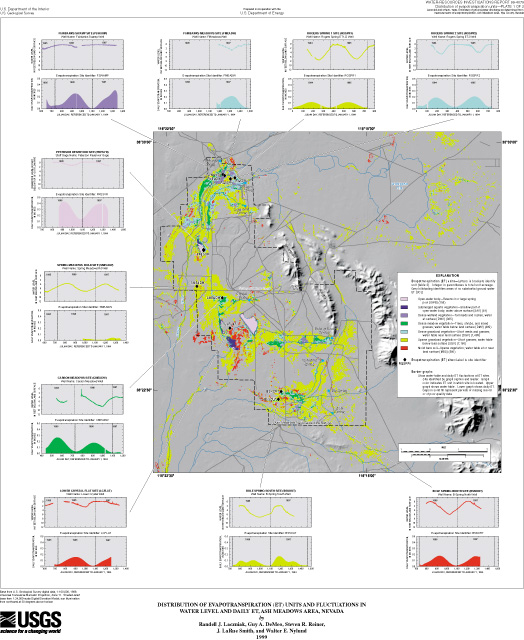
Plate 1. Distribution of evapotranspiration (ET) units and graphs of fluctuation in water level and daily ET
Plate 2. Location of shallow observation wells within evapotranspiration (ET) units and graphs of water-table fluctuation
| 1-3. | Maps showing for Ash Meadows, Nevada: | |
| 1. | Other major areas of natural discharge within Death Valley ground-water flow system potentially influencing ground-water flow at Nevada Test Site | |
| 2. | Generalized geology | |
| 3. | Major hydrographic and physiographic features | |
| 4. | Schematic of generalized cross section showing local hydrologic and geologic features controlling ground-water flow in Ash Meadows area, Nevada | |
| 5. | Map showing color infrared composite generated from June 13, 1992, thematic mapper image, Ash Meadows area, Nevada | |
| 6. | Graphs showing spectral-response curves for land covers of different vegetation and soil conditions | |
| 7. | Graphs showing spectral clusters and component spectral-response curves used in June and September 1992 image classifications for land covers of different vegetation and soil conditions equated with ground-water evapotranspiration in Ash Meadows area, Nevada | |
| 8. | Schematic of instrumentation arrangements installed and used to measure micrometeorological data to determine evapotranspiration over land and water from Ash Meadows area, Nevada | |
| 9. | Photographs showing typical instrument installations used to determine evapotranspiration over land and water from Ash Meadows area, Nevada | |
| 10-11. | Graphs showing for Carson Meadow ET site, September 1-5, 1996: | |
| 10. | Micrometeorological data collected | |
| 11. | Energy-budget fluxes and daily evapotranspiration calculated from meteorological data collected | |
| 12. | Graphs showing calculated daily evapotranspiration (ET) at Carson Meadow ET site for 1996 | |
| 13. | Graphs showing measured annual precipitation and calculated daily evapotranspiration in Ash Meadows area, Nevada | |
| 14-15. | Graphs showing daily changes in measured water level and in calculated evapotranspiration, March 30 to April 8, 1996 at: | |
| 14. | Fairbanks Swamp ET site | |
| 15. | Carson Meadow ET site | |
| 16. | Graphs showing annual precipitation measured in Ash Meadows and reported at long-term weather stations in general area, 1980-97 | |
| 17. | Graph of water-table fluctuations measured at ET sites, January 1, 1994, to February 8, 1998 | |
| 18. | Graphs showing annual water-level fluctuation in a deep and two shallow wells, May 5, 1994, to October 9, 1995 | |
| 19-22. | Graphs showing annual water-level fluctuation in selected deep and shallow wells: | |
| 19. | March 10, 1996, to July 22, 1997 | |
| 20. | April 10, 1994, to July 22, 1997 | |
| 21. | April 10, 1994, to July 22, 1997 | |
| 22. | April 10, 1994, to July 22, 1997 | |
| 23-24. | Graphs showing daily water-level fluctuation in selected deep and shallow wells: | |
| 23. | August 28 to September 26, 1995 | |
| 24. | September 7 to October 6, 1996 | |
| 25. | Graphs showing air pressure and daily water-level fluctuation in selected deep and shallow wells, January 15 to March 15, 1995 | |
1. Land covers represented by spectral clusters identified in June and September 1992 thematic mapper imagery of Ash Meadows area, Nevada
2. Pixel classification for combined June and September 1992 thematic mapper imagery
3. Evapotranspiration units determined from spectral-cluster combinations
4. Reclassification scheme used to assign evapotranspiration units from cluster combinations developed by combining June and September 1992 classifications5. Accuracy assessment of evapotranspiration-unit classification
6. Location and general description of sites equipped with micrometeorological instruments and used to determine evapotranspiration
7. Estimated annual evapotranspiration at ET sites
8. Summary of annual fluctuations in water levels measured in shallow water-table wells and at staff gage
9. Summary of annual fluctuations in water levels measured in selected existing wells
10. Acreage and mean annual evapotranspiration (ET) estimates for ET units and totals for Ash Meadows area
11. Estimates of mean annual ground-water discharge
12. Shallow wells installed and measured during study
13. Existing wells measured during study
|
Multiply
|
To obtain | |
| Length | ||
|
foot (ft)
|
0.3048 | meter |
|
inch (in.)
|
25.4 | Millimeter |
|
mile (mi)
|
1.609 | Kilometer |
| Area | ||
|
acre
|
0.4047 | square hectometer |
| Volume | ||
|
acre-foot (acre-ft)
|
0.001233 | cubic hectometer |
| Energy Flux | ||
|
watts per square feet (W/ft2)
|
0.0929 | watt per square meter |
| Pressure | ||
| pound per square inch (lb/in2) | 6.89476 | KiloPascal |
| Velocity or Rate | ||
|
foot per year (ft/yr)
|
0.3048 | meters per year |
|
foot per second (ft/s)
|
0.3048 | meters per second |
| Volumetric Rate | ||
|
acre-foot per year (acre-ft/yr)
|
0.001233 | cubic hectometer per year |
|
gallons per minute (gal/min)
|
0.0631 | liter per second |
Temperature: Degrees Fahrenheit can be converted to degrees Celsius by the formula °C = (°F - 32) x 0.556.
Sea level: Sea level refers to the National Geodetic Vertical Datum of 1929 (NGVD of 1929), which formerly has been called the "Sea-Level Datum of 1929." The Datum is derived from a general adjustment of the first-order leveling networks across the United States and Canada.
Note: English units are used throughout this report, except in instances where a measurement has no common English-unit equivalent.
| Ca | Specific heat of air at a constant pressure |
| Cs | Specific heat of dry soil |
| Cw | Specific heat of water |
| dbls | Depth below land surface at which heat flux is measured |
| dbws | Depth below water surface over which temperature is measured |
| de/dze | Vapor pressure gradient near the Earth's surface |
| DGV | Dense grassland vegetation |
| DMV | Dense meadow vegetation |
| dT/dzt | Temperature gradient near the Earth's surface |
| DWV | Dense wetland vegetation |
| E | Rate of water evaporation |
| e | Vapor pressure |
| Ea | Available energy |
| el,u | Vapor pressure at lower or upper reference point |
| ERP | Environmental Restoration Program |
| ET | Evapotranspiration |
| G | Subsurface heat flux |
| H | Sensible heat flux |
| HFs | Heat flux through soil at some measurement depth |
| kh | Turbulent transfer coefficient of heat in air |
| kv | Turbulent transfer coefficient of vapor |
| MBS | Moist bare soil |
| NTS | Nevada Test Site |
| OWB | Open-water body |
| P | Ambient air (barometric) pressure |
| RLi | Incoming long wave radiation |
| RLo | Outgoing long wave radiation |
| Rn | Net radiation |
| RSi | Incoming short wave radiation |
| RSo | Outgoing short wave radiation |
| SAV | Submerged aquatic vegetation |
| SGV | Sparse grassland vegetation |
| SPOT | Systeme Probatoire d'Observation de la Terre |
| T | Temperature |
| Tl,u | Temperature at lower or upper reference point |
| TM | Thematic mapper |
| USDOE | United States Department of Energy |
| USGS | United States Geological Survey |
| W | Gravimetric soil water content |
| ze | Height at which vapor pressure is measured |
| zt | Height at which temperature is measured |
| d Ts | Change in soil temperature between surface and soil heat flux measurement depth per unit time |
| d Tw | Change in water temperature per unit time |
| e | Ratio of molecular weight of water to dry air |
| gc | Psychrometric constant |
| l | Latent heat of vaporization for water |
| lE | Latent heat flux |
| ra | Density of air |
| rBs | Bulk density of soil |
| rw | Density of water |