|
WRIR 99-4079: Estimates of Ground-Water Discharge as Determined from Measurements of Evapotranspiration, Ash Meadows Area, Nye County, Nevada |
||
|
|
||
Like other desert areas, Ash Meadows receives little precipitation (fig. 13A). Much of the vegetation that thrives throughout Ash Meadows requires more water than is provided by local rainfall and must rely on local ground water for survival. The removal of ground water from the shallow valley-fill aquifer by local phreatophytes and through the evaporative process often is reflected by concurrent changes (fluctuations) in the water table. A network of wells from which to measure and document daily, seasonal, and annual fluctuations in the water table was established to gain greater insight into the ET process at Ash Meadows.
Water-table fluctuations were determined by making depth-to-water measurements in wells located throughout the Ash Meadows area during calendar years 1994 through 1997. Measurements were made on a periodic and, in selected wells, on a continual basis. Wells making up the network were distributed such that most vegetation types, soil moisture conditions, and general depth ranges were represented by at least one well. Well construction and location information is given in tables 12 and 13 in the "Supplemental Data" section at the end of the report.
Twenty-two shallow wells were installed at selected locations because few existed prior to the study. Coincident with the start of the study was an effort by the U.S. Fish and Wildlife Service to eradicate saltcedar within the refuge boundaries. As part of this effort, 12 shallow wells were installed in the area along the northern reach of Carson Slough (fig. 3)--an area overgrown by thick stands of saltcedar. The purpose of these wells was to measure and document any changes in the shallow water table that may result from the eradication effort. Measurements were made by personnel from the U.S. Fish and Wildlife Service and were provided to the U.S. Geological Survey during the period of study. Shallow wells installed during the study range in depth from 5.8 to 20 ft. Shallow-well locations are shown on plate 2.
Although the major focus of monitoring water levels was on the shallow water table, 28 wells having depths equal to or greater than 90 ft were measured periodically throughout the Ash Meadows area (table 13). These wells were constructed prior to the study and are referred to as existing wells. Depth-to-water measurements in these deeper wells provided information on water-level fluctuations in areas where the depth of the water table exceeded 25 ft and in deeper parts (more than 50 ft below the water table) of the ground-water flow system. Five existing wells having depths of less than 60 ft also were measured periodically. Depth measurements from these wells were used to document annual fluctuations in the water level in areas where the water table was relatively shallow (less than 25 ft) and where ground-water ET was considered insignificant (described as "UCL" or unclassified area in table 3). For brevity, shallow wells within unclassified areas are referred to as "unclassified shallow wells" throughout the remainder of the report.
Periodic measurements were made monthly in shallow wells from the date of installation through September 1997. On occasion, a monthly measurement could not be obtained due to difficulties in accessing the site. Periodic measurements also were made in other wells existing throughout the area prior to the study, but on a much less frequent basis. The frequency of measurements in these wells varied, but was sufficient to document annual fluctuations.
Continual measurements provided data from which to evaluate the response of the water table to daily changes in hydrologic stress, such as responses resulting from ET. Continual (hourly) measurements were made using down-hole pressure sensors. Sensors were installed in 10 shallow and 2 deep wells. Sensor installations were included at every ET site except at Fairbanks Meadow (FMEADW) and Peterson Reservoir (PRESVR). The data-collection period at each site differed in accordance with the well installation and the period of interest. A barometer installed at Devils Hole well was used to document local air (barometric) pressure changes.
The ET unit in which each well is located is given in tables 12 and 13. The distribution of shallow wells is such that at least one well is within each ET unit (table 3) with two exceptions. The exceptions are ET units OWB (open water body) and SAV (submerged aquatic vegetation). Although no well is in OWB, a staff gage installed as part of the open-water ET site at Peterson Reservoir (fig. 3, pl. 1) was read periodically to measure changes in the reservoir water-surface elevation. Only one shallow well, augered to depth of 8.25 ft, is in ET unit DWV (dense wetland vegetation). Eight shallow wells having depths ranging from 8.4 to 20 ft are in ET unit DMV (dense meadow vegetation). Seven shallow wells, ranging in depth from 5.8 to 20 ft, are in ET unit DGV (dense grassland vegetation). The largest ET unit, SGVA (sparse grassland vegetation), is represented by 15 wells that range in depth from 6.25 to 17.8 ft. Two wells, with depths of 12.0 and 13.2 ft, are in ET unit MBS (moist bare soil). Only one shallow well, located near Amargosa Flat, a dry playa a few miles northwest of Ash Meadows proper (fig. 3), is within the unclassified area (UCL, table 3).
Twelve deep wells are within classified ET units -- seven in SGV (sparse grassland vegetation); four in DGV (dense grassland vegetation); and one in DMV (dense meadow vegetation). All these wells are deeper than 90 ft. Considering their depth, any measured annual and daily water-level fluctuation is likely caused by some hydrologic stress other than local ET.
The shallow water table, as determined from depth-to-water measurements made in shallow wells throughout the Ash Meadows area, fluctuates on an annual and daily basis. Fluctuations are primarily a response to local ET and the magnitude and timing of the fluctuation differs with well depth, vegetation and soil conditions, climate, and distance from a surface-water source. Other factors of less significance affecting the shallow water table are changes in air (barometric) pressure and earth tides. Annual and daily fluctuations also were noted in the deeper wells and are attributed primarily to air-pressure and earth-tide responses.
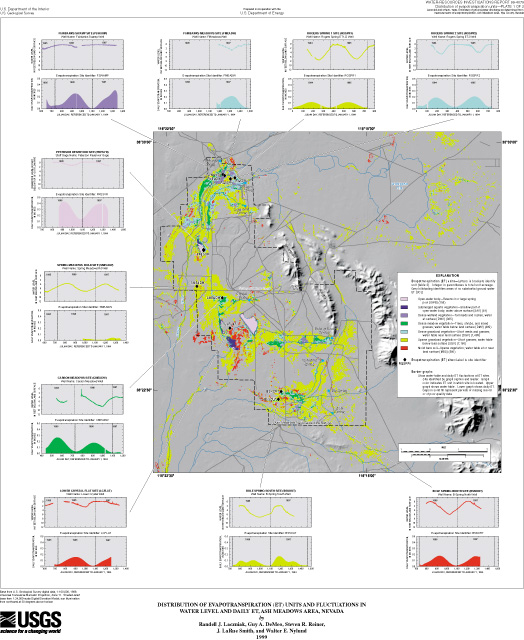
Annual fluctuations in water level measured in each of the shallow wells and in Peterson Reservoir are summarized by ET unit in table 8. The table gives the minimum and maximum depths to water, and the magnitude of the fluctuation measured at each site for each year of data collection. Annual fluctuations are based on hourly or periodic measurements (pls. 1 and 2). Maximum and minimum values determined from periodic measurements may not be indicative of the actual annual high and low in the water level because of the long periods between measurements (monthly or greater). Annual fluctuations, formulated from hourly (pressure-sensor) measurements taken at each instrumented ET site, are shown with calculated daily evapotranspiration on plate 1 and are shown by ET unit in figure 17 in the "Supplemental Data" section.
Depth-to-water measurements made in the shallow wells show a wide range in the annual fluctuation of the water table. Annual fluctuations ranged from 0.4 ft at the Fairbanks Swamp well in ET unit DWV to 10.2 ft at well CS-07 in ET unit DGV (table 8, pl. 2). The annual fluctuation varied not only between ET units, but also within some ET units. The measured within-unit variation ranged from 2.4 to 9.4 ft in DMV, from 2.4 to 10.2 ft in DGV, from 0.7 to 9.2 ft in SGV, and from 1.6 to 6.0 ft in MBS. Variations measured within these units are not unexpected considering that each unit includes areas of different vegetation, and of varying soil and moisture conditions. Variations within ET units OWB, SAV, and DWV could not be evaluated (an insufficient number of wells), but the range is expected to be small considering their fairly homogeneous makeup.
The largest measured water-table fluctuations are within ET units in "dryer" areas at locations most distant from a surface-water source (table 8). Annual fluctuations of nearly 10 ft were measured within ET units DMV and SGV. The smallest measured annual fluctuations are in ET units dominated by standing water (OWB and DWV) or at sites near a surface-water source providing a continuous supply of water throughout the year, even during periods of high ET (pl. 1).
Depth-to-water measurements also showed a wide range in their annual minimum and maximum depths. The annual minimum depth to water occurred in winter or early spring (table 8, fig. 17, pls. 1 and 2), whereas, the annual maximum occurred in late summer or fall. The annual minimum depth ranged from near land surface for wells in "wet" areas to 11.3 ft at well CS-08 in ET unit DGV (table 8). The annual maximum depth ranged from 0.7 ft at Fairbanks Swamp well in ET unit DWV to 16.8 ft at well CS-08. As was true of the annual water-table fluctuation, the annual minimum and maximum depth to water also varied among wells within the same ET unit. Generally, the greatest variation occurred in "dryer" and more densely vegetated ET units (DMV and DGV). The annual minimum and maximum depths measured within DMV ranged from 1.3 to 11.0 ft and from 4.8 to 16.3 ft, respectively, and within DGV ranged from near 0 to 11.3 ft and from 2.8 to 16.8 ft (table 8). The smallest minimum depths to water (shallowest water table) were measured in wells near perennial surface-water sources or in areas flooded during the cooler periods of the year. The largest maximum depths to water (deepest water table) were measured in the CS wells, all of which are in or near dense stands of saltcedar.
Annual fluctuations in the depth to water at a given ET site generally lag daily ET such that the annual maximum occurs shortly after daily ET reaches a maximum and the annual minimum shortly after ET reaches a minimum (pl. 1). This delay indicates that the fluctuation in the water table is largely a response to a change in ET rate. Somewhat contrary to this conclusion is the observation that the larger changes in water level occur at sites of low to moderate ET, and the smaller changes at sites of higher ET (pl. 1). This quandary is explained by the presence of a surface-water source near sites of higher ET. The nearby water source provides sufficient water to replace much of the water lost through local ET, thus helping maintain the level of the water table, and as well, the local vegetation.
Although a decline in the water table is a good indicator of ongoing local ET within an area (pl. 1), the magnitude of the annual decline is not necessarily indicative of the rate of ET. The annual decline of the water table depends on many factors--including the depth to the water table and the distance to a local surface-water source. Aquifer and soil properties, and soil-moisture conditions definitely influence the magnitude and timing of the response of the water table to local changes in ET.
Annual changes in water levels measured in 10 of the deep wells and 3 of the unclassified shallow wells existing prior to the study are summarized in table 9. The general differences between measured annual water-level fluctuations in deep and shallow wells are evident by comparing tables 8 and 9 and are illustrated in figures 18-22 in the "Supplemental Data" section. The annual fluctuations measured in deep wells generally are smaller and more subdued than those measured in shallow wells. The greatest differences occur between deep wells and shallow wells within an ET unit and distant from a surface-water source. For brevity, the remainder of the report refers to these shallow wells as "distant shallow wells." Annual fluctuations measured in wells where the water table is at a depth of more than 60 ft or where the well is open to a zone below the water table were less than 2 ft (table 9); whereas, those measured in distant shallow wells ranged from about 3 ft to more than 10 ft (table 8). The larger annual fluctuations noted in distant shallow wells (figs. 18-22) imply that the net loss of ground water by ET is greater in those areas where the water table is relatively shallow.
A comparison of the water levels measured in the distant and unclassified shallow wells (tables 8 and 9) shows less fluctuation at unclassified locations. The largest fluctuation at any unclassified location was 2.4 ft and was measured in the Mine Shaft well (table 9). This atypically large fluctuation is not likely a response to evapotranspiration from the shallow valley-fill aquifer, but instead to evaporation directly from the water surface exposed to the atmosphere through the large-diameter shaft opening. The smaller annual fluctuations measured in the unclassified area imply less local ET, and thus support the delineation as an area of minimal ET by the classification procedure.
The water table shows only a minimal response to measured changes in annual precipitation. Rainfall data collected from 1995 through 1997 indicate that only 2.4 inches of precipitation fell in 1996 as compared with 4.8 inches in 1995 and 4.0 inches in 1997 (fig. 13). Only two wells (Carson Meadows and Lower Crystal; pls. 1 and 2) show any significant correlation between annual changes in the water table and precipitation. The response in these wells to precipitation changes was a greater (deeper) maximum depth to water and larger annual fluctuation during the year of lesser precipitation. Although fluctuations measured in other shallow wells show little correlation to the measured changes in precipitation, any response may have been masked by other factors potentially affecting the water level, such as the saltcedar eradication or natural drainage restoration efforts by the U.S. Fish and Wildlife Service.
In general, water-level altitude increases with well depth (figs. 23-25 in "Supplemental Data" section). This increase in altitude indicates upward flow. Upward flow is consistent with the concept of flow from the underlying regional carbonate-rock aquifer moving diffusely upward into the overlying shallow valley-fill aquifer and supports the possibility of diffuse upflow being a source of some water lost through ET.
The water table as measured in shallow wells throughout the area also fluctuates on a daily basis. The shape, magnitude, and phase of the daily fluctuation varied between wells and over time, and are typified in figures 14 and 15 and also in figures 23-25. Reasons for observed differences in daily fluctuations are many and complex, but most likely are caused by differences in ET rate, depth to water, distance from a surface-water source, confinement of the aquifer system, or some combination thereof. The purpose of this report is not to explain or rationalize every difference but rather to evaluate daily fluctuations to help validate concepts of where and how much ET occurs in Ash Meadows.
Daily fluctuations measured in selected shallow wells are shown in figures 23 and 24 for a 30-day period and in figure 25 for a 60-day period. Plots comparing typical daily water-table fluctuations to daily changes in calculated ET over a 10-day period are shown in figures 14 and 15. Change in the daily fluctuation of water table in response to changes in daily ET over a year or more can be seen in plots shown on plate 1. Water levels measured in deeper wells also fluctuated on a daily basis, and their fluctuations are shown with shallow water-table changes in figures 23-25. Hourly air pressures measured at Devils Hole well for the same period are shown in figure 25.
Taken together, figures 14-15 and 23-25 and the plots on plate 1 provide some interesting insights into the evaporation process. In general, the magnitude of the daily fluctuation measured at ET sites decreases with depth and the larger fluctuations occur during periods of high ET when the water table is near the surface. The largest daily fluctuation, nearly 0.30 ft, was measured in the Fairbanks Swamp well at the FSWAMP ET site (fig. 23) during periods of maximum daily ET (pl. 1). Small daily fluctuations (less than 0.05 ft) were measured at nearly every site and were most conspicuous during periods of low ET when the water table was at its deepest annual level. Typical changes measured in the daily response show that the magnitude of the daily fluctuation generally decreased as the water table began declining in response to continuing or increasing ET, and that at greater depths, the phase in the daily fluctuation was shifted from that of the ET.
The daily fluctuation in the water table and ET measured at the Fairbanks Swamp (FSWAMP) and Carson Meadow (CMEADW) ET sites for a 10-day period in early spring are shown in figures 14 and 15, respectively. The long-term trend in the water level at the FMEADW ET site (fig. 14) is flat and the daily fluctuation is opposite and nearly in phase with that of the calculated ET. Whereas, at the CMEADW ET site (fig. 15), the observed long-term trend is downward, the magnitude of the daily fluctuation is much smaller, and the phase is shifted from that of ET. Differences in the magnitude and phase of the water-table curves are likely related, in part, to differences in the depth of the water table. At shallow depths, evaporation removes water directly from the surface of the water table, and transpiration from the zone directly below the water table penetrated by the root systems of the local vegetation. During deeper water-table periods, some water is lost from the partly saturated soil profile above the water table. The water removed from the partly saturated zone is replaced by water rising from the water table by capillary action (Gardner, 1958). The rate of capillary rise controls the movement of water from the water table into the soil profile and depends on many factors including atmospheric conditions, and soil properties and moisture conditions. Capillary rise is not the subject of this report, but does provide a likely explanation for the noted shift and attenuation of the daily fluctuation.
Daily fluctuations also were measured in the two "deeper" wells instrumented with pressure sensors (Devils Hole and Point of Rocks South wells, table 9). Shallow and deep well measurements for two different 30-day periods are shown in figures 23 and 24, and daily measurements for a 60-day period are shown in figure 25. The daily fluctuations measured within the two well groups differ substantially in their magnitude, character, and phase. The water-level fluctuations in the deeper wells are consistent with changes in air pressure (fig. 25) and with daily and higher frequency changes in areal strain induced by earth tides (Galloway, 1993; Galloway and others, 1994). Daily fluctuations, such as those noted in figures 23-25, are documented in other wells throughout the region tapping confined, partly confined, or thick water-table aquifers (Galloway and Rojstaczer, 1988). Fluctuations of this type are unlikely responses to daily ET, but rather are responses to water-level disturbances caused by changes in the aquifer system due to atmospheric loading and earth tides.
Short-term responses to precipitation also are evident in the water-table record of many shallow wells measured throughout the area (figs. 18 and 25). Short-term water table rises are coincident with precipitation but vary among wells in magnitude and duration. The magnitude and attenuation of the rise does not necessarily correlate to depth of the water table. Differences most certainly are related to the amount of precipitation falling at a site, but also are likely related to many other factors including differences in the local vegetation, soil properties, and moisture conditions.
Daily fluctuations in the water table can be a good indicator of ongoing ET, but as is true with the annual fluctuation, the magnitude is not necessarily a reliable gauge of the ET rate. Many factors other than ET rate influence the daily fluctuation in the water table. The fluctuation is governed by the rate of water flowing into and out of the shallow valley-fill aquifer. Factors having a noted effect include the depth of the water table, the existence of a nearby water source, and differences in aquifer and soil properties and local soil-moisture conditions. Although methods attempting to quantify ET on the basis of daily and annual water-level fluctuations were considered, none were attempted due to uncertainties in some of the controlling factors and to the complexity involved in the integration of these factors. Any attempt to calculate ET on the basis of water-level decline would require a better understanding of all the inflow and outflow components contributing to the local water budget and additional knowledge of the hydrologic and physical properties of the soil and aquifer system that govern the movement and storage of water at the site.
|
|