
1U.S. Geological Survey
2Kansas Geological Survey
3Colorado Department of Agriculture
Water Movement Through the Unsaturated Zone
Figure 1. Location of the High Plains aquifer and the unsaturated-zone and ...
Figure 2. Lithology of unsaturated-zone sediment, locations of monitoring d...
Figure 3. Location of irrigated land in the central High Plains. Locations ...
Figure 4. Locations of CAL–121 and CAL–122 in areas of intensive irrigation...
Figure 5. Long-term hydrographs for irrigation wells located within 1.6 kil...
Figure 6. Hydrographs for the monitoring wells at CNG, CAL–121, and CAL–122...
Figure 7. Photographs showing the (A) drilling operation, (B) collection of...
Figure 8. Photograph showing unsaturated-zone monitoring equipment being pr...
Figure 9. Matric potentials measured using heat-dissipation probes at depth...
Figure 10. Total water potential as a function of depth below land surface ...
Figure 11. Relation between depth and (A) lithology, (B) tritium concentrat...
Figure 12. Relation between depth and (A) lithology, (B) tritium concentrat...
Figure 13. Relation between depth and (A) lithology, (B) tritium concentrat...
Figure 14. Relation between depth and (A) chloride concentrations and water...
Figure 15. Relation between depth and pesticide concentrations in core, soi...
Table 1. History of agronomic practices at CAL–121 and CAL–122, Finney Coun...
Table 2. Physical properties of sediment cores. (Matric potentials were mea...
Table 3. Gravimetric water content, bulk density, and volumetric water cont...
Table 4. Gravimetric water content and chloride concentrations in sediment ...
The U.S. Geological Survey (USGS) is committed to serve the Nation with accurate and timely scientific information that helps enhance and protect the overall quality of life, and facilitates effective management of water, biological, energy, and mineral resources. (http://www.usgs.gov/). Information on the quality of the Nation's water resources is of critical interest to the USGS because it is so integrally linked to the long-term availability of water that is clean and safe for drinking and recreation and that is suitable for industry, irrigation, and habitat for fish and wildlife. Escalating population growth and increasing demands for the multiple water uses make water availability, now measured in terms of quantity and quality, even more critical to the long-term sustainability of our communities and ecosystems.
The USGS implemented the National Water-Quality Assessment (NAWQA) Program to support national, regional, and local information needs and decisions related to water-quality management and policy. (http://water.usgs.gov/nawqa/). Shaped by and coordinated with ongoing efforts of other Federal, State, and local agencies, the NAWQA Program is designed to answer: What is the condition of our Nation's streams and ground water? How are the conditions changing over time? How do natural features and human activities affect the quality of streams and ground water, and where are those effects most pronounced? By combining information on water chemistry, physical characteristics, stream habitat, and aquatic life, the NAWQA Program aims to provide science-based insights for current and emerging water issues and priorities. NAWQA results can contribute to informed decisions that result in practical and effective water-resource management and strategies that protect and restore water quality.
Since 1991, the NAWQA Program has implemented interdisciplinary assessments in more than 50 of the Nation's most important river basins and aquifers, referred to as Study Units. (http://water.usgs.gov/nawqa/nawqamap.html). Collectively, these Study Units account for more than 60 percent of the overall water use and population served by public water supply, and are representative of the Nation's major hydrologic landscapes, priority ecological resources, and agricultural, urban, and natural sources of contamination.
Each assessment is guided by a nationally consistent study design and methods of sampling and analysis. The assessments thereby build local knowledge about water-quality issues and trends in a particular stream or aquifer while providing an understanding of how and why water quality varies regionally and nationally. The consistent, multi-scale approach helps to determine if certain types of water-quality issues are isolated or pervasive, and allows direct comparisons of how human activities and natural processes affect water quality and ecological health in the Nation's diverse geographic and environmental settings. Comprehensive assessments on pesticides, nutrients, volatile organic compounds, trace metals, and aquatic ecology are developed at the national scale through comparative analysis of the Study-Unit findings. (http://water.usgs.gov/nawqa/natsyn.html).
The USGS places high value on the communication and dissemination of credible, timely, and relevant science so that the most recent and available knowledge about water resources can be applied in management and policy decisions. We hope this NAWQA publication will provide you the needed insights and information to meet your needs, and thereby foster increased awareness and involvement in the protection and restoration of our Nation's waters.
The NAWQA Program recognizes that a national assessment by a single program cannot address all water-resource issues of interest. External coordination at all levels is critical for a fully integrated understanding of watersheds and for cost-effective management, regulation, and conservation of our Nation's water resources. The Program, therefore, depends extensively on the advice, cooperation, and information from other Federal, State, interstate, Tribal, and local agencies, non-government organizations, industry, academia, and other stakeholder groups. The assistance and suggestions of all are greatly appreciated.
Robert M. HirschAssociate Director for Water
| φp | porosity |
| ρb | bulk density |
| ρp | particle density |
| θ | volumetric moisture content |
| Ψ | matric potential |
| Θ | effective saturation |
| °C | degrees Celsius |
| ASTM | American Society for Testing and Materials |
| AT | advanced tensiometer |
| cm | centimeters |
| cm3 | cubic centimeters |
| g | grams |
| g/cm3 | grams per cubic centimeter |
| g/m2/yr | grams per square meter per year |
| g/m3 | grams per cubic meter |
| HDP | heat-dissipation probe |
| HRL | Hydrologic Research Laboratory |
| kg | kilograms |
| km | kilometers |
| km2 | square kilometers |
| Ksat | saturated hydraulic conductivity |
| K(θ) | unsaturated hydraulic conductivity |
| K(θ)eff | effective unsaturated hydraulic conductivity |
| L | liter |
| m | meter |
| m3 | cubic meters |
| MCL | maximum contaminant level |
| mg/L | milligrams per liter |
| mg/L as N | milligrams per liter as nitrogen |
| mg/L as P | milligrams per liter as phosphorus |
| mL | milliliters |
| mm | millimeters |
| mm/yr | millimeters per year |
| NAWQA | National Water-Quality Assessment |
| ng/g | nanograms per gram |
| PVC | polyvinyl chloride |
| q | water flux |
| QC | blank quality control |
| TU | tritium units |
| USGS | U.S. Geological Survey |
| µg/g | micrograms per gram |
| µg/L | micrograms per liter |
| µL | microliters |
| µm | micrometers |
Horizontal coordinate information is referenced to the North American Datum of 1983 (NAD 83).
The role of irrigation as a driving force for water and chemical movement to the central High Plains aquifer is uncertain because of the thick unsaturated zone overlying the aquifer. Water potentials and profiles of tritium, chloride, nitrate, and pesticide concentrations were used to evaluate water movement through thick unsaturated zones overlying the central High Plains aquifer at three sites in southwestern Kansas. One site was located in rangeland and two sites were located in areas dominated by irrigated agriculture. In 2000–2001, the depth to water at the rangeland site was 50 meters and the depth to water at the irrigated sites was about 45.4 meters. Irrigation at the study sites began in 1955–56.
Measurements of matric potential and volumetric water content indicate wetter conditions existed in the deep unsaturated zone at the irrigated sites than at the rangeland site. Total water potentials in the unsaturated zone at the irrigated sites systematically decreased with depth to the water table, indicating a potential existed for downward water movement from the unsaturated zone to the water table at those sites. At the rangeland site, total water potentials in the deep unsaturated zone indicate small or no potential existed for downward water movement to the water table.
Postbomb tritium was not detected below a depth of 1.9 meters in the unsaturated zone or in ground water at the rangeland site. In contrast, postbomb tritium was detected throughout most of the unsaturated zone and in ground water at both irrigated sites. These results indicate post-1953 water moved deeper in the unsaturated zone at the irrigated sites than at the rangeland site. The depth of the interface between prebomb and postbomb tritium and a tritium mass-balance method were used to estimate water fluxes in the unsaturated zone at each site. The average water fluxes at the rangeland site were 5.4 and 4.4 millimeters per year for the two methods, which are similar to the average water flux (5.1 millimeters per year) estimated using a chloride mass-balance method. Tritium profiles in the unsaturated zone at the irrigated sites were complicated by the presence of tritium-depleted intervals separating upper and lower zones containing postbomb tritium. If the interface between prebomb and postbomb tritium was at the top of the tritium-depleted interval and postbomb tritium detected beneath that interval was from the declining water table in the area, then the average water flux at the irrigated sites was estimated to be 21 to 54 millimeters per year. If postbomb tritium detected beneath the tritium-depleted interval was from bypass or preferential water movement through the local unsaturated zone instead of the declining water table, then the minimum water flux at the irrigated sites was estimated to be 106 to 116 millimeters per year. In either case, water fluxes at the irrigated sites were at least 4 to 12 times larger than the flux at the rangeland site, indicating irrigation was an important driving force for water movement through the unsaturated zone.
The presence of postbomb tritium and large nitrate and total pesticide concentrations (24 milligrams per liter as nitrogen and 0.923 microgram per liter, respectively) in ground water at the irrigated sites indicates irrigation water also was an important driving force for chemical movement to the water table. The persistence of a downward hydraulic gradient from the deep unsaturated zone to the water table at the irrigated sites, in addition to large nitrate and atrazine concentrations in deep soil water (34 milligrams per liter as nitrogen and 0.79 microgram per liter, respectively), indicate that the deep unsaturated zone will be a source of nitrate and atrazine to the aquifer in the future.
The High Plains aquifer is a nationally important water resource that underlies about 450,700 km2 in parts of eight States (fig. 1). The aquifer supplies drinking water to 82 percent of the people who live within the aquifer boundary and about 30 percent of the ground water used for irrigation in the United States (Dennehy, 2000). McGuire and Sharpe (1997) reported that of the 20.4 billion m3 of water pumped from the High Plains aquifer in 1990, 19.4 billion m3, or about 95 percent, was used for irrigation. Several water-quality studies have reported on the presence of agricultural chemicals in the unsaturated zone and at the water table in irrigated areas with shallow (less than 15 m) depths to ground water (Spalding and Kitchen, 1988; Komor and Emerson, 1994; Townsend and others, 1996; Spalding and others, 2001; Costa and others, 2002). These findings indicate irrigation water was the driving force for transporting agricultural chemicals through the unsaturated zone to the water table in those shallow environments. It is likely that irrigation water plays a similar role in the High Plains because of its long-term use in the area. In some areas of the central High Plains, which is the focus of this study, irrigation began in the late 1950's. Historical water-quality data indicate agricultural chemicals are found in the central High Plains aquifer (Litke, 2001); however, the unsaturated zone overlying the central High Plains aquifer is relatively thick so the relation between land use and water quality in the aquifer is not always clear. In 2000, the average thickness of the unsaturated zone in the central High Plains was 43.3 m. Recent studies have reported the presence of agricultural chemicals at the water table under some irrigated fields in the central High Plains (McMahon, 2000, 2001). Although these results imply agricultural chemicals were transported through the thick unsaturated zone in these irrigated areas, water and chemical movement in these settings have not been systematically evaluated.

This report evaluates water movement through thick unsaturated zones in areas of southwestern Kansas where rangeland and irrigated agriculture were the dominant land uses. Comparisons of hydraulic and chemical data collected from three study sites (fig. 1) provide insights into the processes and rates of water movement in the thick unsaturated zone overlying the central High Plains aquifer. Ongoing studies in Colorado, Nebraska, and Texas will provide similar information on water movement in the unsaturated zones in the southern and northern portions of the High Plains aquifer.
The three study sites are within the boundaries of the central High Plains aquifer in southwestern Kansas (fig. 1). Details on the climate, topography, geology, and hydrology of the central High Plains region are in Weeks and others (1988), Dennehy (2000), and Dennehy and others (2002). Details on the climate, topography, geology, and hydrology of the unsaturated-zone study sites are presented in this section. One site (CNG) is located in Morton County, in the Cimarron National Grassland, and two sites (CAL–121 and CAL–122) are located in Finney County, within about 8 km of each other (fig. 1). Morton and Finney Counties have semiarid continental climates with frequent winds, low humidity, and high rates of evaporation. The average (1900–2000) air temperatures during the winter, spring, summer, and fall in Elkhart, Kans., about 29 km west of CNG, were 1.8, 12.3, 24.7, and 13.8 °C, respectively. The average (1900–2000) annual precipitation in Elkhart was 453 mm, with 56 percent of the precipitation occurring during May through August. The average (1948–2000) air temperatures during the winter, spring, summer, and fall in Garden City, Kans., about 23 km north of the CAL sites, were –0.6, 11.0, 24.1, and 12.3 °C, respectively (High Plains Regional Climate Center, 2001). The average (1948–2000) annual precipitation in Garden City was 487 mm, with 62 percent of the precipitation occurring during May through August. Pan evaporation in southwestern Kansas ranged from about 2,290 to 2,410 mm/yr (Weeks and others, 1988).
Topography at CNG is undulating, with slopes less than 1 percent. The site is in the Vona-Tivoli soil association, which is composed of loamy, fine sand (Dickey and others, 1963). Vegetation at CNG is sparse and consists of sagebrush, yucca, and short grasses. Topography at the CAL sites is characterized by gently sloping (less than 1 percent) plains. These sites are within the Manter-Keith soil association, which is composed of sandy and loamy soils (Harner and others, 1965). Vegetation at the CAL sites is discussed below. In 2000, the thickness of the unsaturated zone at CNG was about 50.0 m, and at the CAL sites it was about 45.4 m. The lithology of sediment in the unsaturated zone at each site is shown in figure 2. Unsaturated-zone sediment at all of the sites consists primarily of sand; however, intervals of clay, silt, and gravel were present at several depths at each site. The most significant clay layer, a brown silty clay grading into a plastic blue clay, was below the water table at CAL–122. The top of the layer was about 45.7 m below land surface and extended to at least 67.1 m (drilling was terminated before reaching the lower boundary of the clay).

The unsaturated-zone monitoring sites are underlain by the central High Plains aquifer. The Ogallala Formation is the largest geologic unit of the aquifer in the study area (Smith, 1940; Gutentag and others, 1984). The Ogallala Formation consists primarily of unconsolidated clay, silt, sand, and gravel with scattered cemented zones consisting of calcium carbonate. Younger sedimentary deposits that comprise a lesser proportion of the aquifer in the study areas include alluvial and windblown deposits of Quaternary age. The contact between the Ogallala Formation and younger deposits was not mapped at the study sites, and it is possible that all or a portion of the unsaturated zone at the study sites consists of sediments of Quaternary age (Olson and others, 1997).
Large-scale development of the central High Plains aquifer for irrigation began in the 1950's (Luckey and others, 1986); since that time, water levels in some areas of the aquifer have declined more than 30 m (McGuire and Sharpe, 1997). The CAL sites are in one of the most intensively irrigated areas in the central High Plains (figs. 3 and 4). On the basis of long-term water-level measurements made in irrigation wells located within 1.6 km of the CAL sites, water levels at CAL–121 declined by about 18.3 m from 1962 to 1999 and water levels at CAL–122 declined by about 27.4 m from 1961 to 1999 (fig. 5). The area within a 1-km radius of CNG was never irrigated and has been part of the Cimarron National Grassland since the 1930's. An irrigation well located about 1.6 km west of the CNG site had a 2.1-m net decline in water level from 1984 to 1999. Water levels measured in the water-table monitoring wells installed at each site fluctuated less than 0.3 m during the 2000–2001 measurement period (fig. 6). Sophocleous and others (2002) discussed possible reasons why the water-level hydrographs in the monitoring wells were essentially flat during the period of measurement.


Figure 6. Hydrographs for the monitoring wells at CNG, CAL–121, and CAL–122.
Water was applied by furrow irrigation directly over the CAL–121 borehole location from 1956 to 1989. In 1990, the irrigation practice in that quarter section was changed to center-pivot sprinkler irrigation. After the change to center-pivot irrigation in 1990, the CAL–121 borehole location was 75 m from the edge of the irrigated field and no longer received applications of irrigation water. The irrigation history at CAL–122 is similar to that at CAL–121 except that furrow irrigation began in 1955. Corn is the primary irrigated crop at both sites. Vegetation at the CAL boreholes consisted of nonirrigated wheat and sorghum from 1990 to 1999 and annual grasses in 2000. Nitrogen fertilizer has been applied to the irrigated fields since about 1956. Atrazine has been applied to the irrigated fields since about 1960. Specific histories of agronomic practices at both CAL sites are presented in table 1.
Table 1. History of agronomic practices at CAL–121 and CAL–122, Finney County, Kansas.
| Agronomic history | CAL–121 | CAL–122 |
|---|---|---|
| Year field was first cultivated | approximately 1900 | approximately 1915 |
| Year field was first irrigated | 1956 | 1955 |
| Primary crop before irrigation | wheat/fallow | wheat/fallow |
| Primary crop during irrigation | corn | corn |
| Irrigation method | furrow irrigation, 1956–89; sprinkler irrigation 1990–2001 | furrow irrigation, 1955–89; sprinkler irrigation, 1990–2001 |
| Year nitrogen applications began | 1956 | 1955 |
| Year atrazine applications began | 1960 | 1958 |
The purpose of this report is to describe the results of a study that evaluated water movement through thick unsaturated zones overlying the central High Plains aquifer in southwestern Kansas. In 2000, boreholes were drilled at one site in Morton County, Kans., at which rangeland was the dominant land use, and at two sites in Finney County, Kans., at which irrigated agriculture was the dominant land use. Sediment cuttings and cores were collected during drilling for the analysis of physical properties (particle size, bulk density, porosity, gravimetric and volumetric water contents, and matric potentials) and chemical concentrations (tritium, chloride, nitrate, and six pesticides and two pesticide degradates). The boreholes were instrumented with monitoring wells and pressure transducers to measure ground-water elevations, advanced tensiometers (AT's) and heat-dissipation probes (HDP's) to measure soil-water matric potentials, suction lysimeters were installed in the unsaturated zone to collect soil-water samples, and ground-water samples were collected from the monitoring wells. Soil water collected in 2000–2001 was analyzed for chloride, nitrate, and atrazine. Ground water collected in 2000–2001 was analyzed for tritium, chloride, nitrate, and 47 pesticides and pesticide degradates.
This study was part of the U.S. Geological Survey (USGS) National Water-Quality Assessment (NAWQA) Program, High Plains Regional Ground-Water Study. The authors thank the Kansas Geological Survey for providing M.A. Sophocleous to assist us during this study, and the Colorado Department of Agriculture for providing pesticide analyses of sediment core samples. The cooperation of the private landowner who agreed to the installation and long-term operation of monitoring equipment on his land and who provided detailed historical information on the agronomic practices used at those sites is gratefully acknowledged. The U.S. Forest Service granted permission to install and maintain a monitoring facility in the Cimarron National Grassland. The authors would like to recognize John Izbicki, USGS, for his guidance during the planning and design of this study. Geoffrey Delin (U.S. Geological Survey, Minnesota), John Izbicki (U.S. Geological Survey, California), and Bridget Scanlon (Texas Bureau of Economic Geology) provided colleague reviews of this report.
The following section of the report describes the methods used to drill boreholes and collect sediment samples, analyze sediment for physical properties and chemistry, instrument the boreholes, measure water levels, measure matric potentials, collect ground-water and soil-water samples, and analyze the chemistry of soil water and ground water.
Each borehole was drilled using the under-reamer method known as the ODEX air-hammer drilling method (Driscoll, 1986; Hammermeister and others, 1986; Izbicki and others, 2000) (fig. 7A). The boreholes were drilled during March and April 2000. The ODEX method uses a downhole percussion hammer to drill and ream at the bottom of a casing. A pilot bit, in conjunction with an eccentric reamer, drills a hole slightly larger than the outside diameter of the casing. The percussion hammer also impacts on the casing through a shoe attached to the bottom joint of the casing. Thus, the casing is advanced downward as the hole is drilled deeper. Steel casing with an inside diameter of 20 cm was used in this study.

Sediment cuttings from each borehole were collected by advancing the drill bit in 30-cm increments from land surface to the water table and removing the cuttings between drilled intervals using compressed air (fig. 7B). Comparison of chemical-concentration data from cuttings and core collected over the same intervals indicated the cuttings were representative of the drilled interval. Cuttings were used to analyze physical and chemical properties of the sediment. Core samples (10 cm in diameter by 60 cm long) were collected continuously from land surface to a depth of 3.1 m using a piston core barrel and at incrementally larger spacings between cores below a depth of 3.1 m. The core barrel was lined with four aluminum core liners, each about 15 cm long. For each 60-cm core run, one 15-cm-long section was used for physical-parameter analysis, one section was used for tritium analysis, one section was used for the analysis of chloride, nitrate, and pesticides, and one section was held in reserve for future analyses. Except for the section used for chloride, nitrate, and pesticide analyses, each core section was capped, labeled, wrapped in plastic, and sealed in individual aluminum pouches immediately after being removed from the core barrel following the procedures of Hammermeister and others (1986) and Izbicki and others (2000) to protect the core from evaporation and contamination (figs. 7C and 7D). The section of core used for chemical analysis was subsampled for pesticide analyses in the field before sealing the core according to the procedure previously described. For pesticide analysis, approximately 500 g of sediment was removed from the liner using a stainless-steel spatula that had been cleaned in a detergent solution and rinsed with deionized water and methanol. The 500-g sample was placed in a precleaned amber glass jar, sealed with a Teflon-lined cap, and kept chilled until analyzed.
Characterization of the physical properties of the sediment was accomplished through a variety of field and laboratory analyses. Textural analysis of drill cuttings was done at the USGS Colorado District laboratory to determine the general stratigraphy of the sites and to select core samples representing the full range of geologic units contacted throughout the unsaturated zone for additional measurements at the USGS Hydrologic Research Laboratory (HRL) in Sacramento, Calif. Fifteen core samples were analyzed by the HRL. Analyses performed at the HRL included particle-size analysis, bulk density, porosity, gravimetric and volumetric water content, percent saturation, and matric potential. All analyses were performed in accordance with standards developed by the American Society for Testing and Materials (ASTM) or other approved technical procedures.
Particle-size analysis of the core at the HRL was done through a combination of sieve and hydrometer analyses. Determination of gravel- and sand-sized fractions on a mass basis was accomplished through sieve analysis in accordance with ASTM procedure C136 (American Society for Testing and Materials, 1997). Hydrometer analysis for determination of silt- and clay-sized fractions was done according to the HRL procedure HP–263. Classification of textural size fractions was in accordance with the U.S. Department of Agriculture system (Tindall and Kunkel, 1999). In this system, sand-sized particles range from 0.05 to 2.00 mm, silt-sized particles range from 0.002 to 0.05 mm, and clay-sized particles are smaller than 0.002 mm. All particles larger than 2.00 mm in diameter are considered gravel-sized particles.
Textural analysis of the cuttings at the USGS Colorado District laboratory was done through a combination of sieve and hydrometer analyses. Determination of gravel fractions (larger than 2.00 mm) on a mass basis was accomplished through sieve analysis in accordance with ASTM procedure C136. Hydrometer analysis for determination of sand, silt, and clay-sized fractions was done in accordance with the method described by Gee and Bauder (1986).
Physical properties of the core samples were determined according to the HRL procedure HP–229. Bulk density (ρb, in grams per cubic centimeter) was measured in the following way: a sample of known volume was ovendried at 105 °C and the dried sample was weighed. To measure porosity (φp, in cubic centimeters per cubic centimeter), the cores were fully saturating under a vacuum and the volume of pore space was calculated as the difference in mass between the saturated and ovendried sample (mass = volume because the density of water = 1.0 g/cm3). This direct measurement is considered preferable to calculating porosity from the equation φp = 1 – (ρb/ρp) because particle density (ρp) was not measured. Gravimetric (g/g) and volumetric (θ, in cubic centimeters per cubic centimeter) water contents were measured as the difference between the initial (field) sample weight and the oven-dry weight. Percent saturation (%) was calculated as the ratio of the water-filled pore space (θ) to the total porosity of the sample. The accuracy of these measurements was dependent upon the precision of the balances used for weighing the samples (±0.01 g) as well as sample storage (preservation of field moisture conditions) and sample handling (loss of sample throughout measurement process). Calibration of all measurement devices to National Institute of Standards and Technology traceable standards and a documented Quality Assurance program at the HRL ensured minimal error in the measurements.
A matric potential was measured in one core from each site to supplement matric-potential measurements made in the field. The measurements were accomplished by installing tensiometers and HDP's in the laboratory. The tensiometer method provided a direct measurement of soil suction, and the HDP method used the thermal properties of a calibrated sensor for indirect measurement of the soil matric potential (Phene and others, 1971). In accordance with the HRL procedure, a microtensiometer and a calibrated HDP (Campbell Scientific Inc., model 229) were inserted into the center of the core. HDP's were saturated before installation, and measurements were collected on a 4-hour interval by use of an automated data-logging system. Due to capillary forces, water from the saturated ceramic of the HDP, as well as the sealed reservoir of the tensiometer, drained into the soil matrix until equilibrium was reached. The accuracy of the tensiometer measurement depended on the sensor used to measure pressure in the reservoir (2 millibars in this case). The accuracy of the HDP matric-potential measurement depended on the porous ceramic material from which the sensor is constructed and the method of calibration. Campbell and Gee (1986) reported an accuracy of 0.1 bar or better in the range of matric potentials measured on these cores. In this study, matric potentials are reported in centimeters (1 bar = 1,021 cm). Results of the laboratory analysis of physical properties are given in table 2.
[m, meters; g/cm3, grams per cubic centimeter; cm3/cm3, cubic centimeters per cubic centimeter; g/g, grams per gram; –cm, negative centimeters; --, not measured or not at equilibrium; *, measured in laboratory]| Sample identification | Depth below land surface (m) | Bulk density (g/cm3) | Porosity (cm3/cm3) | Gravimetric water content (g/g) | Volumetric water content (cm3/cm3) | Saturation (percent) | Matric potential (–cm) | Gravel (percent) | Sand (percent) | Silt (percent) | Clay (percent) |
|---|---|---|---|---|---|---|---|---|---|---|---|
| CNG 26–26.5 | 7.9 | 1.67 | 0.390 | 0.025 | 0.041 | 11 | -- | 0 | 94 | 1 | 5 |
| CNG 37.5–38 | 11.4 | 1.69 | .384 | .099 | .167 | 43 | -- | 2 | 60 | 22 | 16 |
| CNG 77.5–78 | 23.6 | 1.99 | .237 | .087 | .173 | 73 | 1,583 to 1,788 | 7 | 59 | 18 | 16 |
| CNG 136–136.5 | 41.5 | 1.72 | .381 | .041 | .071 | 19 | 725 | 0 | 89 | 5 | 6 |
| CNG 157.5–158 | 48.0 | 1.56 | .430 | .249 | .387 | 90 | 633* | 0 | 35 | 39 | 26 |
| CAL–121 21–21.5 | 6.4 | 1.60 | .401 | .054 | .085 | 21 | -- | 5 | 74 | 12 | 9 |
| CAL–121 46–46.5 | 14.0 | 1.71 | .413 | .143 | .243 | 59 | -- | 0 | 43 | 46 | 11 |
| CAL–121 66–66.5 | 20.1 | 1.88 | .310 | .037 | .070 | 23 | 235 | 25 | 69 | 3 | 3 |
| CAL–121 86–86.5 | 26.2 | 2.04 | .258 | .028 | .058 | 22 | 286* | 34 | 62 | 3 | 1 |
| CAL–121 116–116.5 | 35.4 | 1.83 | .334 | .044 | .081 | 24 | 255 | 9 | 87 | 2 | 2 |
| CAL–122 32.5–33 | 9.9 | 1.81 | .332 | .065 | .118 | 36 | 654 | 3 | 83 | 6 | 8 |
| CAL–122 46–46.5 | 14.0 | 1.96 | .261 | .016 | .031 | 12 | -- | 46 | 52 | 1 | 1 |
| CAL–122 77.5–78 | 23.6 | 1.76 | .345 | .022 | .038 | 11 | -- | 11 | 87 | 0 | 2 |
| CAL–122 97.5–98 | 29.7 | 1.70 | .392 | .205 | .348 | 89 | 153* | 0 | 22 | 47 | 31 |
| CAL–122 116–116.5 | 35.4 | 1.89 | .270 | .048 | .090 | 33 | 225 to 286 | 30 | 64 | 2 | 4 |
Sediment samples were analyzed for tritium, inorganic anions, and pesticides and pesticide degradates to assess the movement of water and chemicals in the unsaturated zone at the CNG and CAL sites.
Tritium. Tritium was measured in water extracted from about 1 kg of core material by vacuum distillation at 80 °C and analyzed by liquid scintillation with electrolytic enrichment at the USGS Tritium Laboratory in Menlo Park, Calif. (Thatcher and others, 1977). The 1-sigma precision of the analyses ranged from 0.3 to 2.8 tritium units (TU) and was better for moist cores than for dry cores.
Inorganic anions. Sediment cuttings were analyzed for their bromide, chloride, nitrite, nitrate, orthophosphate, and sulfate contents. Only the chloride and nitrate data are presented in this report. These inorganic anions were extracted from sediment using the method described by Lindau and Spalding (1984) and Herbel and Spalding (1993), with slight modification. Briefly, cuttings were ovendried at 50 °C for 24 hours, and 10 g of the dried sediment was combined with 100 mL of deionized distilled water. The sediment/water mixture was hand stirred for 1 minute and then placed on an orbital shaker for 1 hour at 170 revolutions per minute. After shaking, the sediment/water mixture was centrifuged for 10 minutes, and then the liquid layer was separated and filtered through a 0.45-µm filter. Anion concentrations in the filtered solution were quantified using ion chromatography with conductivity detection. Anion concentrations were initially reported on a dry-weight basis (micrograms per gram dry sediment) and converted to a volume basis (milligrams per liter water) using the gravimetric water content of the sediment.
A method blank was run after every sixth environmental sample by subjecting distilled deionized water to the extraction process to verify that the process did not contaminate samples. Analyses of method blanks indicated the extraction procedure was not a substantial source of dissolved inorganic anions. A replicate sample was run after every fifth environmental sample to assess the effects of field and laboratory procedures on measurement variability. The median percent difference in chloride concentrations in 38 pairs of replicate samples was 5 percent. The median percent difference in nitrate concentrations in 38 pairs of replicate samples was 1.5 percent. Detection limits for chloride and nitrate were about 0.8 µg/g and 0.2 µg of nitrogen/g, respectively.
Pesticides and pesticide degradates. Sediments were analyzed for atrazine and two of its degradates, deisopropylatrazine and deethylatrazine, along with prometon, alachlor, metolachlor, simazine, and cyanazine at the Colorado Department of Agriculture Ground-Water Laboratory in Denver, Colo. Three types of sediment samples were analyzed: environmental, blank quality control (QC), and fortified QC samples. For environmental samples, 100 g of sediment was weighed into a 250-mL screw-top Nalgene bottle, a 50-µL aliquot of surrogate (bromacil) solution was added, and the sample was mixed and allowed to sit for 15 minutes before being extracted. For blank QC samples, 100 g of sediment that did not contain any of the target analytes was weighed into a 250-mL screw-top Nalgene bottle. A 50-µL aliquot of the surrogate solution was added, and the sample was mixed and allowed to sit for 15 minutes before being extracted. For the fortified QC samples, 100 g of sediment that did not contain any of the target analytes was weighed and placed into a 250-mL screw-top Nalgene bottle, a 50-µL aliquot of the surrogate solution and a 100-µL aliquot of a 1-mg/L fortification solution (solution containing each target analyte) were added, and the sample was mixed and allowed to sit for 15 minutes before being extracted.
To each field and QC sample, 40 mL of 0.3 millinormal sodium hydroxide solution was added and thoroughly mixed throughout the soil. Methanol, 60 mL, was added and the sealed container was placed on a wrist shaker for 15 minutes. The container was transferred to a suitable centrifuge and spun at 3,000 revolutions per minute for 5 minutes. The liquid layer was carefully decanted into a 500-mL flat-bottomed round flask. The extraction process was repeated two additional times using 20-mL aliquots of the 0.3-millinormal sodium hydroxide solution. These extracts also were added to the 500-mL flat-bottomed round flask. The resulting solution was concentrated to a volume of 25 to 60 mL under vacuum by connecting the collection flask to a Roto-Vap and placing the flask in a 45 °C water bath. The concentrate was poured into the reservoir of a previously prepared solid-phase extraction column (packed with 3 cm3, 60 mg Oasis HLB, Waters Corporation), and the evaporation flask was rinsed with three 10-mL aliquots of water. The rinses also were added to the reservoir. Using a vacuum pump, the concentrate/rinsate solution was eluted through the solid-phase extraction column at a rate of one to two drops per second. After sample loading, the sorbent bed of the extraction column was washed with three 3–mL aliquots of a 5-percent methanol in water (volume/volume) solution. The vacuum pump was set to produce a 12–mm mercury vacuum, and the column was dried for 30 minutes to remove any residual liquid. After drying, a 15–mL centrifuge tube containing 0.5 mL of n-butyl acetate was placed beneath the sample outlet port connecting the extraction column to the vacuum manifold. The target analytes and surrogate compound were removed from the sorbent bed by eluting three 1-mL aliquots of methanol through the extraction column and collecting the eluates in the centrifuge tube. The vacuum pump was used to remove any residual solvent from the extraction column after each methanol elution. With the methanol eluates collected, the centrifuge tube was placed in an ambient temperature water bath and the sample was evaporated to approximately 0.5 mL by using a gentle stream of nitrogen gas. The concentrate was transferred to a 1-mL Type A volumetric tube. The centrifuge tube was rinsed with three 100-µL aliquots of n-butyl acetate, which then were added to the volumetric tube. A 50-µL aliquot of the internal standard solution (phenanthrene-d10) was added and the solution was then diluted to volume with n-butyl acetate and mixed. The final solution was transferred to a screw-top amber glass vial and analyzed by capillary gas chromatography/mass spectrometry. Ninety-five percent of the samples were analyzed in duplicate.
The median detection level for each compound was 0.049 ng/g (atrazine), 0.054 ng/g (deethylatrazine), 0.073 ng/g (deisopropylatrazine), 0.049 ng/g (alachlor), 0.096 ng/g (cyanazine), 0.034 ng/g (metolachlor), 0.073 ng/g (prometon), and 0.046 ng/g (simazine). The mean recovery efficiency for each compound in fortified QC samples was 103 percent (atrazine), 98.4 percent (deethylatrazine), 123 percent (deisopropylatrazine), 109 percent (alachlor), 110 percent (cyanazine), 107 percent (metolachlor), 110 percent (prometon), and 103 percent (simazine). The median percent difference in atrazine and deethylatrazine concentrations, based on analyses of four and eight replicate samples, respectively, was 8 and 14 percent.
A water-table monitoring well, AT's, HDP's, suction lysimeters, and gas-sampling ports were installed in each borehole (fig. 2). The AT's and HDP's were provided and maintained by the Kansas Geological Survey. Monitoring wells were constructed using flush-threaded, 5-cm-diameter, schedule-40 polyvinyl chloride (PVC) casing and screen. Each well had a 0.9- to 3-m-long sump at the bottom and a 3-m-long screen with 0.25-mm-wide slots. For the CNG and CAL–121 sites, the top of the screened interval was placed 2 to 3.4 m below the water table at the time of drilling. At CAL–122, however, the bottom of the screen was placed 1.2 m below the water table because of the presence of a clay layer below the water table. Generally, wells were installed by placing the PVC well screen and casing in the borehole after drilling to the target depth. A sand filter was then placed in the annular space around the well screen with a bentonite plug on top of the sand filter. As the 20-cm-diameter outer steel casing was removed from the hole, granular bentonite was used to seal the annular space from the top of the plug to the next instrumented interval.
The porous ceramic cup of each AT was epoxied to the bottom of a 3.2-cm-diameter, flush-threaded, schedule-80 PVC casing, which also provided the support for the HDP's, suction lysimeters, and gas-sampling ports. Hubbell and Sisson (1998) provided a detailed discussion of the AT's. The suction lysimeters (Model 1940, Soil Moisture Equipment Corporation, Goleta, California) were 4.8 cm in diameter and 60 cm in length, with 2-bar ceramic cups. The sample chamber was made of schedule-40 PVC. The gas-sampling ports consisted of 3.3-cm-diameter by 30-cm-long, stainless-steel wire-wrapped screens with 0.25-mm-wide openings attached to 0.6-cm-diameter copper tubing (Intermountain Drilling Supply, Salt Lake City, Utah). HDP's, suction lysimeters, and gas-sampling ports (with associated wiring or tubing) were attached to the outside of the PVC casing with plastic ties so the HDP, ceramic cup of the suction lysimeter, and midpoint of the gas-sampling port were located 0.3, 0.9, and 1.5 m, respectively, above the porous cup of the AT (fig. 8). The ceramic cup of each AT was saturated by soaking it in a beaker of deionized water before placing it in the borehole. Each HDP was embedded in silica flour, wrapped in cheesecloth, and saturated with deionized water before placing it in the borehole. Wires and tubing leading from the instrumentation to the land surface, together with data-logging devices (to be discussed in following sections), were housed at land surface in a weather-proofed structure constructed by the Kansas Geological Survey.

Figure 8. Photograph showing unsaturated-zone monitoring equipment being prepared for installation.
Different materials were used to backfill the borehole, depending on the instrumentation. Silica flour was used to backfill around the AT's, HDP's, and suction-cup lysimeters. Silica sand (10 to 20 mesh) was used to backfill around the gas-sampling ports. Granular bentonite was used to seal the annular space between instruments (fig. 2).
Water levels in the monitoring wells were measured manually using an electric tape during each site visit and automatically on a daily basis using a pressure transducer (Model PDX–261, In-Situ, Inc., Laramie, Wyo.) and data logger (Model 21X, Campbell Scientific, Inc., Logan, Utah) that were provided and maintained by the Kansas Geological Survey.
Matric potentials were measured in the field by using HDP's. The AT's used in this study proved ineffective because of their limited range of measurement (less than –817 cm), apparent damage during installation, and difficulties with the transducer; therefore, AT's will not be discussed further in this report. The reader is referred to Sophocleous and others (2002) for additional information regarding performance of the AT's. The HDP's used in this study (Model 229, Campbell Scientific, Inc., Logan, Utah) were calibrated at the HRL in Sacramento, Calif. The HDP consists of a thermocouple wire pair and heater wire enclosed in a hypodermic needle that is embedded in a cylindrical, porous ceramic body. The sensor operates by passing an electric current through the heater wire and measuring the thermocouple temperature rise with time. The rate of heat dissipation through the ceramic from the needle is dependent on the thermal conductivity of the ceramic, which will change with θ. When placed in contact with the soil, the HDP should equilibrate to the same matric potential as the soil. In this study, temperatures were measured 1 second after heating started and again 20 seconds after heating started (Sophocleous and others, 2002). The difference in temperature between the early and late reading was used to compute matric potential. The HDP's were controlled using the 21X data logger.
Water was collected from the monitoring wells and analyzed for tritium, major inorganic ions, nutrients, and pesticides and pesticide degradates. Only the tritium, chloride, nitrate, and pesticide data are presented and discussed in this report. Water from the monitoring wells was collected using a disposable plastic bailer or a submersible pump made of stainless steel and Teflon. For both sampling devices, three casing volumes of water were removed from the well before measuring pH, water temperature, specific conductance, alkalinity, and dissolved oxygen in the field. To minimize the risk of sample contamination, all sample collection and preservation took place in dedicated environmental chambers consisting of clear polyethylene bags supported by PVC frames. Sampling equipment was either disposed of (bailers) or thoroughly cleaned (submersible pump) after sampling each well. Unfiltered 1-L water samples were collected in unrinsed, high-density polyethylene bottles and capped with polyseal caps for the tritium analysis. The bottle caps were secured with electrical tape and stored at room temperature until delivery to the laboratory for analysis. Water samples collected for the analysis of chloride and nitrate were filtered using capsule filters (0.45 µm), collected in field-rinsed plastic bottles, and stored on ice with no other preservation. Water samples collected for the analysis of pesticides and pesticide degradates were passed through a methanol-rinsed stainless-steel filter chamber containing a baked 0.7-µm glass fiber filter. Pesticide samples were collected in clean baked amber-colored glass bottles and immediately chilled on ice until delivery to the laboratory for analysis.
Ground water also was collected from the large-capacity wells used to supply irrigation water at the study sites and analyzed for the same constituents as water from the monitoring wells. Irrigation water at each site was supplied by a single large-capacity well that pumped continuously for at least 1 week before sampling. Each well was equipped with a sampling port upstream from any chemical injection port. Procedures for measurement of field parameters and collection of water samples were the same as described for the monitoring wells.
Water in the unsaturated zone (soil water) was collected using the suction-cup lysimeters installed at each site and analyzed for inorganic anions and atrazine. At least 1 week before sampling, the lysimeters were purged of residual soil water from previous sampling events by using a hand pump to apply pressure to the sample chamber through the pressure/vacuum line. The lysimeters were equipped with one-way valves so water in the lysimeters could not reenter the formation when pressure was applied. Once the sample chamber was purged of residual water, a 60-centibar vacuum was applied to the sample-chamber/ceramic-cup assembly to induce the movement of new soil water into the lysimeter. The newly collected soil water was removed from the sample chamber as previously described. Soil water was initially collected in graduated polyethylene beakers to determine the volume of collected water. Aliquots of water from the beakers were then filtered through 0.45-µm syringe filters and stored in precleaned polyethylene or amber-glass bottles for anion and atrazine analyses.
Chemical analyses of water collected from monitoring and irrigation wells were done at the USGS National Water Quality Laboratory in Lakewood, Colo., using the methods of Fishman (1993) and Zaugg and others (1995). Tritium analyses were done at the USGS Tritium Laboratory in Menlo Park, Calif. (Thatcher and others, 1977), and analyses for chloroacetanilide herbicide degradation products were done at the USGS Pesticide Research Laboratory in Lawrence, Kans. (Hostetler and Thurman, 1999).
Soil water was analyzed for inorganic anions using ion chromatography with conductivity detection at the USGS Colorado District Laboratory. Detection limits for chloride and nitrate were about 0.1 mg/L and 0.05 mg/L as nitrogen (N), respectively. Soil water was analyzed for atrazine by immunoassay at the USGS Pesticide Research Laboratory in Lawrence, Kans. The detection limit for atrazine using the immunoassay method was 0.1 µg/L. The immunoassay may cross-react with other triazine herbicides beside atrazine. The most significant cross-reactivity is against the triazine herbicides ametryn, prometryn, and propazine (Thurman and others, 1990). However, ametryn was not used in the study area, prometryn's only row-crop usage is on cotton, and propazine is not used on row crops (Lisa Zimmerman, U.S. Geological Survey, written commun., 2000). The cross-reactivities of deethylatrazine and deisopropylatrazine are negligible; therefore, neither of these atrazine degradates was quantified using the immunoassay technique. This is not of concern for deisopropylatrazine because it is a minor degradate in soil, but deethylatrazine is a major degradation product of atrazine in soil (Adams and Thurman, 1991). A third atrazine degradate, hydroxyatrazine, also was not analyzed for in this study. Thus, the immunoassay analyses could underestimate the concentration of atrazine plus atrazine degradates in soil water.
Several approaches were used to evaluate water movement through the thick unsaturated zone at the study sites. Matric potentials and total water potentials were used to evaluate moisture conditions and directions of water movement, respectively. Tritium and chloride profiles were used to estimate water fluxes, and nitrate and pesticide profiles were used to evaluate the movement of agricultural chemicals through the unsaturated zone. Results of these analyses are presented in the following sections.
One of the most fundamental relations in hydrology is Darcy's Law. This relation states that the rate of water flow in a rigid, saturated, porous medium is equal to the product of the material's saturated hydraulic conductivity and the applied total hydraulic-head gradient. This relation can be expressed mathematically as
 (1)
(1)
where
| Q | is the volume of water flowing per unit time, | |
| A | is the cross-sectional area, and | |
| and | ||
| ΔH/ ΔX | is the total hydraulic-head gradient, where ΔH is the total head difference between the two points of interest, and ΔX is the total distance between the same two points. |
The quantity Q/A is referred to as the water flux and is denoted by the symbol q.
In the case where the porous material is unsaturated, the pathway for water flow becomes substantially reduced and the hydraulic conductivity of the material becomes a function of the water content. The governing equation (known as the Darcy-Buckingham equation) for such a system is a modification of equation 1 above, yielding
 (2)
(2)
where K(θ) represents the unsaturated hydraulic conductivity and H represents the total water potential. Assuming osmotic and pneumatic potentials are negligible, the total water potential can be separated into two components, the matric potential, h, and the gravitational potential, z. Water in the unsaturated zone moves from large to small total water potentials.
Matric potential is a function of water content and sediment texture, so both factors need to be considered when using matric potential to evaluate moisture conditions in the unsaturated zone. For example, the matric potentials at 41.5 m (–725 cm) and 48.0 m (–633 cm) at CNG were similar (table 2), given the ±102 cm accuracy of the HDP. However, the volumetric water content at 48.0 m was five times larger than the water content at 41.5 m (table 2). This difference in water content is attributed, in part, to the much larger clay plus silt content of sediment at 48.0 m (65 percent clay plus silt) compared to sediment at 41.5 m (11 percent clay plus silt). Sediment from 41.5 m at CNG, 35.4 m at CAL–121, and 35.4 m at CAL–122 had similar textures (table 2); therefore, matric potentials measured at those depths may be useful for comparing moisture conditions at those depths. The matric potentials measured by the 35.4-m HDP's at CAL–121 and CAL–122 were about three times larger than the matric potential measured by the 41.5-m HDP at CNG (table 2), indicating deep unsaturated-zone sediment at the CAL sites was wetter than deep sediment at CNG. In fact, the volumetric water contents of the two CAL cores from 35.4 m (0.081 and 0.090) were larger than the water content of the CNG core from 41.5 m (0.071). The wetter conditions at the CAL sites probably resulted from a combination of downward movement of irrigation water during the 34- to 35-year period of furrow irrigation and the declining water table at those sites (fig. 5). The smallest measured volumetric water content at each site occurred in sediment with at least 94 percent sand plus gravel (table 2). These small water contents may result from rapid drainage of water in these very coarse-grained sediments.
The HDP data indicate the instruments required several months to reach equilibrium with the formation (fig. 9). Although the ceramic of the HDP's was thoroughly saturated before borehole installation, a dry backfill material was used to minimize disturbance of the initial hydrologic conditions and to avoid introducing fluids that might alter the soil-water chemistry. If the geologic formation surrounding the instrument zone is relatively dry, the HDP will typically desaturate in the backfill material before the formation itself reaches potential equilibrium with the backfill material. After the initial equilibration period, the matric potentials remained relatively constant at most of the probe depths and did not change in response to recharge-event-based or seasonal fluctuations in matric potential that might have occurred near the land surface. Scanlon and others (1999) also observed little temporal fluctuation in matric potentials below a depth of about 7 m during more than 2 years of monitoring in the Chihuahuan Desert of Texas. Walvoord and others (2002) concluded that matric potentials in deep unsaturated zones under vegetated desert landscapes respond so slowly to surface transients, perhaps over thousands of years, that they appear to be at steady state. The apparent steady-state conditions shown in figure 9 also may result from the deep unsaturated zone having response times to surface transients longer than the measurement period (about 1 year).

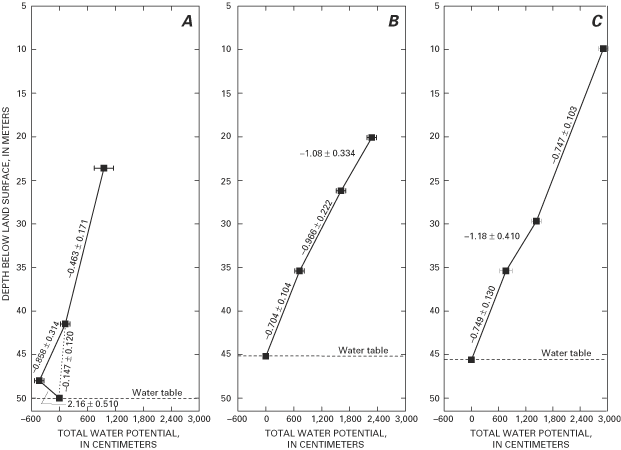
Total water potentials in the unsaturated zone at the CAL sites systematically decreased with depth to the arbitrary value of zero at the water table (figs. 10B and 10C). Water in the unsaturated zone moves from large to small potentials, so the data indicate a potential existed for downward water movement to the aquifer at the CAL sites. Total water-potential gradients across three of the depth intervals at the CAL sites were close to one (figs. 10B and 10C), which is the maximum gradient under gravity-driven flow. Total water potentials at CNG may not have systematically decreased with depth. The negative total water potential at 48.0 m indicates a potential existed for upward water movement from the water table (fig. 10A). The measurement at 48.0 m was made on sediment in the laboratory, so it is possible that the measurement was not representative of field conditions. Even if that measurement is excluded from the analysis, the total water-potential gradient between the 41.5-m HDP and water table was close to zero and was much smaller than the gradients above the water table at the CAL sites (fig. 10). This result indicates a much smaller potential existed for downward water movement to the aquifer at CNG compared to the CAL sites.
The preceding analysis of total water-potential gradients does not consider components of horizontal flow that might have developed because of the proximity of irrigated fields to the CAL boreholes and textural layering in the unsaturated zone. Horizontal flow could occur along contacts between sediment layers of contrasting texture. The contact between an upper gravelly sand and lower sandy clay loam at a depth of 27 m at CAL–122 may be an example of this (fig. 2). Gravity drainage of water in the coarse-grained sediment could be impeded by the fine-grained sediment, causing water to move laterally along the contact between the two layers. A different depositional sequence existed at a depth of about 20 m at CAL–121 where a gravelly sand was overlain by loamy sand (fig. 2). Because of the larger water content of the loamy sand (0.243 at 14.0 m) compared to the gravelly sand (0.058 at 26.2 m), the loamy sand could have the larger unsaturated hydraulic conductivity. As a consequence, the coarse-grained interval could act as a barrier to vertical water movement, in which case, water would move laterally along the contact of the gravelly sand and below the loamy sand. Matric-potential measurements at different locations along these contacts are needed to verify this potential for horizontal flow.
Tritium is a radioactive isotope of hydrogen with a half-life of about 12.3 years. It is an excellent tracer of water movement because it substitutes for stable hydrogen isotopes in the water molecule. Because tritium is radioactive, its concentration in the unsaturated zone decreases over time due to radioactive decay. In general, tritium in the unsaturated zone originates from precipitation. Before the onset of atmospheric testing of nuclear weapons in 1953 (prebomb), the tritium content of precipitation in the study area was probably about 8 TU (Thatcher, 1962). As a result of radioactive decay, moisture in the unsaturated zone derived from precipitation that fell before 1953 would contain less than 0.5 TU in 2000. The tritium content of precipitation increased substantially after the onset of atmospheric nuclear weapons testing but has slowly decreased from its peak in about 1963. Even with the variability in the tritium content of precipitation over time, moisture totally derived from precipitation that fell since 1953 (postbomb) contained more than 0.5 TU in 2000.
Tritium profiles for each site are shown in figures 11B, 12B, and 13B. The vertical dashed line in each plot indicates the estimated maximum concentration of prebomb tritium in the year 2000, which is the year samples for this study were collected and analyzed. At CNG, postbomb tritium was not detected below a depth of 1.9 m in the unsaturated zone or in ground water. In contrast, postbomb tritium was detected throughout most of the unsaturated zone and in ground water at both CAL sites. These data indicate post-1953 water moved more rapidly through the unsaturated zones at the CAL sites than at CNG.


Two methods were used to estimate water fluxes from the tritium profiles. In the case where the interface between prebomb and postbomb tritium may be present in the unsaturated zone or where the peak concentration of postbomb tritium in the unsaturated zone is attributed to the 1963 peak in the tritium concentration in precipitation, the water flux (q) would be calculated as
 (3)
(3)
where
| z | is the depth of the interface or postbomb peak below land surface, | |
| and | ||
| t | is the elapsed time since 1953 or 1963. |
Water fluxes calculated on the basis of equation 3 assume piston movement of the wetting front, with no lateral spreading with depth, or preferential flow (Izbicki and others, 2002). These assumptions may not be met at the study sites.
Water flux also was calculated using a tritium mass-balance approach (Allison and Hughes, 1978)
 (4)
(4)
where
| WT | is the total water (precipitation plus irrigation) applied at the land surface since 1953, | |
| t | is the elapsed time since 1953, | |
| T | is the measured amount of tritium in the unsaturated zone above the prebomb/postbomb interface, | |
| and | ||
| TT | is the total amount of tritium that could have been added to the profile since 1953. |
The value of T is obtained by integrating the tritium profile from land surface to the prebomb/postbomb interface
 (5)
(5)
where Tz and θz are the tritium concentration and volumetric water content measured at depth z. The total amount of tritium, corrected for decay, that could have been added to the profile is calculated as
 (6)
(6)
where
| n | is years before time of sampling, | |
| t | is elapsed time since 1953, | |
| wn | is a weighting function that takes into account year-to-year variations in recharge, | |
| Tn | is the tritium content of precipitation, | |
| Wn | is the amount of precipitation, | |
| and | ||
| λ | is the rate constant for tritium decay (0.0563/yr). |
The record of tritium in precipitation at Waco, Tex., was used for Tn (International Atomic Energy Agency, 1992). Precipitation data from Elkhart and Garden City, Kans. (High Plains Regional Climate Center, 2001) were used for Wn. The weighting function, wn, was calculated as
wn = (precipitation plus irrigation water applied in year n)/(average annual water application).(7)
Assumptions made in using equation 4 are that all postbomb tritium still resided in the unsaturated zone at the time of sampling (no breakthrough of postbomb tritium at the water table), irrigation water did not contain postbomb tritium, and recharge only occurred during the winter and irrigation seasons. Water from both irrigation wells contained small amounts of tritium in 2001 (1.1 to 2.1 TU). If postbomb tritium arrived at the irrigation wells after 1990 then this small amount of tritium would not be a factor in the analysis because the borehole locations did not receive irrigation water after 1989. If postbomb tritium was present in irrigation water prior to 1990 then the water flux calculated using equation 4 is an overestimate. According to Allison and others (1994), q estimated using the mass-balance method is independent of the tritium distribution in the profile; thus, it is unaffected by nonpiston flow.
A clearly defined postbomb peak was not present in any of the tritium profiles. An interface between prebomb and postbomb tritium was present in the unsaturated zone at CNG (fig. 13B), however, so the interface method was used to calculate a water flux in the interval containing postbomb tritium. The value assigned to z was somewhat subjective because of the lack of tritium data in the depth interval from 1.9 to 5.3 m, in which tritium concentrations decreased from postbomb to prebomb levels (fig. 11B). Therefore, three values of z were chosen: 1.9 m—the largest depth at which postbomb tritium was measured; 5.3 m—the shallowest depth at which prebomb tritium was measured; and 3.6 m—the midpoint between those two depths. A value of 47 years was used for t. None of the CNG core samples collected for measurement of volumetric water content were in the interval containing postbomb tritium; therefore, values of volumetric water content for that interval were calculated from measurements of gravimetric moisture content and bulk density (table 3). The weighted-average volumetric water content of the three samples from the top 5.1 m was 0.071. This weighting was based on the distances between adjacent samples. Water fluxes calculated using these values of z, t, and θ ranged from 2.9 to 8.0 mm/yr, with an average of 5.4 mm/yr. The water flux calculated using the mass-balance method was 4.4 mm/yr. These fluxes are in the lower end of the range in recharge fluxes to the central High Plains aquifer estimated using a two-dimensional areal simulation of ground-water flow (1.4 to 21 mm/yr) (Luckey and Becker, 1999). They are about in the middle of the range in values estimated using two-dimensional cross-sectional simulations of ground-water flow calibrated using carbon–14 ages of ground water (0.8 to 8 mm/yr) (P.B. McMahon, unpub. data, on file in Colorado District Office of the U.S. Geological Survey). The water fluxes at CNG probably overestimate current recharge fluxes (defined as the water flux below the root zone) because the postbomb tritium was confined to depths within the root zone. The base of the root zone was assumed to be at a depth of 2.5 to 3 m, which corresponds to the depth at which the peak chloride concentration in the unsaturated zone occurred (fig. 11C).
[m, meter; g/g, grams of water per gram of dry sediment; g/cm3, grams of dry sediment per cubic centimeter of sediment; cm3/cm3, cubic centimeters of water per cubic centimeter of sediment]| Site | Depth(m) | Gravimetric water content(g/g) | Bulk density(g/cm3) | Volumetric water content(cm3/cm3) |
|---|---|---|---|---|
| CNG | 0.23 | 0.064 | 1.86 | 0.119 |
| 1.75 | .044 | 1.86 | .082 | |
| 5.11 | .017 | 1.86 | .032 | |
| 8.15 | .021 | 1.86 | .039 | |
| 11.20 | .203 | 1.84 | .374 | |
| 14.10 | .019 | 1.71 | .032 | |
| 17.30 | .047 | 1.86 | .087 | |
| 20.35 | .021 | 1.86 | .039 | |
| 23.39 | .080 | 1.84 | .147 | |
| 29.49 | .101 | 1.84 | .186 | |
| 35.28 | .026 | 1.86 | .048 | |
| 47.78 | .247 | 1.84 | .454 | |
| CAL–121 | .23 | .212 | 1.84 | .390 |
| .84 | .082 | 1.71 | .140 | |
| 1.75 | .033 | 1.71 | .056 | |
| 2.51 | .026 | 1.71 | .044 | |
| 3.20 | .033 | 1.71 | .056 | |
| 4.95 | .083 | 1.71 | .142 | |
| 6.60 | .157 | 1.86 | .292 | |
| 8.15 | .098 | 1.86 | .182 | |
| 9.68 | .109 | 1.71 | .186 | |
| 11.20 | .072 | 1.71 | .123 | |
| 14.24 | .126 | 1.84 | .232 | |
| 17.30 | .067 | 1.84 | .123 | |
| 20.34 | .020 | 1.86 | .037 | |
| 23.24 | .029 | 1.86 | .054 | |
| 26.44 | .043 | 1.86 | .080 | |
| 29.49 | .027 | 1.86 | .050 | |
| 41.68 | .146 | 1.86 | .272 | |
| CAL–122 | .99 | .139 | 1.70 | .236 |
| 1.75 | .089 | 1.70 | .151 | |
| 2.51 | .027 | 1.86 | .050 | |
| 3.28 | .009 | 1.86 | .017 | |
| 5.11 | .208 | 1.86 | .387 | |
| 6.63 | .050 | 1.71 | .086 | |
| 8.15 | .115 | 1.84 | .212 | |
| 9.68 | .063 | 1.71 | .108 | |
| 11.20 | .050 | 1.71 | .086 | |
| 14.25 | .012 | 1.71 | .021 | |
| 17.30 | .035 | 1.86 | .065 | |
| 20.35 | .016 | 1.86 | .030 | |
| 23.24 | .019 | 1.86 | .035 | |
| 26.44 | .023 | 1.86 | .043 | |
| 29.49 | .180 | 1.64 | .295 | |
| 41.68 | .019 | 1.86 | .035 | |
| 44.73 | .035 | 1.86 | .065 |
Interfaces between prebomb and postbomb tritium may have been present in the intervals from 14.4 to 17.4 m below land surface at CAL–121 and 11.3 to 14.4 m below land surface at CAL–122 (figs. 12B and 13B). At both sites, postbomb tritium was detected again deeper in the profile at a depth that was close to the estimated depth of the early 1960's water table. The water-table depths in the early 1960's were estimated on the basis of 2000–2001 water levels in the monitoring wells and historical water-level declines in those areas (figs. 5B and 5C). These findings indicate that ground water in the irrigated areas may have contained postbomb tritium in the early 1960's and that postbomb tritium detected below the tritium-depleted zones in 2000 was from the declining water table and not from movement through the local unsaturated zone. The weighted-average volumetric water content in the upper 17.3 m at CAL–121 was 0.160 and it was 0.141 in the upper 14.3 m at CAL–122. Using equation 3, calculated water fluxes for 1953 to 2000 ranged from 49 to 59 mm/yr, with an average of 54 mm/yr, at CAL–121 and from 34 to 43 mm/yr, with an average of 39 mm/yr, at CAL–122. Water fluxes estimated using the mass-balance method, and assuming postbomb tritium below the interfaces was not from the local unsaturated zone, were 34 mm/yr at CAL–121 and 21 mm/yr at CAL–122. The factor of 1.6 to 1.9 difference in water-flux estimates using two different techniques is relatively small given the uncertainty associated with each approach. Most of the water movement through the unsaturated zones at the CAL sites probably occurred from 1955–56 to 1989 when the borehole locations received direct applications of irrigation water; therefore, these average fluxes may underestimate water fluxes that occurred during the period of furrow irrigation.
In the preceding analysis, it was assumed that postbomb tritium reached the water table somewhere in the vicinity of the CAL sites by the early 1960's. Downward water velocities (equal to distance traveled divided by time of travel) of at least 2 to 3 m/yr would be required for postbomb tritium to reach a water table 18 to 27 m below land surface by 1962. Such rapid water movement seems unlikely unless it occurred as preferential flow in the unsaturated zone, downward leakage through the annular space of improperly sealed wells (wellbore leakage), or spatially variable recharge with most recharge occurring in focused recharge zones such as ditches and depressions. If one or more of these processses did occur during the late 1950's or early 1960's, then there is no apparent reason to believe they did not still occur at the time of this study.
If postbomb tritium did not reach the water table before the start of its decline in the early 1960's, then postbomb tritium detected beneath the tritium-depleted zones must have resulted from bypass or preferential flow in the local unsaturated zone. As discussed in the section "Total Water Potentials," the gravelly sand from about 20 to 26.5 m below land surface at CAL–121 was drier than the overlying loamy sand, which could result in the gravelly sand being a barrier to water movement because of its reduced unsaturated hydraulic conductivity at small water contents. Postbomb tritium could either have moved laterally around the gravelly sand or possibly downward by gravity drainage, once sufficient water had accumulated at the top of the interval to allow water entry into the coarse sediment. In the latter scenario, most of the interval could contain old water but be interspersed with vertical pathways containing postbomb tritium during periods of drainage. This is analogous to the theory of fingering during infiltration described by Hillel and Baker (1988) and Baker and Hillel (1990). A minimum estimate of water flux can be made by assuming postbomb tritium arrived at the CAL water tables in 2000 when they were 45.2 m (CAL–121) and 45.6 m (CAL–122) below land surface. The weighted-average volumetric water contents of the sediment above the 2000 water tables were 0.121 and 0.109 at CAL–121 and CAL–122, respectively. Substituting these values in equation 3 gives water fluxes of 116 and 106 mm/yr at CAL–121 and CAL–122, respectively.
Analysis of the tritium profiles shows that water fluxes at the CAL sites were at least 4 to 12 times larger than at CNG, assuming postbomb tritium detected beneath the tritium-depleted zones at the CAL sites was from the declining water table. If postbomb tritium detected beneath the tritium-depleted zones at the CAL sites resulted from bypass or preferential flow in the local unsaturated zone, then water movement at the CAL sites may have been at least 20 times faster than at CNG. In either case, these results indicate irrigation was an important driving force for water movement through the unsaturated zone at the CAL sites.
Chloride profiles for each site are shown in figures 11C, 12C, and13C. The similarity between core and cuttings data shows there was little mixing of cuttings from different depths as they were transported up the borehole during drilling. The chloride profile at CNG was similar to profiles reported from arid and semiarid areas in New Mexico, Texas, and California (Phillips, 1994; Scanlon, 1991; Izbicki and others, 2000). The profile was characterized by small chloride concentrations (1 to 5 µg/g) at depths less than 2.5 m below land surface that increased to maximum concentrations (28 to 37 µg/g) at depths 2.5 to 3 m below land surface before decreasing to consistently small concentrations (less than 1.5 µg/g) below a depth of 14.5 m. The small chloride concentrations in the upper 2.5 m may be the result of dilution by precipitation that occurred shortly before the samples were collected. Chloride enrichment immediately below this surficial zone was attributed to concentration in the root zone by evapotranspiration. The chloride enrichment also may be related to lithology because the two primary zones of chloride enrichment (2.5 to 3 m and 9 to 13.5 m) corresponded to zones with large clay and silt contents (figs. 11A and 11C). Decreases in chloride concentrations below the root zone have been attributed to preferential flow of water (Scanlon, 1991), which could dilute chloride concentrations deeper in the profile, or to larger water fluxes in the past associated with cooler, wetter climates (Phillips, 1994; Scanlon and Goldsmith, 1997). If water preferentially moved past the root zone to dilute chloride concentrations deeper in the profile, it also is likely postbomb tritium would have been detected deeper in the profile. However, postbomb tritium was not detected deeper than 1.9 m at CNG. Thus, the tritium profile is consistent with piston-type flow and does not indicate preferential flow occurred in the unsaturated zone at CNG.
The chloride peak in the unsaturated zone at CAL–121 was 15 to 20 m below land surface (fig. 12C). The absence of a chloride peak and presence of postbomb tritium in the upper 15 m at CAL–121 indicates that recent water movement in that interval may have flushed out chloride that had accumulated before the onset of irrigation. A water-flux estimate can be made using equation 3 and the measured downward displacement of the chloride peak at CAL–121 relative to the chloride peak at the rangeland site (figs. 11C and 12C). This estimate assumes that the depth of the chloride peak at CAL–121 prior to the onset of irrigation was the same as at CNG. The centers of mass of the chloride peaks at CNG and CAL–121 were at depths of about 2.8 and 17.5 m below land surface in 2000, representing a downward displacement of 14.7 m. The elapsed time since irrigation began at CAL–121 was 44 years, and the weighted-average volumetric water content in the upper 17.3 m at CAL–121 was 0.160. Substituting these values in equation 3 results in a water flux of 53 mm/yr. This water flux compares well with the tritium-based water-flux estimate of 54 mm/yr that assumed postbomb tritium in the deep unsaturated zone was from a declining water table.
A chloride peak occurred about 2 m below land surface at CAL–122 (fig. 13C), even though the upper 11 m at CAL–122 also contained postbomb tritium. That peak might represent incompletely flushed chloride that accumulated before the onset of irrigation, a past agricultural-chemical application containing chloride (for example, potassium chloride), or enrichment by evapotranspiration after direct applications of irrigation water were stopped in 1990.
Chloride profiles have been used by several researchers to calculate water fluxes in the unsaturated zone (Allison and Hughes, 1978, 1983; Johnston, 1987; Cook and others, 1989; Scanlon, 1991; Scanlon and Goldsmith, 1997). Chloride is a useful tracer of water movement in the unsaturated zone because it is chemically conservative, nonvolatile (no vapor transport), and generally is not taken up by plants. Under steady-state conditions, one-dimensional chloride transport in the unsaturated zone is described by the following equation (Scanlon and Goldsmith, 1997)
 (8)
(8)
where
| qCl | is the chloride flux at the land surface, | |
| cCl | is the chloride concentration in soil water, | |
| q | is the water flux, | |
| and | ||
| Dh | is the hydrodynamic dispersion coefficient. |
The value of qCl is approximated by the product of the annual precipitation rate and chloride concentration in wet plus dry deposition. The first term on the right represents the advective flux of chloride and the second term represents the dispersive flux of chloride. In semiarid regions like southwestern Kansas, the dispersive flux of chloride is assumed negligible (Allison and Hughes, 1983; Scanlon and Goldsmith, 1997); therefore, equation 4 is simplified to
 (9)
(9)
The primary assumptions associated with the use of chloride profiles to calculate water fluxes are that precipitation was the only source of chloride, water and chloride movement are represented by one-dimensional downward piston-type flow, and the chloride flux at the land surface was constant over time (Allison and Hughes, 1978; Johnston, 1987; Scanlon, 1991). There were no strong mineralogic sources of chloride in the unsaturated zone at CNG, as indicated by the small chloride concentration of 13 mg/L in ground water at that site; therefore, wet plus dry deposition at the land surface likely was the only substantial source of chloride. Irrigation water and potassium-chloride applications may have been additional sources of chloride at the CAL sites; therefore, the chloride profiles at the CAL sites were not used to estimate water fluxes. As previously discussed, the tritium profile at CNG is consistent with piston-type flow. It is not possible to evaluate the validity of the third assumption with the available data.
Equation 9 was used to calculate water fluxes at CNG. Chloride concentrations measured in the cores were used for cCl rather than concentrations measured in cuttings because the cores had associated gravimetric water-content data needed to convert chloride concentrations from micrograms per gram to grams per cubic meter (table 4). The chloride profile at CNG, in grams per cubic meter, is shown in figure 14A. The chloride flux at the land surface was approximated as the product of the mean annual precipitation rate and the concentration of chloride in wet plus dry deposition. The mean annual precipitation rate, 452 mm/yr, was based on data collected from 1900 to 2000 at a weather station in Elkhart, Kans. (fig. 1), about 29 km west of CNG (High Plains Regional Climate Center, 2001). Measurements of chloride concentrations in wet plus dry deposition were not made in the vicinity of CNG. However, Wood and Sanford (1995) reported a chloride concentration of 0.6 g/m3 in wet plus dry deposition collected in 1984–85 in Amarillo, Tex., located about 210 km south of CNG. Scanlon and Goldsmith (1997) calculated a chloride concentration of 0.3 g/m3 in wet plus dry deposition near Amarillo on the basis of prebomb 36Cl/Cl ratios in fallout, which may be more representative of long-term chloride inputs than recent measurements (Bridget Scanlon, Texas Bureau of Economic Geology, written commun., 2002). Therefore, the chloride concentration in wet plus dry deposition reported by Scanlon and Goldsmith (1997), 0.3 g/m3, was used in this study. For comparison, the mean chloride concentration (±1 standard deviation) was 0.117±0.026 g/m3 in only wet deposition collected from 1984 to 2000 at three National Atmospheric Deposition Program sites that geographically bracketed CNG and the city of Amarillo (sites in Scott County, Kansas, Texas County, Oklahoma, and Bailey County, Texas) (National Atmospheric Deposition Program, 2001). If the chloride concentration in wet plus dry deposition exhibited a proportional amount of variability, the concentration would be about 0.3±0.07 g/m3. The chloride flux at the land surface calculated on the basis of the precipitation rate and chloride concentrations would be 0.14±0.03 g/m2/yr. The lack of site-specific information on chloride concentrations in wet plus dry deposition represented the largest uncertainty in the water-flux calculations by the chloride mass-balance method.
Table 4. Gravimetric water content and chloride concentrations in sediment cores from CNG.
[m, meter; g/g, grams of water per gram of dry sediment; µg/g, micrograms of chloride per gram of dry sediment; g/m3, grams of chloride per cubic meter of water]| Sample depth (m) | Gravimetric water content (g/g) | Concentration of chloride (µg/g) | Concentration of chloride (g/m3) |
|---|---|---|---|
| 0.23 | 0.064 | 0.85 | 13 |
| 1.75 | .044 | .79 | 18 |
| 5.11 | .017 | 3.06 | 184 |
| 8.15 | .021 | 5.22 | 253 |
| 11.2 | .203 | 12.03 | 59 |
| 14.1 | .019 | 1.15 | 61 |
| 17.3 | .047 | .99 | 21 |
| 20.35 | .021 | 1.18 | 56 |
| 23.39 | .080 | 1.59 | 20 |
| 29.49 | .101 | 2.11 | 21 |
| 35.28 | .026 | 1.35 | 52 |
| 47.78 | .247 | 3.31 | 13 |

The chloride mass-balance method assumes the chloride flux at the land surface was constant; therefore, the variability in soil-water chloride concentrations is attributed to variations in the water flux. Water fluxes calculated for depths below the root zone ranged from 2.4 to 10 mm/yr, with a average of 5.1 mm/yr. This average flux was within the range in recharge fluxes to the central High Plains aquifer estimated using the ground-water flow simulations discussed earlier (Luckey and Becker, 1999; P.B. McMahon, unpub. data, on file in Colorado District Office of the U.S. Geological Survey). Wood and Sanford (1995) used a form of equation 9 and concentrations of choride in ground water to estimate recharge fluxes to the southern High Plains aquifer. Using their approach and the average chloride concentration (13 mg/L) in water from the CNG monitoring well yielded a recharge flux of 11±2 mm/yr, which is similar to the fluxes estimated using chloride concentrations in the unsaturated zone.
The length of time since water moved through the deep unsaturated zone can be estimated using equation 10 (Scanlon and Goldsmith, 1997; Izbicki and others, 2002)
 (10)
(10)
where
| t | is chloride age, | |
| and | ||
| z | is depth below land surface. |
This equation states that the chloride age equals the total mass of chloride present in the unsaturated zone above a given depth divided by the chloride flux at the land surface. Use of equation 10 assumes precipitation was the only source of chloride in the sediments and the chloride flux at the land surface remained constant over time. Chloride ages are shown in figure 14B. The chloride age at the base of the unsaturated zone was about 1,600 years, implying that it has been several hundred years since water moved through the deep unsaturated zone at CNG. This age is considerably younger than the chloride ages reported for sites in the Chihuahuan and Mojave Deserts where chloride ages were in excess of 10,000 years (Scanlon, 1991; Izbicki and others, 2000). This age difference results from smaller long-term water fluxes in those settings, generally less than 0.2 mm/yr, compared to the average flux at CNG of 5.1 mm/yr. Chloride ages of several hundred years below the root zone indicate that chloride mass-balance estimates of water flux do not represent current recharge fluxes.
Elevated nitrate and pesticide concentrations in the unsaturated zone and ground water at the irrigated sites are further evidence of relatively rapid water movement through unsaturated zones in irrigated areas of the central High Plains. Nitrate was detected in unsaturated-zone sediment from each of the three sites (figs. 11D, 12D, and 13D); however, nitrate in sediment from CNG was confined to the upper 11.5 m of the section. The relatively large nitrate concentration (259 µg/g) measured in sediment at a depth of 3.2 m probably resulted from evaporative concentration in the root zone. The profile of nitrate concentrations in the unsaturated zone at CNG is consistent with the relatively small nitrate concentrations (1.1 to 1.2 mg/L as N) measured in ground water at that site. In a recent study of water quality in the central High Plains aquifer, a median nitrate concentration of 2.04 mg/L as N was reported in 32 water samples containing less than 0.3 TU tritium (Becker and others, 2002). Litke (2001) reported a median nitrate concentration of 2.1 mg/L as N in the central High Plains aquifer on the basis of 1,468 analyses. These findings indicate nitrate concentrations in water from the CNG monitoring well were typical of background concentrations in the aquifer and do not indicate any input of nitrate from anthropogenic sources. Water from the CNG monitoring well contained more than 6 mg/L dissolved oxygen so it is unlikely denitrification, which largely occurs in suboxic or anoxic settings, could account for the small nitrate concentrations in ground water.
The pattern of nitrate detections in the unsaturated zone at CAL–121 (fig. 12D) was very similar to the pattern of postbomb-tritium detections (fig. 12B). Nitrate was detected above and below an interval from 17.4 to 26.5 m in which essentially no postbomb tritium or nitrate was detected. This pattern of detections indicates nitrate-enriched, post-1953 water moved to a depth of at least 14.4 to 17.4 m below land surface at CAL–121. Depending on the role played by the declining water table in leaving residual nitrate in the deep unsaturated zone, it is possible nitrate moved through the local unsaturated zone to a depth greater than 17.4 m.
Nitrate concentrations in water from the CAL–121 monitoring well ranged from 20 to 24 mg/L as N and were about 10 times larger than the estimated background nitrate concentrations in the aquifer. Water from the deep lysimeter at CAL–121 contained from 27 to 34 mg/L of nitrate N, which is not very different from the nitrate concentrations in ground water at that site. This similarity in concentrations is consistent with nitrate in the deep unsaturated zone coming from a declining water table or from downward water movement through the unsaturated zone at CAL–121. In either case, the nitrate concentrations in ground water at CAL–121 indicate relatively large amounts of nitrate reached the water table in this area dominated by irrigated agriculture.
The source of nitrate in ground water at CAL–121 cannot be distinguished on the basis of data presented in this report. Some possible sources of the nitrate include N applied to nearby fields and nitrate that accumulated in the unsaturated zone prior to the onset of irrigation. The nitrate data from CNG indicate substanial amounts of nitrate could have accumulated in the unsaturated zone before the onset of irrigation. Later, deep percolation of irrigation water could have mobilized that nitrate. Measurements of N isotopes in nitrate might provide insights into the sources of nitrate at the study sites and could be the subject of future investigations.
Nitrate concentrations in ground water from CAL–122 were small, ranging from 0.03 to 0.4 mg/L as N (fig. 13D). These small concentrations probably were not due to a lack of recent recharge because ground water at CAL–122 contained tritium and pesticides. Instead, the small nitrate concentrations probably were the result of denitrification. Concentrations of dissolved oxygen were less than 1 mg/L in ground water from CAL–122 and indicate geochemical conditions at CAL–122 were conducive to denitrification.
The use of preemergent herbicides, like atrazine, to control weeds on corn and other row crops began in the mid-1950's (Plummer and others, 1993), so their presence in ground water is a good indicator of recent recharge. Concentrations of selected pesticides in sediment and water at the CNG and CAL sites are shown in figure 15. Pesticides or their degradation products were detected in sediment, soil water, and ground water at both CAL sites. In contrast, only a single pesticide degradation product (deisopropylatrazine) was detected in the shallowest sediment sample at CNG. No pesticides were detected in ground water from CNG. The maximum total pesticide concentration in any single ground-water sample from the CAL sites was 0.923 µg/L and at CNG it was less than 0.01 µg/L. The maximum atrazine concentration detected in deep soil water at the CAL sites was 0.79 µg/L (fig. 15B). Sediments at CNG were too dry to yield water to lysimeters installed at that site, so pesticide analyses of soil water could not be performed. Records of atrazine use provided by the landowner indicate it was first applied on the CAL–121 and CAL–122 fields in 1960 and 1958, respectively; therefore, recent recharge containing atrazine may have moved through the unsaturated zone to the water table at both sites during a period of 40 to 42 years. However, the possibility that the pesticide detections in the deep unsaturated zone and ground water at the CAL sites were the result of the declining water table cannot be ruled out. A minimum estimate of water flux can be made using equation 3 and assuming atrazine reached the water table in 2000. Based on this assumption, minimum water fluxes at the CAL sites were 118 to 137 mm/yr. These water fluxes are larger than the tritium-based estimates because the time available for atrazine transport (40 to 42 years) was less than the time available for tritium transport (about 47 years).

The large nitrate and pesticide concentrations in ground water at the CAL sites indicate relatively large amounts of nitrate and pesticides reached the water table in these areas dominated by irrigated agriculture. Although elevated nitrate concentrations at the CAL sites cannot be directly linked to agricultural N applications, agricultural pesticide applications are the most likely source of the pesticides detected in the unsaturated zone and ground water. The persistence of a downward hydraulic gradient from the deep unsaturated zone to the water table at the CAL sites, coupled with the large nitrate and atrazine concentrations in deep soil water, indicates the deep unsaturated zone will be a source of nitrate and atrazine to the aquifer in the future.
The High Plains aquifer is the principal source of water for irrigated agriculture in the study area, transforming it into one of the most productive agricultural regions of the world. This transformation, however, has come at the cost of declining water levels in the aquifer. Water-level declines were greatest in those parts of the High Plains aquifer where irrigation was developed first and where it was most intense. Chemical data indicate agricultural activities have affected the quality of water in the aquifer. Understanding the movement of water and chemicals from land surface to the aquifer is crucial to developing management plans that ensure future water supplies (aquifer sustainability) and to assessing the water quality of the High Plains aquifer. This report evaluates water movement through thick unsaturated zones overlying the central High Plains aquifer. Chemical, hydraulic, and physical data were collected from throughout the unsaturated zone at one site where rangeland was the dominant land use and at two sites where irrigated agriculture was the dominant land use. In 2000–2001, the depth to water at the rangeland site was 50 m and the depth to water at the irrigated sites was about 45.4 m. Irrigation at the study sites first began in 1955–56.
Measurements of matric potential and volumetric water content indicate wetter conditions existed in the deep unsaturated zone at the irrigated sites than at the rangeland site. Total water potentials in the unsaturated zone indicate a potential existed for downward water movement from the unsaturated zone to the water table at the irrigated sites. At the rangeland site, little or no potential existed for downward water movement from the unsaturated zone to the water table.
The depth of the interface between prebomb and postbomb tritium and a tritium mass balance were used to estimate water fluxes in the unsaturated zone at each site. The average water fluxes at the rangeland site were 5.4 and 4.4 millimeters per year for the interface and mass-balance methods. Postbomb tritium at the rangeland site was confined to the root zone, so actual recharge fluxes to the aquifer probably were less than the estimated water fluxes. Tritium profiles in the unsaturated zone at the irrigated sites were complicated by the presence of tritium-depleted intervals separating upper and lower zones containing postbomb tritium. If the interface between prebomb and postbomb tritium was at the top of the tritium-depleted interval and postbomb tritium detected beneath that interval was from the declining water table in the area, then the average water flux at the irrigated sites was estimated to be 39 to 54 millimeters per year. The water fluxes estimated using the mass-balance method were 21 to 34 millimeters per year. If postbomb tritium detected beneath the tritium-depleted interval was from bypass or preferential water movement through the local unsaturated zone instead of the declining water table, then the minimum water flux at the irrigated sites was estimated to be 106 to 116 millimeters per year. In either scenario, water fluxes at the irrigated sites were at least 4 to 12 times larger than the flux at the rangeland site, indicating irrigation was an important driving force for water movement through the unsaturated zone.
At the irrigated site CAL–121, an independent water-flux estimate of 53 mm/yr, which was based on the downward displacement of chloride by deep percolation, compares well with the tritium-based water-flux estimate of 54 mm/yr that assumed postbomb tritium in the deep unsaturated zone was from a declining water table, supporting this hypothesis for the origin of postbomb tritium in the deep unsaturated zone. This scenario for tritium movement at the irrigated sites assumes postbomb tritium reached the water table somewhere in the vicinity of the those sites by the early 1960's. Downward water velocities (equal to distance traveled divided by time of travel) of at least 2 to 3 meters per year would be required for postbomb tritium to reach a water table 18 to 27 meters below land surface by 1962. Such rapid water movement seems unlikely unless it occurred as preferential flow in the unsaturated zone, downward leakage through the annular space of improperly sealed wells (wellbore leakage), or spatially variable recharge with most recharge occurring in focused recharge zones such as ditches and depressions. If these processses did occur during the late 1950's or early 1960's, then there is no apparent reason to believe they did not occur at the time of this study.
Regardless of the possible roles played by preferential flow, wellbore leakage, and focused recharge, the large nitrate and pesticide concentrations in ground water at the irrigated sites indicate relatively large amounts of nitrate and pesticides reached the water table in these areas dominated by irrigated agriculture. Although elevated nitrate concentrations in the irrigated sites cannot be directly linked to agricultural N applications, agricultural pesticide applications are the most likely source of the pesticides detected in the unsaturated zone and ground water. The persistence of a downward hydraulic gradient from the deep unsaturated zone to the water table at the irrigated sites, coupled with the large nitrate and atrazine concentrations in deep soil water, indicate that the deep unsaturated zone will be a source of nitrate and atrazine to the aquifer in the future. Extrapolation of these study results to the entire central High Plains area indicates that under 2000–2001 climatic conditions, most recharge and chemical loading to the aquifer probably occurred in irrigated areas.
Adams, C.D., and Thurman, E.M., 1991, Formation and transport of deethylatrazine in the soil and vadose zone: Journal of Environmental Quality, v. 20, p. 540–547.
Allison, G.B., Gee, G.W., and Tyler, S.W., 1994, Vadose-zone techniques for estimating ground-water recharge in arid and semiarid regions: Soil Science Society of America Journal, v. 58, p. 6–14.
Allison, G.B., and Hughes, M.W., 1978, The use of environmental chloride and tritium to estimate total recharge to an unconfined aquifer: Australian Journal of Soil Research, v. 16, p. 181–195.
Allison, G.B., and Hughes, M.W., 1983, The use of natural tracers as indicators of soil-water movement in a temperate semi-arid region: Journal of Hydrology, v. 60, p. 157–173.
American Society for Testing and Materials, 1997, Standard test method for sieve analysis of fine and coarse aggregates, C 136–96a: Annual Book of ASTM Standards.
Baker, R.S., and Hillel, D., 1990, Laboratory tests of a theory of fingering during infiltration into layered soils: Soil Science Society of America Journal, v. 54, p. 20–30.
Becker, M.F., Bruce, B.W., Pope, L.M., and Andrews, W.J., 2002, Ground-water quality in the central High Plains aquifer, Colorado, Kansas, New Mexico, Oklahoma, and Texas, 1999: U.S. Geological Survey Water-Resources Investigations Report 02–4112, 63 p.
Campbell, G.S., and Gee, G.W., 1986, Water potential—Miscellaneous methods, in Klute, A., ed., Methods of soil analysis, pt. 1 (2d ed.): p. 625–628.
Cook, P.G., Walker, G.R., and Jolly, I.D., 1989, Spatial variability of groundwater recharge in a semiarid region: Journal of Hydrology, v. 111, p. 195–212.
Costa, J.L., Massone, H., Martinez, D., Suero, E.E., Vidal, C.M., and Bedmar, F., 2002, Nitrate contamination of a rural aquifer and accumulation in the unsaturated zone: Agricultural Water Management, v. 57, p. 33–47.
Dennehy, K.F., 2000, High Plains regional ground-water study: U.S. Geological Survey Fact Sheet 091–00, 6 p.
Dennehy, K.F., Litke, D.W., and McMahon, P.B., 2002, The High Plains aquifer, USA—Ground-water development and sustainability, in Hiscock, K.M., Rivett, M.O., and Davison, R.M., eds., Sustainable groundwater development: London Geological Society, Special Publication 193, p. 99–119.
Dickey, H.P., Swafford, W.R., and Markley, Q.L., 1963, Soil survey of Morton County, Kansas: U.S. Department of Agriculture, Soil Conservation Service Series 1960, no. 8, 51 p.
Driscoll, F.G., 1986, Groundwater and wells: Johnson Filtration Systems, Inc., Saint Paul, Minn., 1089 p.
Fishman, M.J., 1993, Methods of analysis by the U.S. Geological Survey National Water Quality Laboratory—Determination of inorganic and organic constituents in water and fluvial sediments: U.S. Geological Survey Open-File Report 93–125, 217 p.
Gee, G.W., and Bauder, J.W., 1986, Particle-size analysis, in Klute, A., ed., Methods of soil analysis, physical and mineralogical methods, 2d ed.: Soil Science Society of America Monograph 9, pt. 1, p. 383–412.
Gutentag, E.D., Heimes, F.J., Krothe, N.C., Luckey, R.R., and Weeks, J.B., 1984, Geohydrology of the High Plains aquifer in parts of Colorado, Kansas, Nebraska, New Mexico, Oklahoma, South Dakota, Texas, and Wyoming: U.S. Geological Survey Professional Paper 1400–B, 63 p.
Hammermeister, D.P., Blout, D.O., and McDaniel, J.C., 1986, Drilling and coring methods that minimize the disturbance of cuttings, core, and rock formations in the unsaturated zone, Yucca Mountain, Nevada: Proceedings of the National Water Well Association Conference on Characterization and Monitoring of the Vadose (Unsaturated) Zone, National Water Well Association, Worthington, Ohio, p. 507–541.
Harner, R.F., Agell, R.C., Lobmeyer, M.A., and Jantz, D.R., 1965, Soil survey of Finney County, Kansas: U.S. Department of Agriculture, Soil Conservation Service Series 1961, no. 30, 91 p.
Herbel, M.J., and Spalding, R.F., 1993, Vadose zone fertilizer-derived nitrate and δ15N extracts: Ground Water, v. 31, p. 376–382.
High Plains Regional Climate Center, 2001, Data on the World Wide Web at http://hpccsun.unl.edu/wrcc/states/ks.html (accessed 09/26/01).
Hillel, D., and Baker, R.S., 1988, A descriptive theory of fingering during infiltration into layered soils: Soil Science, v. 146, p. 51–56.
Hostetler, K.A., and Thurman, E.M., 1999, Determination of chloroacetanilide herbicide metabolites in water using high-performance liquid chromatography-diode array detection and high-performance liquid chromatography/mass spectrometry, in Morganwalp, D.W., and Buxton, H.T., eds., 1999, U.S. Geological Survey Toxic Substances Hydrology Program Proceedings of the technical meeting, Charleston, S.C., March 8–12, 1999—v. 2, Contamination of hydrologic systems and related ecosystems: U.S. Geological Survey Water-Resources Investigations Report 99–4018B, 482 p.
Hubbell, J.M., and Sisson, J.B., 1998, Advanced tensiometer for shallow or deep soil water potential measurements: Soil Science, v. 163, p. 271–277.
International Atomic Energy Agency, 1992, Statistical treatment of data on environmental isotopes in precipitation: Technical Report Series 331, 781 p.
Izbicki, J.A., Radyk, J., and Michel, R.L., 2000, Water movement through a thick unsaturated zone underlying an intermittent stream in the western Mojave Desert, southern California, USA: Journal of Hydrology, v. 238, p. 194–217.
Izbicki, J.A., Radyk, J., and Michel, R.L., 2002, Movement of water through the thick unsaturated zone underlying Oro Grande and Sheep Creek Washes in the western Mojave Desert, USA: Hydrogeology Journal, v. 10, p. 409–427.
Johnston, C.D., 1987, Distribution of environmental chloride in relation to subsurface hydrology: Journal of Hydrology, v. 94, p. 67–88.
Komor, S.C., and Emerson, D.G., 1994, Movements of water, solutes, and stable isotopes in the unsaturated zones of two sand plains in the upper Midwest: Water Resources Research, v. 30, p. 253–267.
Lindau, C.W., and Spalding, R.F., 1984, Major procedural discrepancies in soil extracted nitrate levels and nitrogen isotopic values: Ground Water, v. 22, p. 273–278.
Litke, D.W., 2001, Historical water-quality data for the High Plains Regional Ground-Water study in Colorado, Kansas, Nebraska, New Mexico, Oklahoma, South Dakota, Texas, and Wyoming: U.S. Geological Survey Water-Resources Investigations Report 00–4254, 65 p.
Luckey, R.R., Gutentag, E.D., Heimes, F.J., and Weeks, J.B., 1986, Digital simulation of ground-water flow in the High Plains aquifer in parts of Colorado, Kansas, Nebraska, New Mexico, Oklahoma, South Dakota, Texas, and Wyoming: U.S. Geological Survey Professional Paper 1400–D, 57 p.
Luckey, R.R., and Becker, M.F., 1999, Hydrogeology, water use, and simulation of flow in the High Plains aquifer in northwestern Oklahoma, southeastern Colorado, southwestern Kansas, northeastern New Mexico, and northwestern Texas: U.S. Geological Survey Water-Resources Investigations Report 99–4104, 68 p.
McGuire, V.L., and Sharpe, J.B., 1997, Water-level changes in the High Plains aquifer—Predevelopment to 1995: U.S. Geological Survey Water-Resources Investigations Report 97–4081, 2 pls.
McMahon, P.B., 2000, A reconnaissance study of the effect of irrigated agriculture on water quality in the Ogallala Formation, central High Plains aquifer: U.S. Geological Survey Fact Sheet FS–009–00, 6 p.
McMahon, P.B., 2001, Vertical gradients in water chemistry in the central High Plains aquifer, southwestern Kansas and Oklahoma Panhandle, 1999: U.S. Geological Survey Water-Resources Investigations Report 01–4028, 47 p.
National Atmospheric Deposition Program, 2001, Data on the World Wide Web at http://nadp.sws.uiuc.edu/nadpdata/ (accessed 09/26/01).
Olson, C.G., Nettleton, W.D., Porter, D.A., and Brasher, B.R., 1997, Middle Holocene aeolian activity on the High Plains of west-central Kansas: The Holocene, v. 7, p. 255–261.
Phene, C.J., Hoffman, G.J., and Rawlins, S.L., 1971, Measuring soil matric potential in situ by sensing heat dissipation within a porous body—I. Theory and sensor construction: Soil Science Society of America Proceedings, v. 35, p. 27–32.
Phillips, F.M., 1994, Environmental tracers for water movement in desert soils of the American southwest: Soil Science Society of America Journal, v. 58, p. 15–24.
Plummer, L.N., Michel, R.L., Thurman, E.M., and Glynn, P.D., 1993, Environmental tracers for age dating young ground water, in Alley, W.M., ed., Regional ground-water quality: New York, Van Nostrand Reinhold, p. 255–294.
Qi, Sharon, Konduris, A., and Litke, D.W., 2002, Classification and mapping of irrigated lands using satellite imagery—High Plains aquifer area, 1990: U.S. Geological Survey Water-Resources Investigations Report 02–4236, 30 p.
Scanlon, B.R., 1991, Evaluation of moisture flux from chloride data in desert soils: Journal of Hydrology, v. 128, p. 137–156.
Scanlon, B.R., and Goldsmith, R.S., 1997, Field study of spatial variability in unsaturated flow beneath and adjacent to playas: Water Resources Research, v. 33, p. 2239–2252.
Scanlon, B.R., Langford, R.P., and Goldsmith, R.S., 1999, Relationship between geomorphic settings and unsaturated flow in an arid setting: Water Resources Research, v. 35, p. 983–999.
Smith, H.T.U., 1940, Geological studies in southwestern Kansas: Kansas Geological Survey Bulletin 34, 244 p.
Sophocleous, M.A., Kluitenberg, G., and Healy, J., 2002, Southwestern Kansas High Plains unsaturated zone pilot study to estimate Darcian-based ground-water recharge at three sites: Kansas Geological Survey Open-File Report 2002–11, 46 p.
Spalding, R.F., and Kitchen, L.A., 1988, Nitrate in the intermediate vadose zone beneath irrigated cropland: Ground Water Monitoring Review, Spring Issue, p. 89–95.
Spalding, R.F., Watts, D.G., Schepers, J.S., Burbach, M.E., Exner, M.E., Poreda, R.J., and Martin, G.E., 2001, Controlling nitrate leaching in irrigated agriculture: Journal of Environmental Quality, v. 30, p. 1184–1194.
Thatcher, L.L., 1962, The distribution of tritium fallout in precipitation over North America: Bulletin of the International Association of Scientific Hydrology, v. 7, p. 48–58.
Thatcher, L.L., Janzer, V.J., and Edwards, K.W., 1977, Methods for determination of radioactive substances in water and fluvial sediments: U.S. Geological Survey Techniques of Water-Resources Investigations, chap. A–5, 95 p.
Thurman, E.M., Meyer, M., Pomes, M., Perry, C.A., and Schwab, A.P., 1990, Enzyme-linked immunosorbent assay compared with gas chromatography/mass spectrometry for the determination of triazine herbicides in water: Analytical Chemistry, v. 62, p. 2043–2048.
Tindall, J.A. and Kunkel, J.R., 1999, Unsaturated zone hydrology for scientists and engineers: Upper Saddle River, New Jersey, Prentice-Hall, 624 p.
Townsend, M.A., Sleezer, R.O., and Macko, S.A., 1996, Effects of agricultural practices and vadose zone stratigraphy on nitrate concentrations in ground water in Kansas, USA: Water Science and Technology, v. 33, p. 219–226.
Walvoord, M.A., Plummer, M.A., Phillips, F.M., and Wolfsberg, A.V., 2002, Deep arid system hydrodynamic—1. Equilibrium states and response times in thick desert vadose zones: Water Resources Research, v. 38, p. 44.1–44.15.
Weeks, J.B., Gutentag, E.D., Heimes, F.J., and Luckey, R.R., 1988, Summary of the High Plains regional aquifer-system analysis in parts of Colorado, Kansas, Nebraska, New Mexico, Oklahoma, South Dakota, Texas, and Wyoming: U.S. Geological Survey Professional Paper 1400–A, 30 p.
Wood, W.W., and Sanford, W.E., 1995, Chemical and isotopic methods for quantifying ground-water recharge in a regional, semiarid environment: Ground Water, v. 33, p. 458–468.
Zaugg, S.D., Sandstrom, M.W., Smith, S.G., and Fehlberg, K.M., 1995, Methods of analysis by the U.S. Geological Survey National Water Quality Laboratory—Determination of pesticides in water by C–18 solid-phase extraction and capillary-column gas chromatography/mass spectrometry with selected-ion monitoring: U.S. Geological Survey Open-File Report 95–181, 60 p.
Document Accessibility: Adobe Systems Incorporated has information about PDFs and the visually impaired. This information provides tools to help make PDF files accessible. These tools convert Adobe PDF documents into HTML or ASCII text, which then can be read by a number of common screen-reading programs that synthesize text as audible speech. In addition, an accessible version of Acrobat Reader 6.0, which contains support for screen readers, is available. These tools and the accessible reader may be obtained free from Adobe at Adobe Access.
| AccessibilityFOIAPrivacyPolicies and Notices | |
 |
|