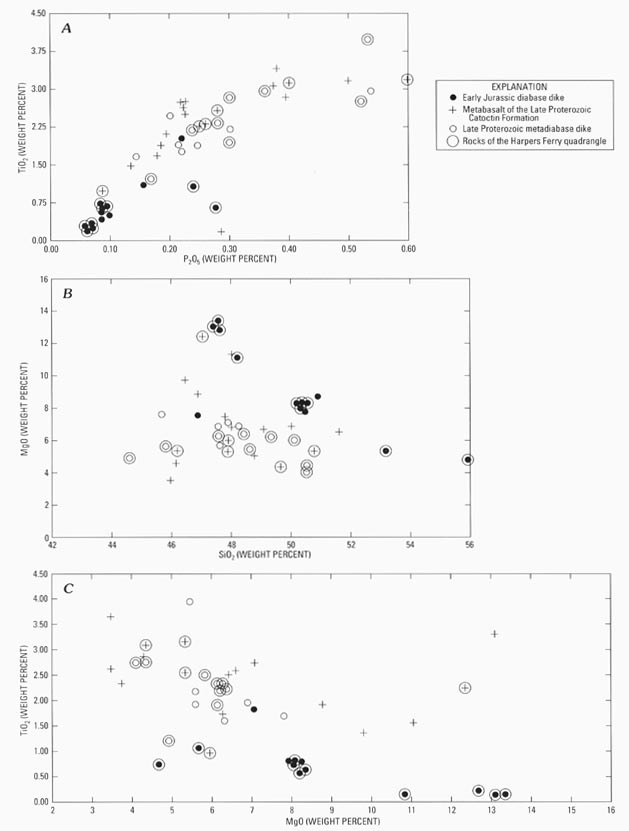
Figure 7. Variation diagrams for Late Proterozoic metadiabase dikes, metabasalt of the Late Proterozoic Catoctin Formation, and Early Jurassic diabase dikes. Circled symbols represent data on rocks of the Harpers Ferry quadrangle; other data are for rocks from other quadrangles. Data from
table 1 and Southworth (1994; 1995).
A, TiO
2 versus P
2O
5;
B, MgO versus SiO
2; and
C, TiO
2 versus MgO.