|
|
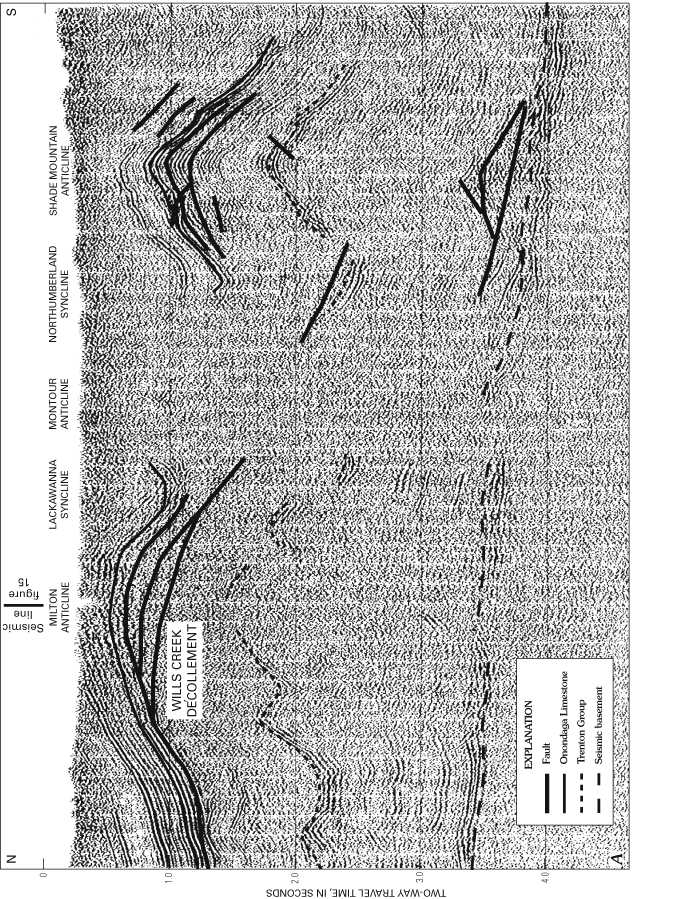
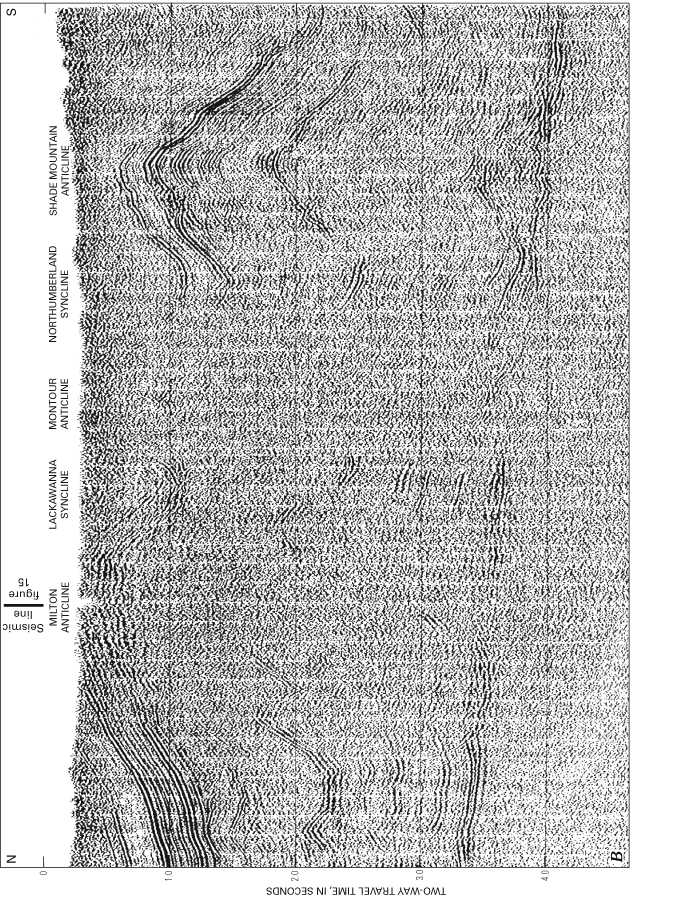
Figure 14. A, Dip-line seismic-reflection profile across the Milton and Montour anticlines shown in figure 11. Solid lines are interpreted faults; dashed lines are key reflectors. From Pohn and Coleman (1991). Profile shows seismic data collected along a line approximately 36 mi long. B, Same profile as A but uninterpreted. |
This page is https://pubs.usgs.gov/bulletin/b2163/html/fig14.html
Maintained by Eastern Publications Group Web Team
Last updated 02.15.01 (krw)