![]()
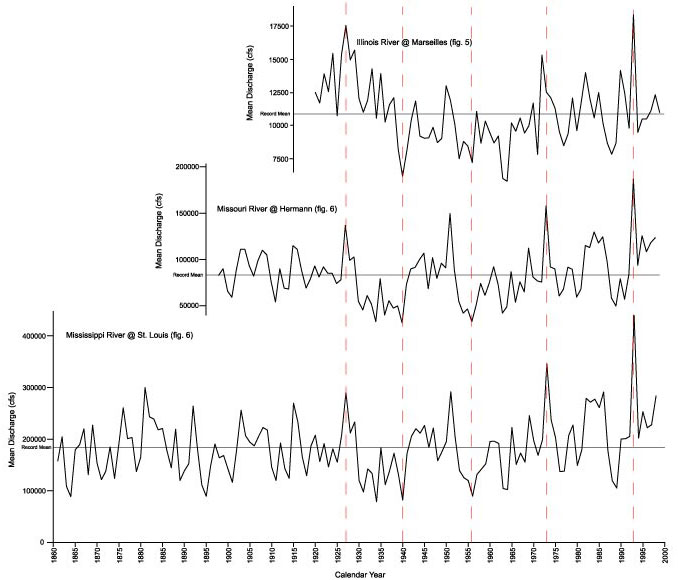
Figure 10. Mean annual discharge through time at three gaging stations: Marseilles on the Illinois River, Hermann on the Missouri River, and St. Louis on the Mississippi River. Dashed vertical lines track similarities between the records; the horizontal line in each record represents the mean discharge for the entire record. cfs, cubic feet per second.
U.S. Geological Survey, U.S. Department of the Interior
This page is https://pubs.usgs.gov/bulletin/b2187/figure10.html
Contact: Harry Dowsett (hdowsett@usgs.gov)
Last modified 09.07.01 (krw)
This page is https://pubs.usgs.gov/bulletin/b2187/figure10.html
Contact: Harry Dowsett (hdowsett@usgs.gov)
Last modified 09.07.01 (krw)