![]()
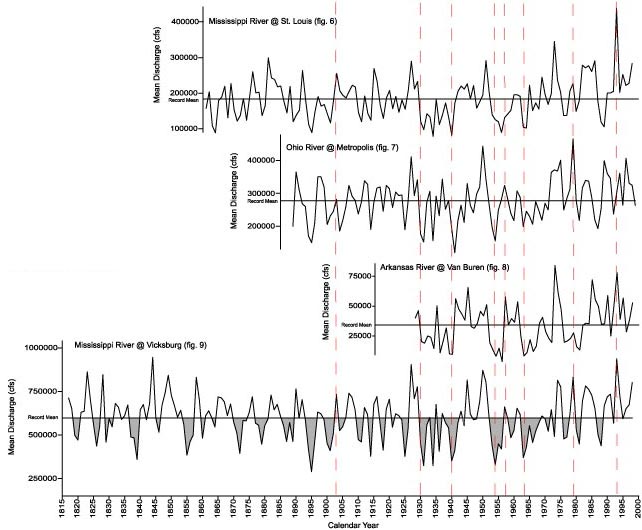
Figure 11. Mean annual discharge through time at four gaging stations: St. Louis on the
Mississippi River, Metropolis on the Ohio River, Van Buren on the Arkansas River, and Vicksburg on the Mississippi River. Dashed vertical lines track similarities between the records; the horizontal line in each record represents the mean discharge for the entire record. The Vicksburg record is shaded to accent intervals of low flow. cfs, cubic feet per second.
U.S. Geological Survey, U.S. Department of the Interior
This page is https://pubs.usgs.gov/bulletin/b2187/figure11.html
Contact: Harry Dowsett (hdowsett@usgs.gov)
Last modified 09.07.01 (krw)
This page is https://pubs.usgs.gov/bulletin/b2187/figure11.html
Contact: Harry Dowsett (hdowsett@usgs.gov)
Last modified 09.07.01 (krw)