![]()
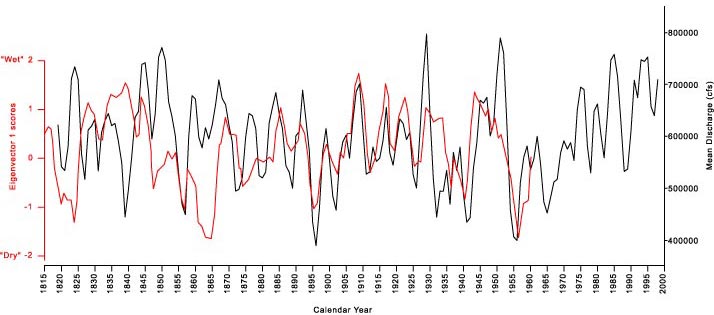
Figure 13. Graph comparing discharge record of the Mississippi River at Vicksburg, Miss., with a proxy for wet and dry conditions derived from tree-ring studies in the Great Plains region (eigenvector 1 of Meko, 1992). Records are smoothed (3-year moving average) to reduce interannual fluctuations. Records show similar variation between 1860 and 1960. Correlation of the records (r2) between 1890 and 1930 is +0.82. See text for discussion.
U.S. Geological Survey, U.S. Department of the Interior
This page is https://pubs.usgs.gov/bulletin/b2187/figure13.html
Contact: Harry Dowsett (hdowsett@usgs.gov)
Last modified 09.07.01 (krw)
This page is https://pubs.usgs.gov/bulletin/b2187/figure13.html
Contact: Harry Dowsett (hdowsett@usgs.gov)
Last modified 09.07.01 (krw)