![]()
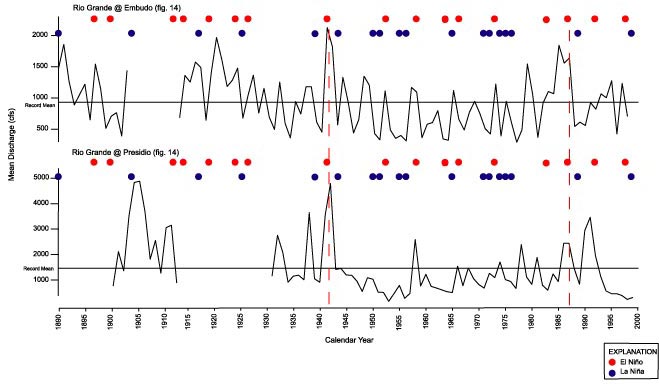
Figure 17. Mean annual discharge through time for two gaging stations for the Rio Grande at Embudo and Presidio showing El Niño (red dots) and La Niña (blue dots) events from figure 4. Dashed vertical lines track similarities between the records; the horizontal line in each record represents the mean discharge for the entire record. cfs, cubic feet per second.
U.S. Geological Survey, U.S. Department of the Interior
This page is https://pubs.usgs.gov/bulletin/b2187/figure17.html
Contact: Harry Dowsett (hdowsett@usgs.gov)
Last modified 09.07.01 (krw)
This page is https://pubs.usgs.gov/bulletin/b2187/figure17.html
Contact: Harry Dowsett (hdowsett@usgs.gov)
Last modified 09.07.01 (krw)