![]()
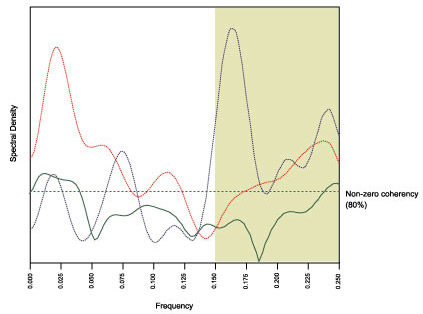
Figure 20. Cross-spectral analysis of the mean annual discharge (red) of the Rio Grande at Presidio, 1930-97, and the Southern Oscillation Index (SOI, blue). Coherency (green) is the tendency for variations observed over a given frequency band in flow to be linearly related to comparable variations observed in SOI. Coherency values above the non-zero level are statistically significant. Tan shading highlights range of frequencies between 4 and 6.5 years.
U.S. Geological Survey, U.S. Department of the Interior
This page is https://pubs.usgs.gov/bulletin/b2187/figure20.html
Contact: Harry Dowsett (hdowsett@usgs.gov)
Last modified 09.07.01 (krw)
This page is https://pubs.usgs.gov/bulletin/b2187/figure20.html
Contact: Harry Dowsett (hdowsett@usgs.gov)
Last modified 09.07.01 (krw)