![]()
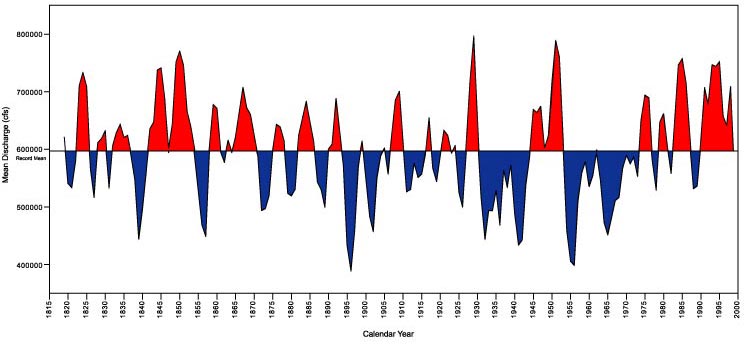
Figure 21. Smoothed (3-year moving average) mean annual discharge of the Mississippi River at Vicksburg, Miss. The station location is shown in figure 9. The horizontal line represents the mean discharge for the entire record. Parts of the graph above and below the mean are different colors to accent flow variations. cfs, cubic feet per second.
U.S. Geological Survey, U.S. Department of the Interior
This page is https://pubs.usgs.gov/bulletin/b2187/figure21.html
Contact: Harry Dowsett (hdowsett@usgs.gov)
Last modified 09.07.01 (krw)
This page is https://pubs.usgs.gov/bulletin/b2187/figure21.html
Contact: Harry Dowsett (hdowsett@usgs.gov)
Last modified 09.07.01 (krw)