![]()
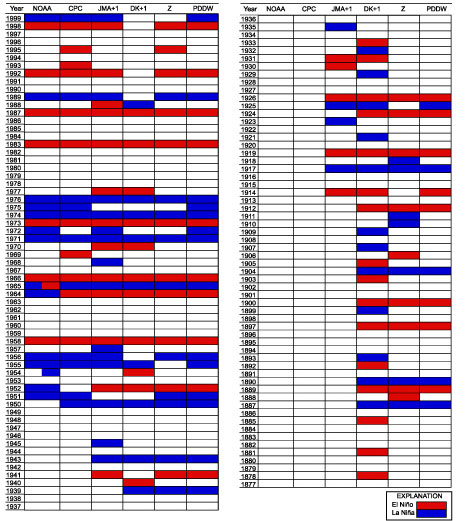
NOAA: The events in the column under NOAA are major events since 1950 as identified by the National Oceanic and Atmospheric Administration multivariate ENSO (El Niño/Southern Oscillation) index. Data are from NOAA's Climate Diagnostics Center (http://www.cdc.noaa.gov/ENSO/enso.kd.html).
CPC: Events under CPC are from NOAA's Climate Prediction Center. The CPC data are a seasonal assessment of El Niño and La Niña conditions based on sea-surface temperature (SST) conditions in the tropical Pacific Ocean since 1950 (see http://www.cpc.noaa.gov:80/products/analysis_monitoring/ensostuff/ensoyears.html). We used the CPC seasonal characterizations to identify significant El Niño and La Niña events. Years with El Niño or La Niña conditions in all four seasons were classified as an El Niño or La Niña event as appropriate. In general, years with moderate or strong El Niño or La Niña designations in two or more seasons were identified as events if the seasons were adjacent. The year of the event was based on the likely effect of the event. Table 1 shows the CPC data and our identification of El Niño and La Niña years.
JMA+1: Events under JMA+1 are based on SST anomalies in the tropical Pacific as determined by the Japan Meteorological Society since 1914. The index uses 5-month running means of spatially averaged SST anomalies over the area between lats 4°S.-4°N. and longs 180°W.-90°W. Anomalies must exceed threshold values of ±0.5 for 6 months to be classified as the warm or cold phase of ENSO. The ENSO events tabulated by the JMA are in water years (October to September). We have added 1 year to the JMA dates because events starting in October tend to affect extratropical areas in the following calendar year (see http://www.coaps.fsu.edu/~legler/jma_index.html).
DK+1: Events under DK+1 are from Diaz and Kiladis (1992). ENSO events are identified by a combination of changes in the Southern Oscillation Index (SOI) and tropical SST anomalies derived from ship data since 1877 (see Kiladis and Diaz, 1989). The ENSO events listed in Diaz and Kiladis (1992) are in water years (October to September), and so we have added 1 year to the events to translate them into calendar years.
Z: Events under Z are derived from plots of the SOI and SST changes since 1886 in the eastern equatorial Pacific region known as NINO3 (see Zebiak, 1999, fig. 2). We designate El Niño and La Niña events for years in which the plot shows that both the SOI and NINO3 indices deviate >±1 from average values.
PDDW: The composite record used in our study is listed under the heading of PDDW (Poore, Darling, Dowsett, and Wright).
This page is https://pubs.usgs.gov/bulletin/b2187/figure4.html
Contact: Harry Dowsett (hdowsett@usgs.gov)
Last modified 09.26.01 (krw)