How the table was made:
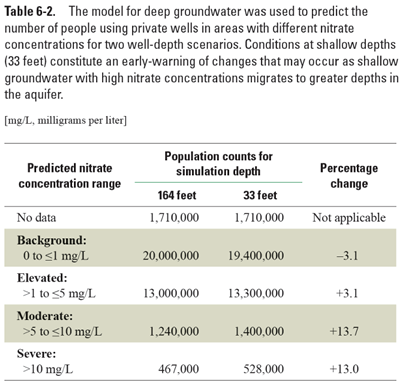
The table applies the model for deeper groundwater to estimate how many people in the conterminous U.S. who drink water from private wells live in areas where the model predicts elevated concentrations of nitrate in groundwater. The model simulated two depths, 10 and 50 meters. The results indicated that at the shallower well depth of 10 meters, more people reside in areas where predicted levels of nitrate are in the severely impacted range (more than 10 milligrams per liter). The original source of this table is Table 3 of Nolan and Hitt (2006, page 7839).
The population estimates were based on: 1) a tabular file of population and housing unit counts from the 1990 Census, 2) a digital map of the block group boundaries of the conterminous United States, and 3) a digital map of the predicted nitrate concentrations from the model of deeper groundwater used as drinking-water supply.
The 1990 Census of population and housing Summary Tape File 3A (STF3A) (Geolytics, 2001) provided counts of population, counts of housing units by source of water, and land area by block group. If water was supplied from a well serving four or fewer housing units, the housing units were classified as having water supplied by an individual well.
Block group boundaries for 1990 were assembled from the U.S. Bureau of the Census (1990) Cartographic Boundary Files. Cartographic Boundary Files are vector files generalized from 1:100,000-scale TIGER Line Files and are designed for use at scales from about 1:500,000 to 1:5,000,000.
Instead of using total housing unit counts provided in STF3A, the total housing units per block group was calculated from the total number of housing units having data on type of sewage disposal (C.V. Price, USGS, written commun., 2005). An average number of people per housing unit was calculated from 1990 population divided by the number of housing units in the block group. The average number of people per housing unit was multiplied by the number of housing units on individual wells to come up with a number representing total people using individual wells per block group. This value is keyed by a block group identifier to the corresponding block group boundary depicted in the national map of 1990 generalized block groups.
The model for deeper groundwater used as drinking water is described in Figure 6-6 and in Nolan and Hitt (2006).
National 1-kilometer resolution grids of the estimated number of people on wells and the nitrate concentrations predicted by the groundwater model were intersected to sum the number of people on wells by 5 nitrate prediction classes:
References cited:
Geolytics, 2001, CensusCD 1990 Long Form product, digital data on CDROM, Geolytics, Inc., East Brunswick, New Jersey.
Nolan, B.T., and Hitt, K.J., 2006, Vulnerability of shallow groundwater and drinking-water wells to nitrate in the United States: Environmental Science and Technology, v. 40, no. 24, p. 7834–7840, accessible at http://water.usgs.gov/nawqa/nutrients/pubs/est_v40_no24/.
U.S. Bureau of the Census, 1990, 1990 Census block group cartographic boundary files, digital files, accessed February 14, 2003, at http://www.census.gov/geo/www/cob/bg1990.html.
For more information contact:
Bernard T. Nolan, NAWQA Nutrient Synthesis
U.S. Geological Survey
12201 Sunrise Valley Drive
Mail Stop 413
Reston, Virginia 20192
Voice: 703-648-5666
Fax: 703-648-6693
Email: btnolan@usgs.gov

![]() U.S. Department of the Interior |
U.S. Geological Survey
U.S. Department of the Interior |
U.S. Geological Survey
URL: http://pubsdata.usgs.gov/pubs/circ/1350/table_6_02.html
Page Contact Information: GS Pubs Web Contact
Page Last Modified: Wednesday, 27-Mar-2019 17:27:55 EDT
