
 |
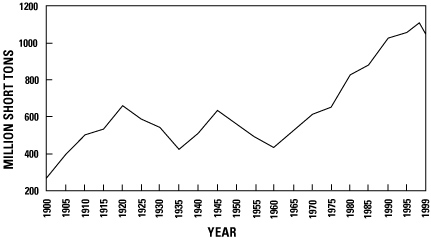
Figure 1. Graph showing trends in U.S. coal production from 1900 to 1999. The rapid growth in production after 1960 is attributed to (1) abundant reserves, (2) high productivity resulting in favorable prices for coal, and (3) the large increase in demand for electricity. Data from Energy Information Administration (2000). |
U.S. Department of the Interior, U.S. Geological Survey
URL: https://
pubsdata.usgs.gov
/pubs/circ/c1143/html/fig1.html
For more information, contact Stanley Schweinfurth
Maintained by Eastern Publications Group
Last modified:
12:28:51 Wed 23 Nov 2016
Privacy statement | General disclaimer | Accessibility