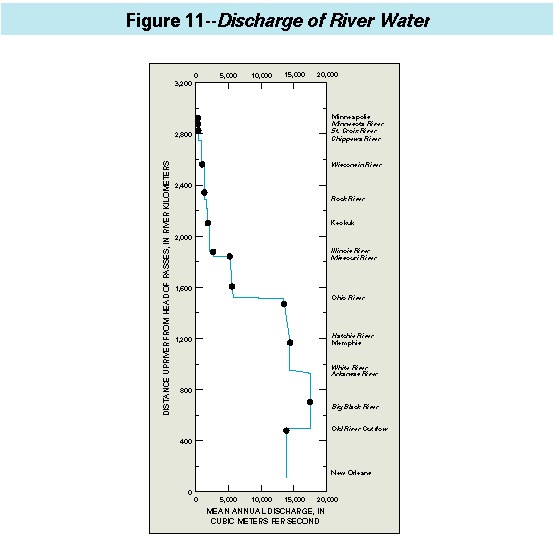
(Click on image for a larger version, 33K)Figure 11. -- To understand the chemical character of the Mississippi River, we first have to understand how the river is nourished by its tributaries. The effects of tributaries on river chemistry depend less on their absolute water discharges than on their relative contributions to the local water discharge of the Mississippi River. Tributaries whose discharges would hardly qualify them as significant contributors to the Lower Mississippi River are highly significant contributors of water, sediment, and contaminants to the Upper Mississippi River. In this graph are plotted the mean discharges of the Mississippi River for the period of record prior to 1989 (data from U.S. Army Corps of Engineers and USGS; for a somewhat different portrayal of the same data, see figure 5A). The mean water discharge in the Mississippi River at a site 8 km upstream from the Minneapolis city limits is 225 cubic meters per second (m3/s). Thirty-two kilometers farther downstream, the average discharge is increased by about 50 percent as the Minnesota River joins the Mississippi in downtown Minneapolis. For the next 772 kilometers, the average water discharge of the Mississippi River increases slowly to about 1,810 m3/s at Keokuk, Iowa. Just upstream from St. Louis, Missouri, the contributions from the Illinois and Missouri Rivers more than double the mean water discharge to 5,140 m3/s. In a relatively short distance of 290 km downstream from St. Louis, the Ohio River again more than doubles the water discharge so that just downstream from the Mississippi-Ohio confluence the Lower Mississippi River discharge averages 13,500 m3/s. The Lower Mississippi River is now transporting so much water that, in a relative sense, the White and Arkansas Rivers are the only major tributaries between the Ohio River and the Gulf of Mexico. Their combined contribution is only about 10 percent of the Lower Mississippi River's discharge but this equals the discharge of the Upper Mississippi River at Keokuk, Iowa. Tributaries like the Hatchie River in Tennessee and the Big Black River in Mississippi have mean discharges similar to that of the Minnesota River but only contribute about 1 percent of the mean discharge of the Lower Mississippi River. Even though the Hatchie and Big Black Rivers contribute as much water as the Minnesota River, their local effects on the discharge of the Mississippi River are only about one-fiftieth of the local effect of the Minnesota River.
 (Click on image for a larger version, 116K)
Figure 12. -- The amount of dissolved chemicals or dissolved solids in river water depends on the solubility of the rocks and soil and the rainfall within a drainage basin. The map shows the dissolved solids (DS, in milligrams per liter, or mg/L) added to the Mississippi River by some of its tributaries; the median concentration of dissolved solids shown for each basin is the median value in water samples collected at the gaging station closest to the mouth of the tributary. The graph on the left side of the figure shows the variation of the median concentration of dissolved solids along the length of the Mississippi River for the period from 1970 through 1991. Triangles on the map show the locations of the gaging stations that are represented as dots on the graph. The median concentration of DS in the Mississippi River upstream from St. Paul, Minnesota, is about 170 mg/L. This increases sharply with the addition of water from the Minnesota River (median concentration is 550 mg/L)-a western tributary draining plains developed on fairly soluble sedimentary rocks in a region of relatively low mean annual precipitation (50-70 cm/yr; all precipitation figures are taken from U.S. Geological Survey, 1970, p. 97-99). Downstream from the Minnesota River, the eastern tributaries (St. Croix, Chippewa, and Wisconsin Rivers) drain terranes varying from glacial gravel and sand deposits in the northeast to sandstone and limestone hills along the Mississippi River and receiving slightly greater precipitation (70-80 cm/yr). These tributaries contribute water with low DS concentrations (74 to 129 mg/L) which dilute the DS concentration in the Mississippi River below St. Paul, Minnesota. However, downstream from Clinton, Iowa, the Rock, Iowa, Des Moines, Illinois, and Missouri Rivers have median DS concentrations between 280 and 380 mg/L and thus increase the DS concentration of the Mississippi River in a series of steps, up to a maximum of 300 mg/L at Thebes, Illinois. These tributaries drain a predominantly agricultural region (with the exception of the Illinois River, which also drains the urban areas of Chicago, Peoria, and Springfield, Illinois) consisting of plains underlain by relatively soluble sedimentary rocks and receiving a wider range of precipitation (40-100 cm/yr). The Ohio River drains mostly hilly and mountainous terranes composed of predominantly insoluble rocks that receive relatively high precipitation (100-130 cm/yr) resulting in a high discharge (7,750 m3/s) with a relatively low DS concentration (170 mg/L). When this large amount of Ohio River water mixes with the Upper Mississippi River water, the DS concentration in the Mississippi is reduced to about 220 mg/L. The concentration in the Mississippi River remains nearly constant at sites farther downstream to New Orleans because the eastern tributaries (like the Yazoo River) to the Lower Mississippi River drain the alluvial plain and adjacent uplands that receive the highest precipitation (130-150 cm/yr), contain low DS concentrations (53-75 mg/L), and discharge relatively small volumes of water into the Lower Mississippi River.
 (Click on image for a larger version, 116K)
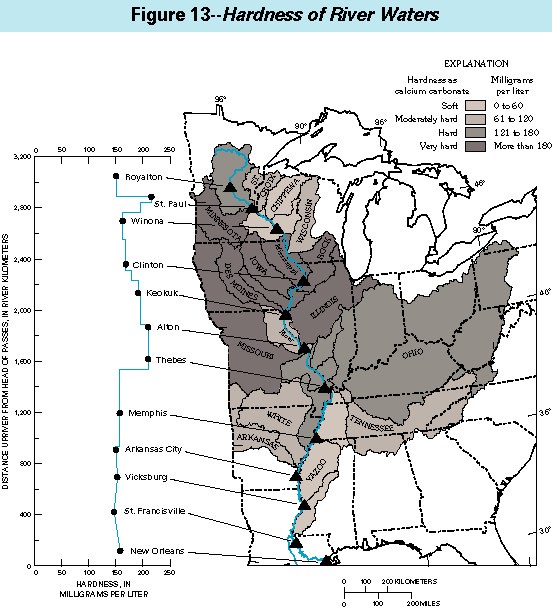
Figure 13. -- Both natural and human-influenced sources contribute chemicals to the dissolved solids of the Mississippi River. The chemicals can be separated into two groups based upon their electrical charge. The major positively charged chemical ions (cations) are calcium, magnesium, sodium, and potassium, and the major negatively charged chemical ions (anions) are bicarbonate, chloride, sulfate, and nitrate. The hardness of water increases as more calcium and magnesium ions are dissolved by tributary water flowing over naturally occurring rock sources in each river basin. Hardness is reported as the equivalent concentration of calcium carbonate in milligrams per liter. The value of hardness shown in the map for each basin is the median value in water samples collected at the gaging station closest to the mouth of the tributary. The graph on the left side of the figure shows the variation of the median hardness along the length of the Mississippi River for the period from 1970 through 1991. The water in the Mississippi River upstream from St. Paul, Minnesota, is hard (median value is 151 mg/L), but the water becomes very hard when it mixes with the very hard water of the Minnesota River (median value is 419 mg/L). The waters of the St. Croix, Chippewa, and Wisconsin Rivers are soft to moderately hard (median values range from 59 to 98 mg/L), and these tributaries again effectively dilute, downstream from St. Paul, Minnesota, the concentration of calcium and magnesium ions that determine the water hardness. In a pattern similar to that for dissolved solids, tributary inflows from the Rock, Iowa, Des Moines, Illinois, and Missouri Rivers increase the hardness of the Mississippi River downstream from Clinton, Iowa, in a series of steps to a maximum hardness of 208 mg/L (very hard) at Thebes, Illinois, just upstream from the confluence of the Mississippi and Ohio Rivers. The Ohio River, which is moderately hard (117 mg/L), decreases the hardness of the Mississippi River from very hard to hard. The water remains hard (140-154 mg/L) at gaging stations between the Mississippi-Ohio River confluence and New Orleans, Louisiana.
 (Click on image for a larger version, 116K)
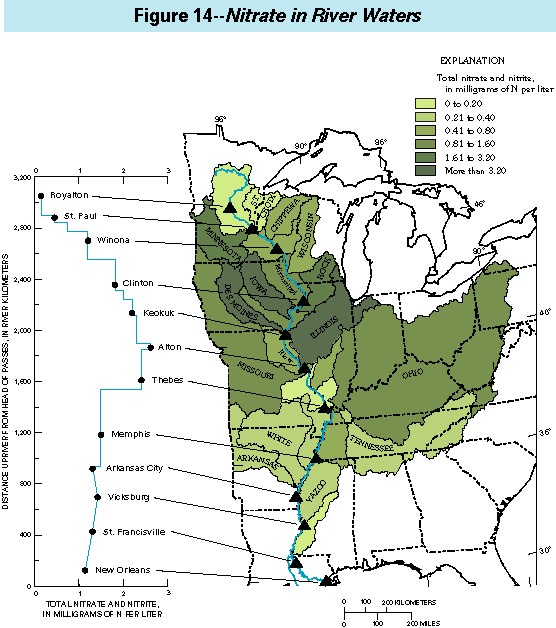
Figure 14. -- A wide range of human activities adds chemicals to rivers. The use of common salt, sodium chloride, to deice highways has contributed to the chloride concentration in rivers. Burning fossil fuels creates sulfur compounds that are major sources of sulfate for river water (Hem and others, 1990). In fact, the contribution of sulfur to rivers from anthropogenic sources may now be about one-half as much as from natural sources (Berner, 1971). Spreading fertilizers consisting of phosphate, nitrite, and nitrate compounds on cropland eventually adds to the total concentration of these chemicals in rivers as do other human activities such as the disposal of sewage effluents from metropolitan areas. Wastes from livestock production also add nitrogen compounds. The pattern of nitrate and nitrite concentration in the Mississippi River differs from the pattern for dissolved solids and hardness. The figure shows the combined nitrate and nitrite concentration (predominantly nitrate) in milligrams of nitrogen per liter. The value of nitrate and nitrite shown on the map for each basin is the median value in samples collected at the gaging station closest to the mouth of the tributary. The graph on the left side of the figure shows the variation of the median nitrate and nitrite concentrations along the length of the Mississippi River for the period from 1970 through 1991. Upstream from St. Paul, Minnesota, the median concentration of nitrate plus nitrite is 0.16 mg/L but then steadily increases step by step with each downstream addition of water from the Minnesota (2.8 mg/L), Rock (2.9 mg/L), Iowa (5.5 mg/L), Des Moines (3.7 mg/L), and Illinois (3.5 mg/L) Rivers. At Alton, Illinois, just upstream from the Mississippi-Missouri confluence near St. Louis, Missouri, the median concentration of nitrate and nitrite in the Mississippi River reaches a maximum of 2.6 mg/L. Downstream from Alton, the Missouri (1.1 mg/L) and Ohio Rivers (1.0 mg/L) successively dilute the nitrate and nitrite concentration so that it remains nearly constant at about 1.4 mg/L at gaging stations in the Lower Mississippi River. Although maximum concentrations for the Mississippi River have never exceeded the maximum contaminant level for drinking water of 10 mg/L, concentrations in several of the tributaries (Minnesota, Iowa, and Des Moines Rivers) in heavily farmed regions have exceeded the maximum contaminant level on occasion. Further details of nitrate and nitrite are discussed in the chapter, "Nutrients in the Mississippi River."
 (Click on image for a larger version, 116K)
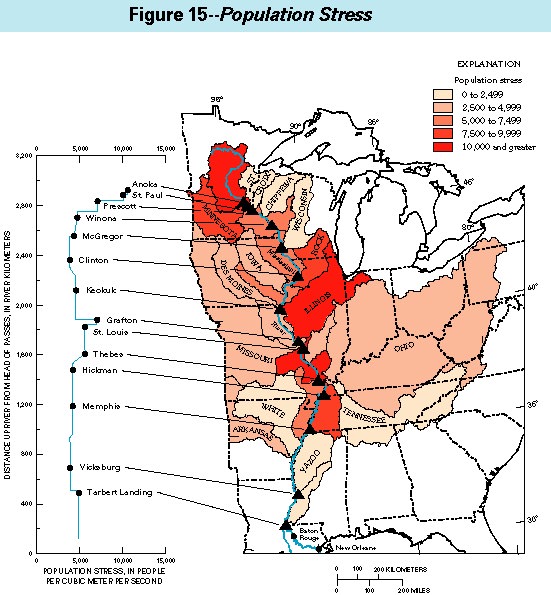
Figure 15. -- The concentrations of contaminants in the water represent stresses on the river system that depend upon the human population within a tributary basin and the capacity (as measured by the mean discharge) of the Mississippi River and its tributaries to reduce the concentration of contaminants by dilution. The population stress has been computed for 23 gaging stations in tributary basins and for 14 gaging stations on the Mississippi River as the ratio of the human population upstream from the gaging station to the mean discharge (in cubic meters per second) at each gaging station. The populations upstream from the gaging stations on the Mississippi River were taken from the 1990 census (U.S. Bureau of the Census, 1990). The mean water discharge is based on the period of record prior to 1989. The graph on the left side of the figure shows the variation of the population stress along the length of the Mississippi River. The dense population of St. Paul and Minneapolis, Minnesota, (about 3.2 million people) and the small water discharge (310 m3/s) combine to create a high population stress of about 10,000 people per cubic meter per second. This initial high population stress decreases as each downstream tributary adds more water to the Mississippi River, until at Keokuk, Iowa, it reaches a minimum of 4,600 people per cubic meter per second. It increases near St. Louis, Missouri, along the reach of the river downstream from the mouth of the Illinois River, which has the highest population stress of the tributary basins (14,600 people per cubic meter per second), caused by the population of the Chicago metropolitan area. Another increase on the main stem occurs along the reach of the river between Baton Rouge and New Orleans, Louisiana. The population stress suggests that within and downstream from these three reaches of the Mississippi River (Minneapolis-St. Paul, St. Louis, and Baton Rouge-New Orleans), one should expect increases in anthropogenic contaminants. The chapters that follow contain numerous examples of such increases.