Nitrate and nitrite at high concentrations are known to have toxic effects on humans. The U.S. Environmental Protection Agency (USEPA), mandated by Public Laws 89-753 (the Clean Water Restoration Act of 1966) and 92-500 (the Federal Water Pollution Control Act Amendments of 1972), has established drinking-water standards for both of these to protect public health (Sceery, 1992; U.S. Environmental Protec-tion Agency, 1991a, 1991b; table 5). If the concentration of nitrate or nitrite is high in the raw water supply (for example, the Mississippi River), the cost of treatment increases. Ammonia also is known to be toxic to aquatic organisms, and the USEPA also has established criteria for this compound in surface waters (U.S. Environmental Protection Agency, 1985, 1992). Maximum contaminant levels have not been established for orthophosphate.
Plant productivity caused by nutrients is another factor of concern. In lakes, nutrient enrichment almost always increases algal production, a condition known as cultural eutrophication. One effect of eutrophication is that an abundance of algae may cause taste and odor problems in drinking-water supplies. A second effect of eutrophication is the increased uptake of dissolved oxygen by bacteria in response to higher concentrations of organic matter. If oxygen is taken up by decaying organic matter faster than it is imported from the atmosphere or produced by photosynthesis, it becomes depleted, and the aquatic species that require it are adversely affected. Furthermore, oxygen depletion causes basic changes in the chemical environment that allow materials (including many metals) that were formerly precipitated or tied to the sediments to become soluble and, therefore, mobile.

(Click on image for a larger version, 66K)
Figure 30. -- Of four major nutrient compounds in the Mississippi River and its tributaries, only nitrate is found in concentrations approaching the U.S. Environmental Protection Agency (USEPA) maximum contaminant level (MCL). Orthophosphate usually is present in low concentrations, and concentrations of ammonium and nitrite usually are insignificant. The box plots show the medians and ranges of values determined in the Mississippi River main stem (Ml, M2) and in tributaries (Tl, T2). Values determined during 1991-92 are labeled Ml and T1 (see table 7 for a statistical summary of the data; see Antweiler and others, 1995, and Garbarino and others, 1995, for a detailed listing of the data), and those at monitoring stations of the U.S. Geological Survey's National Stream Quality Accounting Network (NASQAN) during 1979-91 are labeled M2 and T2.
The sources of nutrients in surface waters can be broadly divided as natural and anthropogenic (see table 6). Natural sources are generally ubiquitous; however, their contribution is usually low because, over the course of time, natural systems have established balances between the production and consumption of nutrients. Anthropogenic sources arise from many activities. In the agricultural setting of the Mississippi River drainage, farmers increase the productivity and yield of their crops by use of chemical fertilizers. If more fertilizers are applied than are used by the crops, they can move into ground and surface waters and become a major source of nutrients in rivers. Other major sources of nutrients in surface waters are domestic and animal wastes. Although municipal wastewater is treated, only a fraction of the nutrients is removed. In addition to the nutrients derived from human sewage, municipal wastewater also contains nutrients from such things as lawn fertilizers and household cleaners and detergents. Other anthropogenic sources of nutrients are industrial, either from the manufacture of fertilizers or as by-products of other manufacturing processes.
During the last 80 years, there has been a marked increase in the concentration of nitrate in the Lower Mississippi River that has been attributed to the increasing use of fertilizers (Turner and Rabalais, 1991). Before 1940, nitrate concentrations ranged from 0.2-0.4 milligram of nitrogen per liter (mg N/L); since 1940, they have ranged from 1.0-1.2 mg N/L. In the last 10 to 15 years, however, nitrate concentrations do not appear to have changed.
Time-series data collected at Baton Rouge and elsewhere were combined and integrated to estimate that the Mississippi River delivered about 900,000 metric tons of nitrate and 35,000 metric tons of orthophosphate to the Gulf of Mexico during the year, April 1991-April 1992. If we assume that all nitrate in the Mississippi River before 1940 originated from natural sources, the increase since 1940 provides a rough estimate that at least 75 percent of the nitrate in the Mississippi River today is anthropogenic in origin. Most of that 75 percent apparently comes from nonpoint agricultural sources. It is estimated that more than 5.5 million metric tons of nitrogen fertilizer were applied to cropland in the Mississippi River Basin in 1991 (U.S. Department of Agriculture, 1992; J.J. Fletcher, West Virginia University, unpubl. data,1992). The 900,000 metric tons of nitrate discharged by the Mississippi River into the Gulf of Mexico was therefore equivalent to about 16 percent of the nitrogen fertilizer applied to cropland in one year. In contrast, most of the ammonium that enters the Mississippi River probably originates from either industrial or municipal waste.
(Click on image for a larger version, 50K)
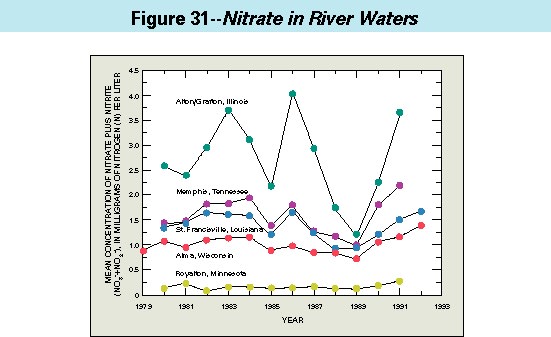
Figure 31. -- During the last decade and a half, there has been no significant change in the concentrations of nitrate and nitrite in the Mississippi River. Shown here are the yearly mean concentrations of nitrate plus nitrite at monitoring stations of the U.S. Geological Survey's National Stream Quality Accounting Network (NASQAN) on the Mississippi River. The lower four lines represent the upper river at Royalton, Minnesota (upriver of the Twin Cities), and Alma, Wisconsin (Lock and Dam 4), and the lower river at Memphis, Tennessee, and St. Francisville, Louisiana. The uppermost line shows considerably more scatter than the other four, which probably is related to variable inputs of nitrate from the Illinois River; the Illinois enters the Mississippi at Grafton (a few kilometers upriver of Alton), and it usually contains higher concentrations of nitrate than the other major tributaries of the Mississippi (see fig. 32).
(Click on image for a larger version, 99K)
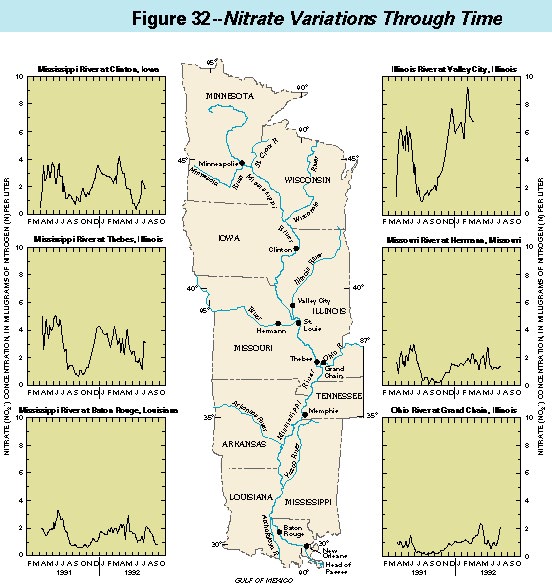
Figure 32. -- Nitrate concentrations in the Mississippi River and its tributaries vary seasonally, usually being higher in winter, spring, and early summer and lower in late summer and early autumn. The data shown in the graphs are from samples collected at weekly or biweekly intervals between March 1991 and September 1992 at six sites: three on the Mississippi River main stem and three in the lower reaches of principal tributaries. For a complete listing of the data, see Coupe and others (1995). The maximum contaminant level for nitrate in drinking water (10 milligrams of nitrogen per liter, a level that corresponds to the top of the graphs) was not exceeded in any of the samples collected at the six sites during the period shown here. The highest concentrations of nitrate were recorded in the Illinois River, which drains extensive agricultural areas and receives municipal wastes from Chicago and other cities.
The source of nitrite is more difficult to assess. Although there was probably a significant contribution from non-point sources, nitrite, like ammonium, was being removed by biotic utilization or conversion to nitrate, and hence this contribution was minimized.
To summarize: In terms of human health, nitrate is the only nutrient compound that represents a problem in the Mississippi River system; nitrate concentrations in many of the Mississippi River's tributaries in Iowa, Minnesota, and northern Illinois approach and occasionally exceed the USEPA drinking-water standard (table 5; see also Lucey and Goolsby, 1993). In addition to the public health question, nitrate represents an ecological problem as well. Because it is not removed quickly, nitrate is accumulating in the Gulf of Mexico; each year, the Mississippi delivers a large quantity (900,000 metric tons between April 1991 and April 1992) to the Gulf and therefore merits concern in terms of potential eutrophication. The largest sources of this nitrate are most likely fertilizers used in agriculture. Although the concentrations of nitrate in the Mississippi River have increased since the turn of the century, these levels have been virtually unchanged over the last 10 to 15 years. Hence, although nitrate concentrations may be high, they appear to have stabilized.

(Click on image for a larger version, 99K)
Figure 33. -- Ammonium concentrations generally are highest in winter (December through March) when river water temperatures are lowest. This pattern is not so much related to seasonal supplies of ammonium as it is to water temperatures. During the warmer months, ammonium is less persistent in oxygenated river water because it is more rapidly utilized by bacteria and algae or more rapidly oxidized to nitrate or nitrite. Data shown in the graphs are based on the same samples as the nitrate data shown in figure 32 (see Coupe and others, 1995, for a complete listing).
(Click on image for a larger version, 99K)
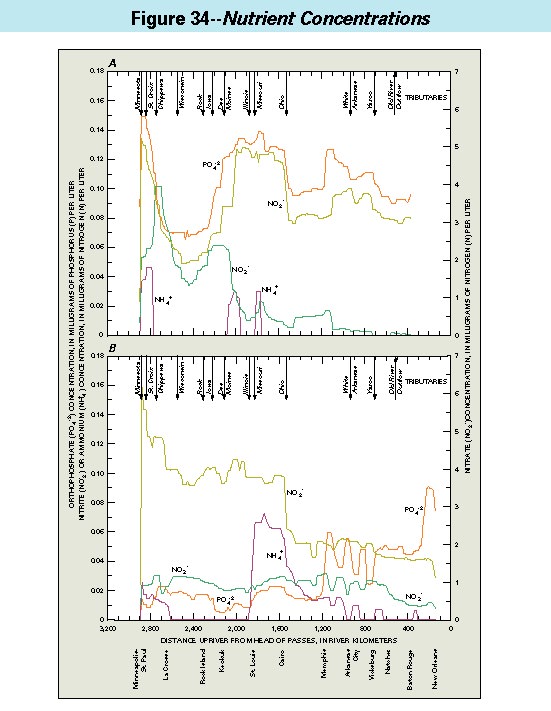
Figure 34. -- Spatial variations of nutrients along the length of the Mississippi River demonstrate the interplay between the input sources that increase their concentrations and the processes of dilution and decomposition that decrease their concentrations. Data shown here in A and B were collected during two upriver cruises (see "Sampling the Length of the River") wherein samples were taken approximately every 10 miles near the center of the river. Complete tabulations of the data are given by Antweiler and others (1995).
(Click on image for a larger version, 66K)
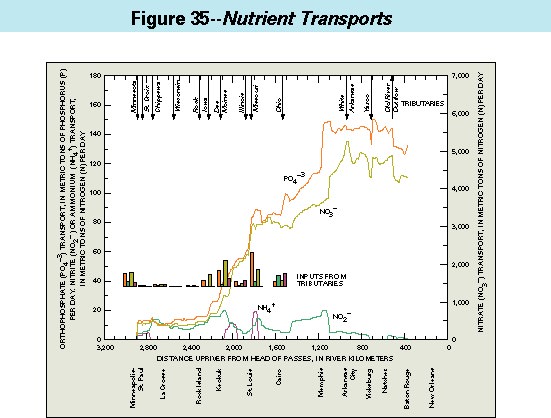
Figure 35. -- When nutrient data are graphed in terms of their fluxes or transports rather than their concentrations, they show that the transports of nitrate (NO3-) and orthophosphate (PO4-3) mostly increase downriver. This means that the processes that add nitrate and orthophosphate to the river are more prevalent than the processes that remove them. Transports of nitrite (NO2-) and ammonium (NH4+), on the other hand, generally decrease downriver because, in their cases, the removal mechanisms prevail. Shown here are the data from the upriver cruise of June 23-July 2, 1991: concentrations shown in figure 34A have been multiplied by water discharges to compute the downriver transports of dissolved nutrients in tons per day (1 metric ton = 1000 kg = 2205 pounds). Significant inputs from tributaries are shown by bars near the center of the graph; the individual nutrients are identified by bar colors which correspond to those of the curves. Concentrations of nitrate and orthophosphate showed parallel fluctuations during the sampling period. The initial loading to the Mississippi River from the Minnesota River represented the total transport of these two compounds for the next 600 km (to river kilometer 2250); this implies that over this distance, additions of nitrate and orthophosphate from tributaries and point sources were negligible, or that gains of these ions were balanced by their losses. From kilometer 2250 (near the confluence with the Iowa River) downriver to St. Louis (kilometer 1800), loads increased steadily from contributions from tributaries. The Iowa River at kilometer 2240, the Des Moines River at kilometer 2100, and the Missouri River at kilometer 1850 each added a large increment of nitrate and orthophosphate (see the bars in the middle of the graph). Because the Ohio River added relatively small amounts of nutrients, its effect can barely be distinguished on the graph. The large increases in the curves at about kilometer 1100 (south of Memphis, Tennessee) probably were caused by a storm event several weeks earlier in Iowa or Illinois, which flushed large quantities of these compounds into the river. The decreases in the curves at about kilometer 500 are caused by the Old River outflow, which removes substantial amounts of the water and dissolved nutrients from the Mississippi River. Ammonium (NH4+) loads were introduced into the river from point sources, most likely municipal wastes, and they decreased within relatively short distances downriver. Nitrite (NO2-) load behaved in a fashion somewhere between nitrate load and ammonium load: its points of introduction were generally not spikes, yet it clearly was being utilized or converted to other forms of nitrogen faster than it was being introduced--as reflected in the downriver decrease in nitrite load. Places where nitrite was introduced were not always related to entering tributaries; the sharp increase in nitrite load near river kilometer 2700 (Lake Pepin), for example, cannot be related to tributary inputs.
(Click on image for a larger version, 33K)
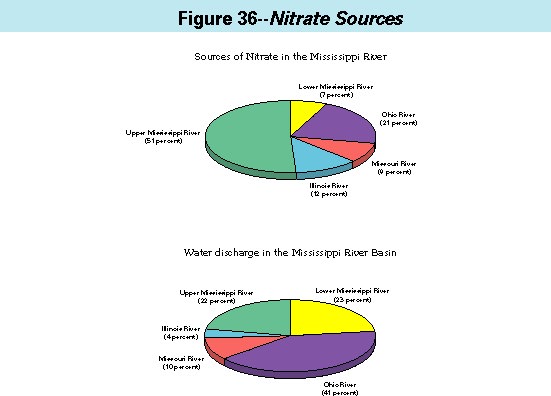
Figure 36. -- Disproportionately large quantities of the nitrate in the Mississippi River, on average, are derived from the upper-basin States of Minnesota, Iowa, and Illinois. Slightly more than one-half the total nitrate load in the system is derived from the Upper Mississippi River Basin, which supplies less than one-fourth of the total water. Conversely, the Ohio River supplies 41 percent of the total water, but only 21 percent of the total nitrate load. The Missouri River is the only major tributary whose nitrate load corresponds closely to its proportion of the water discharge.