Contaminants in the Mississippi River
U.S. GEOLOGICAL SURVEY CIRCULAR 1133
Reston, Virginia, 1995
Edited by Robert H. Meade
Organic Contamination of the Mississippi River from Municipal
and Industrial Wastewater
Larry B. Barber, II, Jerry A. Leenheer, Wilfred E. Pereira,
Ted I. Noyes, Greg K. Brown, Charles F. Tabor, and
Jeff H. Writer
Fate of Contaminants in the River

(Click on image for a larger version, 99K)
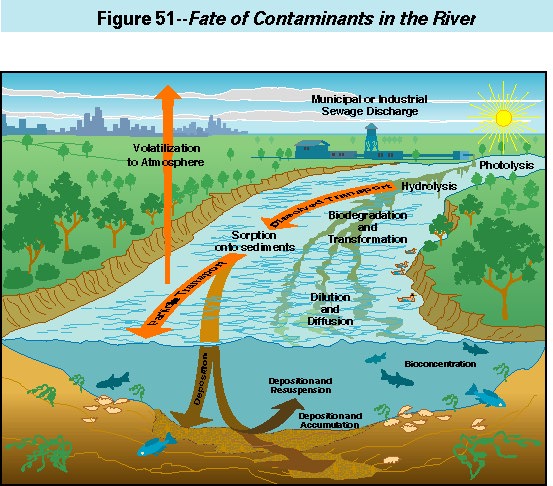
Figure 51. -- The most significant factors
controlling the concentrations of organic contaminants in rivers are
the physical processes of dispersion and dilution. Within this
physical framework, the most significant chemical and biological
processes controlling the fate of organic contaminants in the
Mississippi River are (1) sorption to the sediment and removal by
deposition, (2) desorption and diffusion of contaminants from bed
sediments back into the water, (3) biological transformation to
intermediate compounds, or biodegradation for complete removal, (4)
volatilization to the atmosphere, (5) bioconcentration and
magnification in the food chain, (6) photolysis, or the breakdown of
contaminants under the influence of sunlight, and (7) hydrolysis, or
the decomposition of contaminants by taking up the elements of water.
Organic compounds of the type called "hydrophobic" (meaning that they
prefer being sorbed onto sediment or organic particles to being
dissolved in water) can be adsorbed onto sediments in concentrations
that are a thousand to a million times greater than in the associated
water. Once they are sorbed, the contaminants can be deposited and
eventually become buried as sediments continue to accumulate. Buried
contaminants can be remobilized, however, by resuspension of the
sediments. Likewise, the sedimentary organic matter may decompose,
reintroducing its sorbed contaminants to the river by desorption and
diffusion of organic colloids. If the contaminants are sorbed onto
the sediments in high concentrations, they can adversely affect
bottom-dwelling organisms. The tendency of a contaminant to sorb onto
the sediment is frequently indicative of its capacity to
bioconcentrate and become magnified in the food chain.
Many organic contaminants are biodegraded in rivers. Readily
degradable compounds may have a biodegradation half-life (time for
one-half of the mass of a compound to be removed) in a river
environment of less than 1 day, depending on factors such as
temperature, population of bacteria, availability of oxygen, and
availability of nutrients. Other organic contaminants are resistant
to biodegradation and have half-lives on the order of years.
Compounds that are rapidly biodegraded under aerobic conditions, such
as those found in a flowing stream, may persist under the anaerobic
conditions that exist in buried sediments.
Some organic contaminants are volatile, and the major pathway for
their removal from water is transfer to the atmosphere. The rate of
volatilization is a function of the vapor pressure and water
solubility of the compound, water temperature, and amount of
turbulence in the water. A typical half-life for volatile organic
compounds is on the order of a few hours; thus, even high
concentrations can be rapidly attenuated in river systems.
All these processes---sorption, biodegradation, and volatilization, as
well as photolysis and hydrolysis---interact in complex ways in the
natural environment. For example, biotransformations can increase the
solubility of a hydrophobic organic contaminant, which results in less
sorption and greater mobility in the river. The Mississippi River is
dynamic, and the distribution of contaminants between air, water,
sediment, and organisms is continually changing with variations in the
chemical, hydrological, and climatic regimes. The transportation of
sediment-bound contaminants, for example, is episodic; most of the
transport occurs during periods of high flow and bed scouring.
Instream biodegradation rates usually decrease at lower temperatures.
Ice cover during cold weather decreases the importance of
volatilization as a removal pathway. High concentrations of dissolved
organic matter can affect sorption, biodegradation, and volatilization
of organic contaminants.
Introduction
The Mississippi River receives a variety of organic wastes, some of
which are detrimental to human health and aquatic organisms. Urban
areas, farms, factories, and individual households all contribute to
contamination of the Mississippi River by organic compounds. This
contamination is important because about 70 cities rely on the
Mississippi River as a source of drinking water. Considerable gains
have been made in the last two decades in controlling point-source
contamination, but control of nonpoint-source contamination has been
more difficult.
Among the topics that are discussed in this chapter and its figures
are (1) a comparison of the present-day water quality of the river
with historical trends, (2) the environmental processes controlling
the occurrence and fate of organic contaminants, (3) the distributions
and concentrations of organic contaminants in the water and sediments
along the entire length of the river, and (4) the seasonal variability
of some of the contamination patterns. Organic contaminants in the
Mississippi River were assessed by collecting water and sediment
samples between Minneapolis-St. Paul, Minnesota, and New Orleans,
Louisiana, during 10 sampling cruises conducted in 1987--92, and
analyzing the samples for the organic contaminants and indicator
compounds listed in table 10.
Trends in Water Quality: A Historical Perspective
The relation between water pollution and public health has been
recognized since the Colonial period, and increasing efforts have been
made during the last century in the field of water pollution control.
The earliest concerns with water pollution were about transmission of
pathogenic diseases, such as typhoid, and obstruction of waterways by
refuse from domestic and commercial sources. Anecdotal evidence from
early reports indicates that development of metropolitan areas along
the Mississippi River and its tributaries during the 1800s and early
1900s had a negative effect on water quality. The status of the
Mississippi River at Minneapolis-St. Paul is illustrated by the
following quotations:
"In 1888, the Engineers were called to remove a bar forming near the
St. Paul waterfront. Dredging discovered that this bar was formed
entirely of garbage dumped into the river by St. Paul. This area of
the river had been shoaling for several years; the Corps was called in
only when the smell became so objectionable that private citizens
obtained an injunction against the governments of Minneapolis and
St. Paul. Minneapolis dumped 500 tons of garbage a day just below the
Falls of St. Anthony, and St. Paul added even more than that." (Tweet,
1984, p. 125-126.)
"During the months of low flows recorded for June, July, and August
(1926), the pool above the High Dam was in a septic condition with the
ebullition of large quantities of gas at the surface. On many
occasions the surface of the pool was covered with sewage sleek, the
oily floating substances contained in sewage, and was highly
discolored for a considerable distance below the sewer outlets. Odors
were noticeable at times, but usually in the vicinity of the larger
sewer outlets. Below the High Dam septic conditions also prevailed in
the back water pools during the summer." (Wisconsin State Board of
Health, 1927, p. 310).
Gross contamination problems like these were gradually eliminated
during the mid-1900s, but less obvious problems caused the quality of
the Mississippi River to decline as population centers continued to
grow. After World War II, the synthetic-organic chemical industry
rapidly expanded and thousands of new chemicals eventually made their
way into natural waters. Beginning about 1950, investigations into
the occurrence of organic chemicals indicated that the Mississippi
River had been significantly degraded by organic contaminants. Since
the passing of pollution-control laws during the early 1970s, many of
the obvious and readily correctable sources of contamination from
industrial and municipal wastewater have been eliminated or
diminished. Improvements in sewage-treatment plants have improved the
water quality even though the population has continued to increase.
Municipal-and Industrial-Derived Wastewater: A Perspective on
Today
Municipal wastewater is the aggregate of all water used and disposed
of in a community. The mean per capita domestic wastewater flow rate
for the United States is 200--500 liters per person per day. The
synthetic-organic chemical composition of municipal wastewater is a
function of the various products consumed by individual households and
the contribution of industrial effluents. Sewage effluents also
contain a variety of natural organic chemicals from human waste and
food products, a variety of micro-organisms including bacteria and
viruses, and a variety of inorganic chemicals.
In many metropolitan areas, domestic and industrial wastes and
stormwater runoff are drained into a combined sewer. Combined-sewer
overflows can contribute high waste loads for short time periods, and
pollution loads vary as a function of discrete storm events.
Combined-sewer overflows vary in composition with the density of
population and the type of industry.
Municipal sewage and industrial wastewater are typically treated prior
to their discharge into surface waters. Most municipal wastewater is
treated by activated-sludge or trickling-filter methods that rely on
sorption and biodegradation to remove organic contaminants. Removal
efficiency for strongly sorbing, biologically labile, and volatile
organic compounds ranges from 25 percent for primary treatment, 80 to
98 percent for secondary treatment, and greater than 98 percent for
tertiary treatment. However, poorly sorbing and biologically
recalcitrant compounds are not completely removed even during tertiary
treatment. Depending on the type of treatment, removal of
micro-organisms varies from negligible to more than 95 percent.
After effluent is discharged into a river, dilution becomes a major
factor regulating the concentrations of dissolved chemicals. The
stream-dilution factor is a function of streamflow and effluent
discharge (stream-dilution factor = streamflow divided by cumulative
effluent discharge). Stream-dilution factors determined for
individual cities along the Mississippi River during this study
varied: about 50 for Minneapolis-St. Paul, 500 for St. Louis, and 1500
for New Orleans. Stream-dilution factors for many small cities along
the lower river were greater than 100,000. However, cumulative
stream-dilution factors, determined using the combined effluent
volumes for all upriver municipal discharges, including tributaries,
were relatively constant along the entire river and ranged from 25 to
50, indicating that 2 to 4 percent of the river volume is contributed
by municipal wastewater discharges.
Stream-dilution factors vary as a function of season and long-term
hydrological trends. For example, the Mississippi River discharges
that were sampled during this study varied by a factor of two in the
upper river and a factor of four in the lower river. Although
stream-dilution factors can exceed 100,000, some contaminants such as
fecal coliform bacteria can have concentrations up to millions of
bacteria per liter in treated sewage effluents; thus, even small
cities can contaminate the river with bacteria.
In addition to chemicals derived from domestic sources, municipal
effluents also have an industrial component that varies depending on
the type and number of industries present. For a given reach of the
river, it may not be possible to distinguish contaminants introduced
directly through onsite industrial discharges from contaminants
introduced by industry through municipal wastewater. Likewise, urban
runoff through storm sewers or from overland flow is a potential
source of chemicals that may be difficult to distinguish from treated
wastewater effluent. However, some synthetic-organic chemicals are
unique and can be traced directly to specific industrial
discharges.
Other significant sources of organic contamination along the
Mississippi River are powerplants and pulp mills. A typical power-
plant along the Upper Mississippi River uses about 6.6 cubic meters
per second (m3/s) of cooling water (Water Quality Work
Group of the Great River Environmental Action Team, 1980a), which
amounts to approximately 3 percent of the average Mississippi River
discharge at Minneapolis. Power- plants use a variety of chemicals in
their cooling water, including chlo-rine as a disinfectant to prevent
biofouling, and metal-complexing agents to prevent scale buildup.
Pulp mills also can discharge large quantities of wastewater. The
mean discharge for six pulp mills located along the Mississippi River
and its tributaries is about 1 m3/s (Costner and Thornton,
1989), which is equal to about 10 percent of the municipal discharge
for St. Louis. However, because of the high organic content of
pulp-mill effluents, their organic loading to the river can be
significant compared with municipal wastewaters. Pulp mills use a
wide variety of organic chemicals, and the bleaching process produces
significant amounts of chlorinated organic compounds. Another
important source of organic contaminants is the application of
agricultural chemicals such as fertilizers and pesticides. These
chemical formulations are complex and consist of both active and inert
ingredients. Many of the inert ingredients are solvents, surfactants,
and builders that also are common in domestic and industrial products.
Runoff from feedlots also contains high concentrations of organic
matter and fecal coliform.
Surfactants in the River

(Click on image for a larger version, 66K)
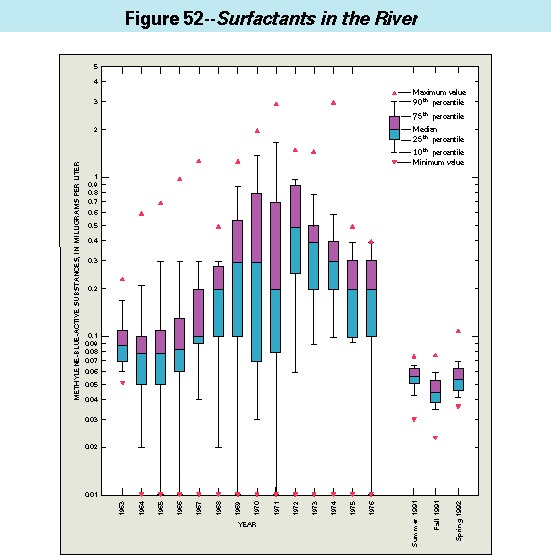
Figure 52. -- Anionic surfactants were studied in
river waters during the 1950s to 1970s because they caused extensive
foaming. Consequently, they have been measured for a long enough
period (since 1958 in the Mississippi River) to provide an example of
long-term trends in water quality. The foaming was the result of high
concentrations of branched-chained alkylbenzenesulfonates (ABS) that
were resistant to biological degradation during wastewater treatment
and residence in rivers. Concentrations were frequently above the
foaming threshold of about 0.5 milligram per liter (mg/L). Dilution
was the primary attenuation mechanism for ABS. To remedy the foaming
problem, the surfactant-manufacturing industry modified the chemical
structure of the molecule to a more biodegradable linear side chain
(LAS) which resulted in a significant decrease in concentrations
during wastewater treatment and residence in rivers (Swisher, 1964).
From 1959 to 1965, ABS concentrations in the Illinois River ranged
from 0.4 to 9 mg/L; from 1965 to 1966, ABS+LAS concentrations ranged
from about 0.2 to 0.3 mg/L (Sullivan and Evans, 1968; Sullivan and
Swisher, 1969). After 1968, LAS concentrations decreased to less than
0.1 mg/L even though surfactant consumption increased by more than 30
percent. This example shows that it is possible to reverse certain
pollution effects, in this case by the compulsory introduction of a
more biodegradable material.
The box plots in the figure show the average annual concentrations of
anionic surfactants (ABS plus LAS measured as methylene-blue-active
substances) for all available sampling sites along the Mississippi
River from 1963 to 1976 in the U.S. Environmental Protection Agency's
STORET data base. Although the switchover from ABS to LAS occurred
between 1964 and 1968, the concentrations of anionic surfactants in
the Mississippi River continued to rise until 1971 or 1972, probably
the result of increasing consumption rates and population density.
Following 1972, concentrations decreased to the levels observed today,
reflecting improvements in wastewater-treatment plants as the result
of the Federal Water Pollution Control Act of 1972, which required
secondary treatment of sewage effluents. The continued decrease of
surfactant concentrations is shown in data collected during 1991--92,
which are plotted on the right side of the graph.
Fecal Coliforms in the River
(Not Available)
Figure 53. -- Bacterial contamination of water is
commonly assessed by measuring fecal coliform bacteria, which are
present in untreated domestic sewage and animal wastes in extremely
large concentrations (1,000 to 100,000 organisms per milliliter;
American Public Health Association, 1992). The current maximum
contaminant level for whole-body-contact recreation for fecal coliform
bacteria is 200 organisms per 100 milliliter (mL). Coliform bacteria
have been measured at many sites on the Mississippi River from the
1920s to the present. Fecal coliform concentrations as great as
100,000 organisms per 100 mL that were measured in the river in
1925--26 resulted from untreated sewage inputs near
Minneapolis-St. Paul, Minnesota (Wisconsin State Board of Health,
1927). By the 1970s, improved wastewater treatment had greatly
decreased fecal coliform concentrations in most of the river although
high levels were still reported below Minneapolis-St. Paul and
St. Louis, Missouri (Water Quality Work Group of the Great River
Environmental Action Team, 1980a, 1980b). Fecal coliforms also are
derived from animal waste and feedlot runoff.
The box plots in the figure show fecal coliform concentrations along
the Mississippi River from 1982 to 1992 obtained from the
U.S. Environmental Protection Agency's STORET data base and the
U.S. Geological Survey's WATSTORE data base. Data for St. Louis from
the Illinois River Watch program and data from the current study for
1991--92 also are plotted in the figure. Median fecal coliform
concentrations exceeded the standard by a factor of 10 or more near
Guttenberg, Iowa, Rock Island, Illinois (Quad Cities), St. Louis and
Cape Girardeau, Missouri, and Memphis, Tennessee. The standard was
exceeded to a lesser extent at several other locations. Standards
also were exceeded in the Rock, Iowa, Des Moines, Missouri, and
Kaskaskia Rivers (data not shown in the figure). Although earlier
studies (Water Quality Work Group of the Great River Environmental
Action team, 1980a) showed the standards being exceeded near
Minneapolis-St. Paul, our measurements showed coliform counts in that
area that were lower than the standard, indicating efficient removal
during wastewater treatment. The fecal coliform contamination near
St. Louis during 1991--92 was consistent with data reported by the
Water Quality Work Group of the Great River Environmental Action Team
(1980b), and probably results from lack of chlorination of treated
sewage effluent in the metropolitan area.
Wastewater Contaminants Along the River

(Click on image for a larger version, 116K)
Figure 54. -- Distributions and concentrations of
dissolved organic contaminants along the length of the Mississippi
River are best viewed in the context of other physical and chemical
properties of the river water. During the three upriver cruises in
summer 1991, fall 1991, and spring 1992 (see "Sampling the Length of
the River"), samples were taken and measurements were made
near the center of the river approximately every 10 miles between New
Orleans and Minneapolis. On the left side of the figure are shown the
distributions of three "background" variables---temperature, specific
conductance, and dissolved organic carbon---to provide a context for
viewing the contaminant data. On the right side of the figure are
shown the distributions of three groups of dissolved organic
contaminants---surfactants (MBAS and LAS) and adsorbable organic
halogen (AOX). Complete tabulations of the data are given by Barber,
Leenheer, and others (1995).
-
A
-
During the upriver cruise of summer 1991, water temperatures were
fairly uniform along the length of the river and ranged from 22� to
27�C. By early fall 1991, the temperatures near Minneapolis had
decreased about 10� while temperatures near New Orleans remained at
summer levels; water temperature between Minneapolis and New Orleans
showed a regular increase in the downstream direction. By early
spring 1992, temperatures near Minneapolis were about 15�C lower
than the previous summer and they increased downstream. During the
winter (data not shown) water temperatures between Minneapolis and
LaCrosse, Wisconsin (kilometer 2660), were near 0�C. A major
influence of the various temperature regimes is their effect on rates
of instream biodegradation, which decreases with decreasing
temperature. The rate of volatilization also is affected by
temperature, and the presence of ice cover during the winter can
reduce the transfer of contaminants to the atmosphere.
-
B
-
Specific conductance is a measure of total inorganic dissolved solids,
and the profiles measured during the three upriver cruises of 1991--92
generally resemble the long-term average profile of total dissolved
solids in the Mississippi River shown in figure 12. Maximum values in
the upper river were measured immediately below the confluence of the
Minnesota River, which had the highest specific conductance of any
tributary. Specific conductance decreased downstream as the result of
dilution by low-conductivity tributaries such as the St. Croix,
Chippewa, Black, and Wisconsin Rivers. The reach between the Illinois
and Ohio Rivers (kilometers 1890 and 1530) had elevated specific
conductance, reflecting the input of high-conductivity water from the
Missouri River. Specific conductance decreased sharply as the
Mississippi River received the more dilute waters of the Ohio River,
and the lower river had relatively uniform values. There was little
seasonal variability in specific conductance of the upper river.
Seasonal variability in the reach between the Illinois and Ohio Rivers
was controlled by the relative discharge from the Missouri River.
Seasonal variability in the lower river was related to discharge, with
the highest values recorded during low flow during the fall. Several
spikes in the profiles were probably the results of point-source
inputs and hydrological events that occurred upstream.
-
C
-
Dissolved organic carbon (DOC) is a measure of the total dissolved
organic matter in the Mississippi River, most of which is natural.
Wastewaters are only minor contributors of DOC. The most obvious
features of the DOC profiles shown in the figure were the high
concentrations in the upper river that decrease downstream, the sharp
decreases in concentration below the Ohio River, and the relatively
uniform concentrations (about 4 mg/L) in the lower river. There were
distinct seasonal differences in DOC concentrations in the upper
river; seasonal differences in the lower river were much less
pronounced. DOC has important geochemical implications for the
occurrence and fate of organic contaminants because it can (1)
increase the solubility and facilitate the transport of organic
contaminants, (2) alter rates of biodegradation, (3) form complexes
with trace metals, and (4) react during water treatment to produce
potentially toxic by-products (see next chapter).
-
D
-
Surfactants are major ingredients of soaps and detergents, and their
presence is an indication of the effect of domestic wastewater on the
water quality of the Mississippi River. Total anionic surfactants
were determined as methylene-blue-active substances (MBAS), which is a
composite measurement of linear alkylbenzenesulfonate (LAS), LAS
biological metabolites and impurities, other synthetic-anionic
surfactants, and naturally occurring compounds such as humic
substances. The graph shows that during the upriver cruises of
1991--92, MBAS were present throughout the Mississippi River and its
tributaries at concentrations ranging from about 20 �g/L to 100
�g/L, values that are below the drinking-water standard of 500
�g/L. The MBAS profiles showed some of the same general trends as
specific conductance and DOC, including values in the upper river that
were slightly larger than those in the lower river. The greater
variability and scatter in the MBAS data indicate the effects of
multiple point-source inputs from municipal wastewater discharges.
MBAS concentrations had peaks in the vicinity of major cities and
decreased rapidly downstream because of dilution, biodegradation, and
sorption to the sediments.
-
E
-
Specific measurements for linear alkylbenzenesulfonate (LAS) were not
strongly correlated with MBAS, and many of the samples with elevated
MBAS had low levels of LAS. The annual consumption of LAS in the
United States is about 300,000 metric tons per year (Schirber, 1989).
LAS is readily biodegraded under aerobic conditions to form
intermediate compounds and ultimately carbon dioxide, water, and
sulfate (Swisher, 1987). Although LAS and its byproducts are nontoxic
to humans, aquatic organisms can be sensitive to concentrations
ranging from 10 to 1000 �g/L (Kimerle and Swisher, 1977; Kimerle,
1989). Measurable LAS concentrations in the Mississippi River were
found near Minneapolis, St. Louis, and New Orleans. However, LAS
concentrations drop below detectable levels within 80 km downstream
from the major sources as the result of dilution and instream
biodegradation. The St. Louis area has a stream-dilution factor
(river discharge divided by municipal effluent discharge) of about
500, but has the highest LAS concentrations along the river. In
contrast, the stream-dilution factor for Minneapolis is about 50 and
concentrations are very low. The stream-dilution factor for New
Orleans is about 1500, and concentrations are similar to those below
Minneapolis-St. Paul.
-
F
-
Adsorbable organic halogen (AOX) is a measure of dissolved chlorinated
organic matter, including both volatile and nonvolatile compounds,
some of which may be toxic. These compounds are difficult to measure
individually, so the AOX measurement serves as an overall index of
their combined effect on water quality. AOX comes from a variety of
sources, in particular, the chlorination of natural organic matter
during disinfection of sewage effluents, biofouling control in
powerplant cooling waters, pulp-wood bleaching, and other industrial
discharges. There also are significant natural sources of AOX. The
graph shows AOX profiles for the three upriver cruises of 1991--92.
Although concentrations and distributions varied significantly along
the river and among cruises, spatial trends relative to river reach
were not as apparent as for other constituents. The greatest
concentrations occurred during the spring and may have been the result
of flushing natural and atmospherically transported AOX from the soils
or increased anthropogenic sources during spring runoff events. The
multiple spikes during the spring and fall probably represent sporadic
inputs from point sources. The concentrations of AOX in the
Mississippi River exceeded those that would be expected from discharge
of treated municipal sewage effluent, indicating that other sources
such as pulp mills and powerplants also contribute AOX. For example,
a single pulp mill can contribute 840 kilograms (kg) per day of AOX
(Costner and Thornton, 1989) which is 5--10 percent of the total
Mississippi River AOX load near the confluence with the Ohio River. A
typical powerplant can contribute a daily load of 600 kg per day
(Water Quality Work Group of the Great River Environmental Action
Team, 1980a). In contrast, the municipal-treated sewage discharge
from St. Louis contributes an average of about 250 kg of AOX per
day.
Wastewater Contaminants in Bed Sediments

(Click on image for a larger version, 83K)
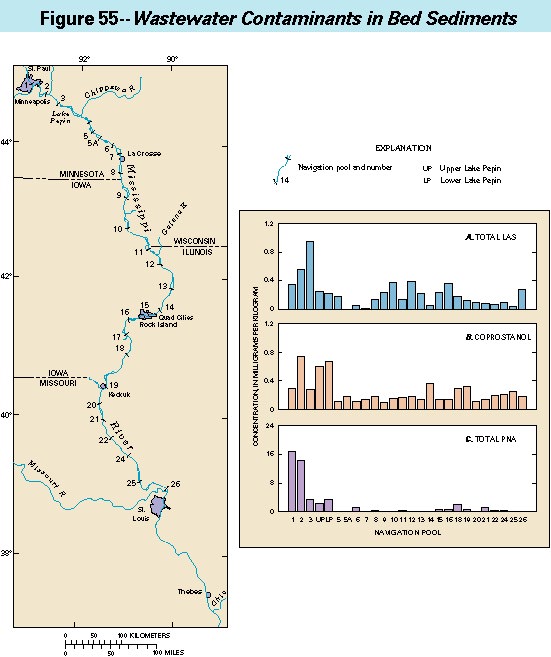
Figure 55. -- The sediments deposited and stored in
the navigation pools of the Upper Mississippi River are contaminated
with organic pollutants derived from municipal and other sources.
Data in these three graphs are from samples of bed sediment collected
during 1991--92 from the shallow areas of the navigation pools.
Additional samples were collected from the shallow backwater areas of
the unimpounded river at St. Louis and at Thebes, Illinois, 215 km
downriver of St. Louis. Complete tabulations of the data are given in
the reports by Writer (1992), Tabor (1993), Barber, Writer, and others
(1995), and Writer and others (1995).
-
A
-
Linear alkylbenzenesulfonate (LAS) is found in soaps and detergents,
and its presence in river- bottom sediments indicates contamination by
domestic and municipal wastes. The concentrations of LAS on bed
sediments (about 0.1 to 1 milligram per kilogram (mg/kg) of sediment)
are one to three orders of magnitude greater than those detected in
the overlying water (0.00005 to 0.012 milligrams per liter (mg/L) of
water). The data in the graph show a pattern that can be attributed
to inputs from cities such as Minneapolis-St. Paul, LaCrosse, and Rock
Island. Biodegradation removes LAS from the sediment---at rates that
apparently are variable enough to complicate patterns of high and low
concentrations attributed to local sources.
-
B
-
Coprostanol is a fecal sterol that comes from human and livestock
wastes. A properly operating wastewater-treatment plant will remove
95--99 percent of the coprostanol, resulting in concentrations ranging
from 30 to 50 micrograms per liter (�g/L) in sewage effluents and
from 1,400 to 7,900 mg/kg in sewage sludge (Walker and others, 1982).
Between 85 and 95 percent of the coprostanol discharged in sewage
effluents is associated with particulate matter that can be
assimilated into bed sediments (Venkatesan and Kaplan, 1990). Data in
the figure show that coprostanol concentrations ranged from 0.09 to
about 0.8 mg/kg.
Concentrations in excess of 0.1 mg/kg indicate sewage contamination
(Hatcher and McGillivary, 1979). Coprostanol is biodegraded more
slowly than LAS, and its distribution in the upper river can be
explained in terms of sources and sinks. Obvious sources of
coprostanol are Minneapolis-St. Paul (Pool 2). Sites for the
accumulation and storage of coprostanol-bearing sediments are the two
largest pools in the upper river (Lake Pepin and Pool 19). During
moderate to large flows, the sediments are likely to be swept out of
the smaller shallower pools of the upper river and deposited in the
larger deeper pools.
-
C
-
Polynuclear aromatic hydrocarbons (PNAs) are organic compounds that
are common contaminants in sediments, several of which are
sufficiently toxic to be listed as priority pollutants by the
U.S. Environmental Protection Agency. The sources of PNAs are
complex, but they typically come from combustion processes. Urban
runoff, municipal-wastewater discharges, wood-treatment facilities,
petroleum development and processing, coal-storage facilities, and
transportation networks (both land and river) all contribute PNAs to
the Mississippi River. PNAs detected on the bed sediments include the
priority pollutants naphthalene, acenaphthene, acenaphthylene,
fluorene, phenanthrene, fluoranthene, anthracene, chrysene, pyrene,
benzo[b]fluoranthene, and benzo[k]fluoranthene. Concentrations of
individual compounds ranged from less than 0.2 to about 10 mg/kg.
Although only the elevated concentrations at Minneapolis-St. Paul
(Pools 1 and 2) are clearly attributable to municipal sources, many of
the PNAs detected in the other samples probably come from wastewater
discharge and urban runoff.
Caffeine and EDTA in River Waters

(Click on image for a larger version, 83K)
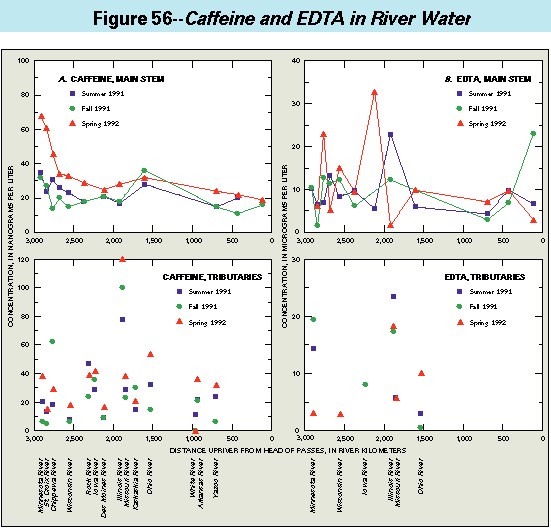
Figure 56. -- Caffeine and EDTA
(ethylenediaminetetraacetic acid) are two of the more ubiquitous
dissolved organic compounds in the Mississippi River. Neither
compound is highly toxic to humans, but each is a specific indicator
of contamination by wastewaters.
-
A
-
Caffeine is a stimulant chemical in beverages such as coffee and soft
drinks and in a variety of food products. Its concentrations in
municipal wastewaters range from 20--300 �g/L (Rogers and others,
1986). The graphs show the concentrations of caffeine measured in the
Mississippi River and its tributaries during the three downriver
sampling cruises of 1991--92 (a complete tabulation of data is given
by Pereira and others, 1995). Caffeine is a fairly specific tracer of
domestic wastewaters, and its profile illustrates the effect of
population density on water quality. The concentration gradient
between river kilometers 2950 and 2600 shows inputs from
Minneapolis-St. Paul into the relatively small upper river and the
progressive dilution downstream by the Minnesota and St. Croix Rivers.
The elevated concentrations of caffeine in the Illinois River are from
the large population in the Chicago metropolitan area, and the abrupt
increase in the Mississippi River near river kilometer 1850 is the
result of input from the Illinois River. The gradual downstream
decreases in caffeine concentrations in the river indicate instream
degradation through biotic and abiotic processes in addition to
dilution by tributaries. Caffeine occurs at similar concentrations to
EDTA in sewage effluents, but it occurs at much lower concentrations
in river water because of degradation and because it is not supplied
by the industrial sources that also introduce EDTA.
-
B
-
EDTA is used to form water-soluble complexes with insoluble metals in
a wide variety of domestic and industrial applications, including
stabilization of bleaching agents in laundry detergents, prevention of
boiler scale formation in powerplants, addition as a preservative and
clarifying agent in foods and beverages, use in fertilizers as a
source of chelated metal micronutrients, and other applications in the
metal-plating, photography, paper, and textile industries. The 1990
United States production of EDTA was 49,687 metric tons
(U.S. International Trade Commission, 1990). EDTA is an indicator of
total domestic and industrial wastewater inputs. EDTA has low
toxicity to humans and aquatic organisms. The chief water-quality
concerns are its ability to mobilize toxic metals from sediments and
to stimulate algal growth by increasing the availability of nutrients
such as iron and zinc. EDTA is not biologically degraded during
wastewater treatment, but various EDTA salts and metal complexes have
been observed to degrade in light (Alder and others, 1990). As a
consequence of the lack of biodegradation, its high solubility in
water, and large rates of production and usage, EDTA can be one of the
most abundant organic contaminants in surface waters. The graphs show
EDTA concentrations measured in the Mississippi River and four
principal tributaries during the three downriver sampling cruises of
1991--92 (L.B. Barber, II, unpub. data, 1995). Concentrations were
greater in the upper river than the lower river, and the peak
concentrations occurred between kilometers 2250 and 1900 (between
Dubuque and Keokuk, Iowa). The EDTA concentrations measured in the
river were about five times greater than the concentrations that can
be attributed to inputs of secondary treated municipal wastewaters.
It is likely therefore that discharges from powerplants and other
industrial sources contribute significantly to EDTA concentrations.
The greatest tributary EDTA concentration was from the Illinois River,
which probably reflects industrial and domestic wastewater inputs from
the Chicago metropolitan area. In general, EDTA concentrations in the
Mississippi River were lower than those reported for German rivers,
which typically range from 10 to 60 �g/L (Frimmel and others,
1989).
Summary
A summary of the major organic contaminants identified, their range of
concentrations, their water-quality criteria, and their environmental fate
is presented in table 11. Fecal coliform bacteria was the only contaminant
that exceeded health limits. Although concentrations of most organic
compounds measured in this study were below regulatory limits, their
distributions indicate that the entire Mississippi River has been
contaminated by point and nonpoint sources. Significant sources of organic
contaminants include municipal-wastewater discharge, urban runoff,
power-plant cooling-water discharges, pulp-mill effluents, feedlot runoff,
commercial and recreational river traffic and refueling, discharges from
industrial facilities, and agricultural runoff.
The Mississippi River carries higher concentrations of organic
contaminants in the vicinity of major metropolitan areas.
Concentrations are typically greatest in the upper river where the
stream- dilution factors are lowest. Major tributaries such as the
Minnesota, Illinois, Missouri, and Ohio Rivers have significant
effects on the organic chemistry of the Mississippi River. Seasonal
differences are related to hydrologic, climatic, biological, and
geochemical factors. Concentrations are greatest during periods of
low flow (fall) and least during periods of high flow (spring).
Likewise, concentrations of biologically labile and volatile organic
compounds are greatestduring the winter when temperatures are
lowest.
Although the data presented here provide only a brief glimpse of the
water quality of the Mississippi River, comparisons with historical
data show trends of improving water quality for several constituents.
The improvements can be related to: (1) changes made by the chemical
manufacturing industry to address the environmental fate of
problematic chemicals, and (2) improved wastewater treatment by
municipal and industrial dischargers. Converting primary treatment
facilities to secondary treatment has resulted in improved water
quality, although chemicals that are not completely removed present a
challenge for treatment technology.
Much remains to be learned about the sources, fates, and effects of
organic contaminants on human health and aquatic ecology. The data
presented in the figures for this chapter and in the detailed reports
of supporting data (Barber, Leenheer, and others, 1995; Barber,
Writer, and others, 1995; Leenheer, Noyes, and Brown, 1995; Leenheer,
Barber, and others, 1995; Pereira and others, 1995) represent a
benchmark for future reference. They indicate critical areas where
research is needed to more clearly define potential problems, and
provide a baseline against which future changes in the water quality
in the Mississippi River can be measured.
TTT and Flame Retardants in River Waters

(Click on image for a larger version, 83K)
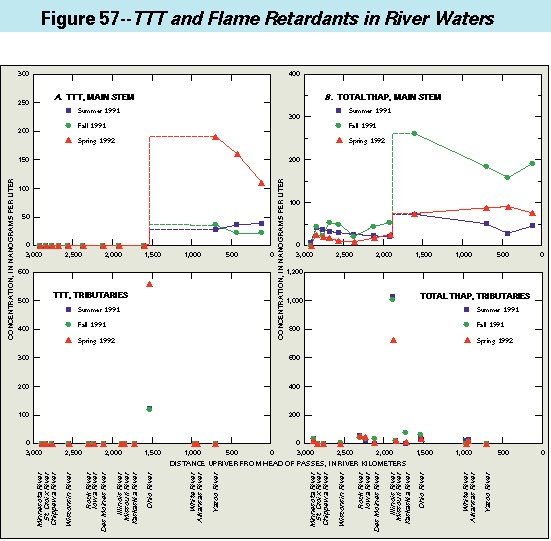
Figure 57. -- Some of the organic contaminants that
are dissolved in the waters of the Mississippi River can be traced to
unique sources. Two of these are TTT, an industrial by-product
primarily contributed from the Kanawha River Valley of West Virginia,
and flame retardant additives contributed almost exclusively from the
Illinois River watershed. Because their sources are so restricted,
these compounds can be used as tracers of the waters of their source
tributaries as they mix with the other waters that make up the
Mississippi River. Samples portrayed in the graphs were collected
during the downriver cruises of 1987--92; complete tabulations of the
data are given by Pereira and others (1995).
-
A
-
TTT (1,3,5-trimethyl-2,4,6-triazinetrione) is a by-product of the
manufacture of methylisocyanate. TTT has been reported in residual
materials from a tank after the leak of methylisocyanate in Bhopal,
India (D'Silva and others, 1986), in secondary effluent from a
municipal and industrial wastewater-treatment plant in Illinois (Ellis
and others, 1982), and in water from the Ohio River where it continues
to be detected at 1--2 �g/L (Don Mackell, Louisville Water Company,
Louisville, Kentucky, written commun., 1989). During the sampling
cruises of 1987--92, the Ohio River was the major contributor of TTT
to the Mississippi River, and the source was eventually traced to a
location on the Kanawha River where methylisocyanate is manufactured
and transported. TTT is a very stable compound and was detected in
all water samples collected from the Mississippi River between the
Ohio River and the Gulf of Mexico, indicating little or no degradation
during 2300 kilometers of river transport.
-
B
-
THAP (trihaloalkylphosphates) are used as flame-retardant additives in
flexible and rigid polyurethane foams, and in textiles. THAP are
relatively water-soluble compounds that have low bioconcentration
factors and short half-lives in fish. THAP have been reported in
municipal water supplies of cities adjoining the Great Lakes in Canada
(Williams and others, 1982; Williams and Le Bel, 1981), in surface
waters of Japan (Japan Environmental Agency, 1977--79), and in surface
water, ground water, and drinking water in Italy (Galassi and Guzella,
1988).
The graphs show the concentrations of total THAP (sum of
tris-2-chloroethylphosphate and two isomers of
tris-2-chloropropylphosphate), that were detected in all water samples
collected from the Mississippi River and its tributaries during the
downriver sampling cruises of 1987--92. In addition to minor sources
of THAP along the Mississippi River, there is a major source on the
Illinois River. THAP are relatively stable and degrade only slightly
during transport from St. Louis to the Gulf of Mexico, a distance of
about 1850 kilometers.
Volatile Contaminants in the River

(Click on image for a larger version, 66K)
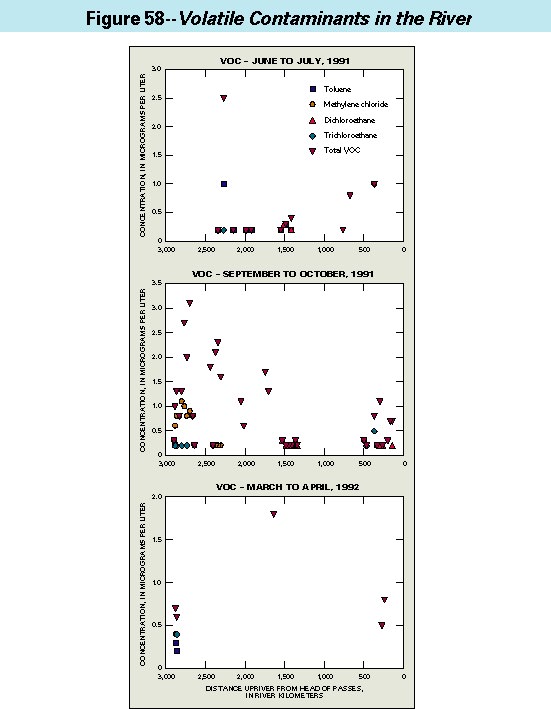
Figure 58. -- Volatile organic compounds (VOC)
appear to be short lived in the Mississippi River, as would seem to be
self-evident from the fact that the compounds are called "volatile."
However, considerable effort was spent in testing the waters of the
Mississippi River for their presence because (1) there are degrees of
volatility and (2) some of the compounds are highly toxic. Sources of
volatile organic compounds are industrial, municipal, and
transportational (urban runoff and river traffic).
The graphs show several of the volatile organic compounds that were
detected in significant concentrations in the midriver samples
collected during the three upriver cruises of 1991--92. Of the 64
target compounds, for which 440 samples were analyzed, 32 were
detected and only 19 occurred in more than 1 percent of the samples.
Concentrations of total VOC ranged from 0.2 to 3.1 �g/L and were
typically an order of magnitude below maximum contaminant levels.
There was a seasonal trend in volatile compound concentrations; the
greatest frequency of detections and highest concentrations occurred
during the fall and winter. During the winter (data not shown in the
graphs) concentrations increase significantly in the reaches of the
river that become ice covered. The areas with the most significant
contamination by volatile organic compounds were the reach downstream
from Minneapolis-St. Paul, the reach downstream from the confluence of
the Ohio and Mississippi Rivers, and the reach between Baton Rouge and
New Orleans.
SELECTED REFERENCES
- Alder, A.C., Siegriest, H., Gujer, W., and Giger, W., 1990,
-
Behavior of NTA and EDTA in biological wastewater treatment: Water
Research, v. 24, p. 733--742.
- American Public Health Association, 1992,
- Standard methods for the
examination of water and wastewater, 18th ed.: Washington, D.C.,
American Public Health Association, p. 9--60.
- Barber, L.B., II, Leenheer, J.A., Tabor, C.F., Brown, G.K., Noyes,
T.I., and Noriega, M.C., 1995,
- Organic compounds and sewage-derived
contaminants, in Moody, J.A., ed., Chemical data for water
samples collected during four upriver cruises on the Mississippi River
between New Orleans, Louisiana, and Minneapolis, Minnesota, May
1990-April 1992: U.S. Geological Survey Open-File Report 94-523,
p. 211--297.
- Barber, L.B., II, Writer, J.H., Tabor, C.F., and Leenheer, J.A., 1995,
-
Sterols, polynuclear aromatic hydrocarbons, and linear alkylbenzene
sulfonates, in Moody, J.A., ed., Hydrologic, sedimentologic,
and chemical data describing surficial bed sediments and water in the
navigation pools of the Upper Mississippi River, July 1991-April 1992:
U.S. Geological Survey Open-File Report 95-708.
- Costner, Pat, and Thornton, Joe, 1989,
- We all live downstream---The
Mississippi River and the national toxics crisis: Washington, D.C.,
Greenpeace USA, 120 p., 1 app. (61 p.).
- Curtis, M.W., and Ward, C.H., 1981,
- Aquatic toxicity of forty
industrial chemicals---Testing in support of hazardous substance spill
prevention regulation: Journal of Hydrology, v. 51, p. 359--367.
- D'Silva, T.D.J., Lopes, A., Jones, R.L., Singhawangcha, S., and Chan,
J.K., 1986,
- Studies of methylisocyanate chemistry in the Bhopal
incident: Journal of Organic Chemistry, v. 51, p. 3781--3788.
- Dufour, A.P., 1984,
- Health effects criteria for fresh recreation
waters: Research Triangle Park, N.C., U.S. Environmental Protection
Agency, EPA-600 11-84-004, 33 p.
- Ellis, D.D., Jone, C.M., Larson, R.A., and Schaeffer, D.J., 1982,
-
Organic constituents of mutagenic secondary effluents from wastewater
treatment plants: Archives of Environmental Contamination and
Toxicology, v. 11, p. 373--382.
- Frimmel, F.H., Grenz, R., Kordik, E., and Dietz, F., 1989,
-
Nitrilotriacetate (NTA) and ethylenedinitrilotetraacetate (EDTA) in
rivers of the Federal Republic of Germany: Vom Wasser, v. 72,
p. 175--184.
- Galassi, S., and Guzella, L., 1988,
- Organic phosphates in surface,
ground, and drinking water, in Angeletti, G., and Bjorseth,
A., eds., Organic micropollutants in the aquatic environment,
Proceedings of the 5th European Symposium, Rome, Italy, Oct. 20--22,
1987: Boston, Mass., Kluwer Academic, p. 108--115.
- Hatcher, J.P., and McGillivary, P.A., 1979,
- Sewage contamination in
the New York Bight---Coprostanol as an indicator: Environmental
Science and Technology, v. 13, p. 1225--1229.
- Japan Environmental Agency, 1977, 1978, 1979,
- Environmental Survey
Reports: Office of Health Studies, Department of Environmental
Health.
- Kimerle, R.A., 1989,
- Aquatic and terrestrial ecotoxicology of linear
alkylbenzene sulfonate: Tenside, Surfactants, Detergents, v. 26,
p. 169--176.
- Kimerle, R.A., and Swisher, R.D., 1977,
- Reduction of aquatic toxicity
of linear alkylbenzene sulfonate (LAS) by biodegradation: Water
Research, v. 11, p. 31--37.
- Leenheer, J.A., Noyes, T.I., and Brown, P.A., 1995,
- Data on natural
organic substances in dissolved, colloidal, suspended-silt and -clay,
and bed-sediment phases in the Mississippi River and some of its
tributaries, 1987--90: U.S. Geological Survey Water-Resources
Investigations Report 93-4204, 71 p.
- Leenheer, J.A., Barber, L.B., II, Rostad, C.E., and Noyes, T.I., 1995,
-
Data on natural organic substances in dissolved, colloidal,
suspended-silt and -clay, and bed-sediment phases in the Mississippi
River and some of its tributaries, 1991--92: U.S. Geological Survey
Water-Resources Investigations Report 94-4191, 47 p.
- Leenheer, J.A., Wershaw, R.L., Brown, P.A., and Noyes, T.I., 1991,
-
Detection of poly(ethylene glycol) residues from nonionic surfactants
in surface water by 1H and 13C nuclear magnetic
resonance spectrometry: Environmental Science and Technology, v. 25,
p. 161--168.
- McLeese, D.W., Zitko, V., Sergeant, D.B., Burridge, L., and Metcalfe,
C.D., 1981,
- Lethality and accumulation of alkylphenols in aquatic
fauna: Chemosphere, v. 10, p. 723--730.
- Patoczka, J., and Pulliam, G.W., 1990,
- Biodegradation and secondary
effluent toxicity of ethoxylated surfactants: Water Research, v. 24,
p. 965--972.
- Pereira, W.E., Moody, J.A., Hostettler, F.D., Rostad, C.E., and
Leiker, T.J., 1995,
- Concentrations and mass transport of pesticides
and organic contaminants in the Mississippi River and some of its
tributaries, 1987--89 and 1991--92: U.S. Geological Survey Open-File
Report 94-376, 169 p.
- Persaud, D., Jaagumagi, R., and Hayton, A., 1993,
- Guidelines for the
protection and management of aquatic sediment quality in Ontario:
Water Resources Branch, Ontario Ministry of the Environment and
Energy.
- Pontius, F.W., 1993,
- D-DBP rule to set tight standards: American Water
Works Association Journal, v. 85, p. 23--30.
- Rogers, I.H., Birtwell, I.K., and Kruzynski, G.M., 1986,
- Organic
extractables in municipal wastewater, Vancouver, British Columbia:
Canadian Journal Water Pollution Research, v. 21, p. 187--204.
- Schirber, C.A., 1989,
- LAS and AEs: Soap/Cosmetics/Chemical
Specialties, April, p. 32--36.
- Sullivan, W.T., and Evans, R.L., 1968,
- Major U.S. river reflects
surfactant changes: Environmental Science and Technology, v. 2,
p. 194--200.
- Sullivan, W.T., and Swisher, R.D., 1969,
- MBAS and LAS surfactants in
the Illinois River, 1968: Environmental Science and Technology, v. 3,
p. 481--483.
- Swisher, R.D., 1964,
- LAS---Major development in detergents: Chemical
Engineering Progress, v. 60, p. 41--45.
- ___ 1987, Surfactant biodegradation, 2d ed.: New York, Marcel Dekker,
1085 p.
- Tabor, C.F., Jr., 1993,
- The occurrence and fate of linear alkylbenzene
sulfonate in the Mississippi River---A molecular indicator of sewage
contamination: Boulder, University of Colorado, M.S. thesis, 78 p.
- Tabor, C.F., and Barber, L.B., II, 1996,
- Fate of linear alkylbenzene
sulfonate in the Mississippi River: Environmental Science and
Technology, v. 30, no. 1.
- Tweet, Roald, 1984,
- A history of the Rock Island District, U.S. Army
Corps of Engineers, 1866--1983: U.S. Army Engineer District, Rock
Island, Illinois, 441 p.
- U.S. Environmental Protection Agency, 1987,
- National primary drinking
water regulations---Synthetic organic chemicals---Monitoring for
unregulated contaminants; Final rule: Federal Register, v. 52,
p. 25690--25717.
- ___ 1994,
- Drinking Water Regulations and Health Advisories:
U.S. Environmental Protection Agency, Office of Water, Washington,
D.C.
- U.S. International Trade Commission, 1990,
- Synthetic organic
chemicals, U.S. production and sales, 1990: U.S. International Trade
Commission Report No. 2479.
- Venkatesan, M.I., and Kaplan, I.R., 1990,
- Sedimentary coprostanol as
an index of sewage addition in the Santa Monica Basin, California:
Environmental Science and Technology, v. 24, p. 208--213.
- Verhaar, H.J.M., van Leeuwen, C.J., and Hermens, J.L.M., 1992,
-
Classifying environmental pollutants. 1: Structure-activity
relationships for prediction of aquatic toxicity: Chemosphere, v. 25,
p. 471--491.
- Walker, R.W., Wun, C., and Litsky, W., 1982,
- Coprostanol as an
indicator of fecal pollution: CRC Critical Reviews in Environmental
Control, v. 10, p. 91--112.
- Water Quality Work Group of the Great River Environmental Action Team,
1980a,
- Water quality, sediment & erosion: GREAT I, Study of the
Upper Mississippi River, v. 4, 125 p., 2 app.
- ___ 1980b,
- Water quality work group appendix: GREAT II, Study of the
Upper Mississippi River (Guttenberg, Iowa, to Saverton, Missouri), 216
p.
- Williams, D.T., and Le Bel, G.L., 1981,
- A national survey of
tri(haloalkyl)phosphates, trialkylphosphates, and triarylphosphates in
Canadian drinking water: Bulletin of Environmental Contamination and
Toxicology, v. 27, p. 450--45.
- Williams, D.T., Nestmannn, E.R., Le Bel, G.L., Benoit, F.M., Otson,
R., and Lee, E.G.H., 1982,
- Determination of mutagenic potential and
organic contaminants of Great Lakes drinking water: Chemosphere,
v. 11, p. 263--276.
- Wisconsin State Board of Health, 1927,
- Stream pollution in Wisconsin:
Madison, Wisconsin State Board of Health, p. 277--321.
- Writer, J.H., 1992,
- Sewage contamination in the Upper Mississippi
River as measured by the fecal sterol coprostanol: Boulder, University
of Colorado, M.S. thesis, 99 p.
- Writer, J.H., Leenheer, J.A., Barber, L.B.,
Amy, G.L., and Chapra, S.C., 1995,
- Sewage contamination in the Upper
Mississippi River as measured by the fecal sterol, coprostanol: Water
Research, v. 29, p. 1427--1436.
Continue to '
Potentially Deleterious Effects of Chlorinating Mississippi River Water for
Drinking Purposes
', or return to '
Contents
'
Contaminants in the Mississippi River
U.S. GEOLOGICAL SURVEY CIRCULAR 1133
Reston, Virginia, 1995
Edited by Robert H. Meade
http://water.er.usgs.gov/pubs/circ1133/organic.html
Maintainer:
h2o Webserver Team
Last Modified: 1230 01 Oct 96 ghc