![]()
![]()
Ground water is the source of drinking water for most of the population of the eastern San Joaquin Valley. Each year, millions of pounds of nitrate (in fertilizer and manure) and pesticides are applied to cropland. Some of these chemicals infiltrate to the water table, degrade the water quality, and potentially cause a public health risk.
The quality of ground water in the alluvial fans of the eastern San Joaquin Valley was assessed by collecting data from three sets of wells: 30 domestic wells representative of the regional aquifer, 60 shallow domestic wells in three well-defined and contrasting agricultural land-use settings, and 20 multilevel monitoring wells in a 3.5-mile transect along a ground-water flow path (see p. 24-25).
Nitrate concentrations in 24 percent (21 of 88) of the domestic wells sampled during 1993-95 in the regional aquifer survey and land-use studies of the eastern San Joaquin Valley exceeded the drinking-water standard of 10 mg/L established by the USEPA. Furthermore, ground-water samples from 77 percent of the wells had nitrate concentrations greater than 2 mg/L, which is believed to represent background concentrations (Mueller and Helsel, 1996). These findings indicate that ground-water quality has been degraded over a large part of this aquifer because of the input of nitrate from human activity.
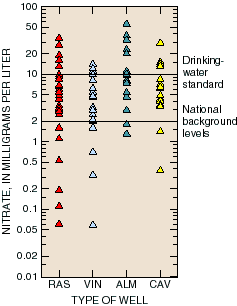
Nitrate concentrations in 24 percent of domestic wells exceeded USEPA drinking-water standards (RAS - regional aquifer survey; VIN - vineyard land use; ALM - almond land use; CAV - corn, alfalfa, and vegetable land use).
Ground-water samples collected in 1995 from the 30 domestic wells in the regional aquifer survey (median well depth 182 feet) had a median nitrate concentration of 4.6 mg/L; 5 of the 30 wells (17 percent) exceeded the USEPA drinking-water standard. The median concentration of 4.6 mg/L was higher than the median of 2.4 mg/L for ground water in similar alluvial settings with agricultural land use nationwide (Mueller and others, 1995).
Nitrate sources and aquifer susceptibility vary in the three agricultural land-use settings.
Characteristic |
Vineyard |
Almond |
Corn, alfalfa,
|
|---|---|---|---|
|
Median nitrate concentration, in milligrams per liter
|
Low
|
High
|
Intermediate
|
|
Source: nitrogen applied within a 0.25-mile radius |
Low
|
High
|
High
|
|
Susceptibility: sediment texture |
High |
High |
Low |
|
Susceptibility: potential for nitrate removal
by chemical
|
Low |
Intermediate |
High |
Nitrate concentrations in ground water sampled during 1993-95 from shallow domestic wells (median well depth 150 feet) were compared among three contrasting agricultural land-use settings. These 60 wells (three sets of 20) represent a part of the aquifer that is usually used as a domestic water supply. Nitrate concentrations were the highest in samples from the wells in the almond land-use setting, whereas concentrations were the lowest in samples from wells in the vineyard land-use setting. Nitrate concentrations were intermediate in samples from a grouped land-use setting of corn, alfalfa, and vegetables. Median nitrate concentrations in the three land-use settings were greater than or equal to the median in the regional aquifer survey; therefore, some of the other land-use settings in the eastern San Joaquin Valley must have generally lower nitrate concentrations than these three agricultural settings.
Sources of nitrate from agriculture--fertilizer and manure--were estimated for a 0.25-mile-radius circle centered at each well in each of the three agricultural land-use settings. Nitrate concentrations in ground water in the three land-use settings were related to estimates of the amount of nitrogen applied: the greatest amount of nitrogen was applied in the almond land-use setting; a slightly lower amount was applied in the corn, alfalfa, and vegetable land-use setting; and the smallest amount was applied in the vineyard land-use setting (Burow and others, in press, a). The estimated amount of nitrogen applied to individual sites was not strongly related to nitrate concentrations in ground-water samples from the wells, however. These results indicate that estimates of the amount of nitrogen applied are a fair indicator of nitrate concentrations for an area; however, the estimates are not a good predictor of concentration in an individual well.
This lack of predictability probably is due to several factors. The amount of coarse-grained sediments (sand- or gravel-sized) in the subsurface, which is referred to as sediment texture, is a major factor in the susceptibility of a site to nitrate contamination. The sediment texture influences the rates of infiltration and ground-water flow in the aquifer, which controls how rapidly water at the surface, with high nitrate concentrations, can infiltrate the soil and move downward to a well in the aquifer. The sediment textures in the almond and vineyard land-use settings were generally coarse-grained and conducive to rapid infiltration and ground-water flow. The sediment texture in the corn, alfalfa, and vegetable land-use setting was generally fine-grained with abundant clay, resulting in slow rates of infiltration and ground-water flow.
These contrasts in sediment texture, considered along with the contrasts in the amount of nitrogen applied, indicate that nitrate concentrations in ground water were highest where high susceptibility and high amounts of nitrogen applied occurred together (the almond land-use setting); nitrate concentrations in ground water were lowest where the amount of nitrogen applied was low, even though the susceptibility was high (the vineyard land-use setting); and nitrate concentrations in ground water were intermediate where the amount of nitrogen applied was high, but the susceptibility was low (the corn, alfalfa, and vegetable land-use setting) (Burow and others, in press, a).
Nitrate in ground water can also be removed by biochemical reactions such as nitrate reduction, in which nitrate is converted to nitrogen gas. These biochemical reactions can happen in ground water that has very low concentrations of dissolved oxygen. The chemical traits that indicate a potential for nitrate reduction, such as low dissolved-oxygen concentrations and high concentrations of iron and manganese, existed in ground-water samples from the corn, alfalfa, and vegetable land-use setting. The few samples that have these chemical traits do in fact have low or nondetectable nitrate concentrations. In contrast, there is little evidence of nitrate reduction in samples from the almond and vineyard land-use settings. Therefore, ground water in parts of the corn, alfalfa, and vegetable land-use setting is less susceptible to nitrate contamination than ground water in the other two land-use settings because nitrate may be removed by biochemical processes.
The presence of fine-grained sediment textures and evidence of nitrate reduction at some sites in the corn, alfalfa, and vegetable land-use setting are a result of its location on the lowest parts of the eastern alluvial fans, near the boundary between the alluvial fans and basin, where sediments were deposited by different sedimentary processes. As a result, sediment texture and chemical conditions in the corn, alfalfa, and vegetable land-use setting are more variable than in the almond and vineyard land-use settings. This high variability makes it difficult to generalize the conclusions from the overall data set to specific sites.
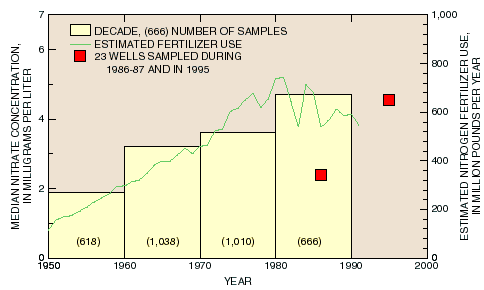
Analyses of several thousand ground-water samples were compiled from USGS and USEPA data bases to evaluate the long-term changes in nitrate concentrations. Data from wells in the eastern San Joaquin Valley that were less than or equal to 200 feet deep indicate that median nitrate concentrations increased significantly from the 1950s to the 1960s, and from the 1970s to the 1980s. From 1950 to 1980, the amount of nitrogen fertilizer applied in the eastern San Joaquin Valley counties increased from 114 to 745 million pounds per year, an increase of 554 percent. The number of dairies and other confined-animal feedlots, and hence manure production, also have increased greatly during this period. However, estimates indicate that nitrogen fertilizer is the largest source of nitrate in the eastern San Joaquin Valley (Gronberg and others, in press). Of course, this generalization may not be the case for areas where the source may be attributed to confined-animal feedlots located close together.
 (9,061 bytes)
Fertilizer use and median nitrate concentration in ground water have generally increased over the past four decades.
As indicated by a much smaller but better controlled data set, nitrate concentrations increased over less than a decade. Of the 30 wells in the regional aquifer survey in the eastern San Joaquin Valley that were sampled in 1995, 23 also had been sampled during 1986-87. The median nitrate concentration of this subset of 23 domestic wells increased from 2.4 mg/L during 1986-87 to 4.8 mg/L in 1995 (Burow and others, in press, b). The increase in nitrate concentration is likely attributed to increased fertilizer use from 1950 to 1980.
Analyses of samples from the 20 multilevel monitoring wells in the vineyard land-use setting indicated that nitrate concentrations have generally increased over the last four decades. In addition to analyses for nitrate and pesticides, the estimated date when the ground water sampled from these wells was recharged was determined by measuring concentrations of chlorofluorocarbons (CFC). CFC concentrations in samples from the deepest wells indicate that the deepest ground water had entered the aquifer prior to 1960. Nitrate concentrations in the pre-1960 water are generally less than 3 mg/L. In general, ground-water age increases with depth below land surface, whereas nitrate concentrations decrease with depth. The highest nitrate concentrations occur in shallow ground water that was recharged during 1977 to 1992. Because typical domestic well depths in the vicinity of the monitoring well transect are about 90 to 130 feet below land surface, these data suggest that nitrate concentrations could increase in domestic wells in the vineyard land-use setting.
 (17,619 bytes)
Monitoring wells installed along the ground-water flow path in the vineyard land-use setting show that DBCP and nitrate concentrations generally are lowest in older water and are high but variable in the younger water (<, less than).
Taken together, these studies offer compelling evidence that nitrate concentrations in the ground water in the eastern San Joaquin Valley have increased over the last four decades; prediction of future change is problematic because of the decrease in the amount of fertilizer application over the last decade.
Pesticides were detected in 61 of the 88 domestic wells sampled during 1993-95 (69 percent), but concentrations of most pesticides were low--less than 0.1 µg/L. Although 25 pesticides were detected, only 5 pesticides were detected in more than 10 percent of the samples: simazine, 1,2-dibromo-3-chloropropane (DBCP), atrazine, desethylatrazine (a transformation product of atrazine), and diuron. The greatest number of pesticides were detected in ground-water samples from wells in the vineyard land-use setting, where 17 different pesticides were detected in 80 percent of the samples. Pesticides were detected least often (in 55 percent of samples) in ground-water samples from wells in the corn, alfalfa, and vegetable land-use setting, although the number of pesticide detections were not significantly different among the three land-use settings.
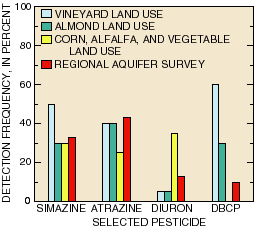
Simazine, atrazine, diuron, and DBCP are the most common pesticides in the eastern San Joaquin Valley, California (atrazine detections include desethylatrazine).
The occurrence of DBCP and simazine in the three agricultural land-use settings is generally consistent with the available information on the use of these pesticides (Burow and others, in press, a). In contrast, atrazine and diuron detections were not consistent with their reported use, possibly because of their application on rights-of-way for weed control.
The number of pesticide detections was related to characteristics that dictate the relative susceptibility of ground water beneath the three land-use settings. The greatest number of pesticide detections occurred in the vineyard land-use setting. The number of pesticide detections per sample was correlated with the coarse-grained sediment texture and dissolved-oxygen concentrations. Furthermore, samples from 15 of the 18 (83 percent) wells with nitrate concentrations exceeding the USEPA drinking-water standard also contained at least one pesticide. In the vineyard land-use setting, concentrations of DBCP and nitrate were positively correlated, indicating that ground-water samples with the highest nitrate concentrations also had the highest DBCP concentrations.
Concentrations of DBCP, a soil fumigant banned since 1977, exceeded the USEPA drinking-water standard of 0.2 µg/L in 18 of the 88 (or 20 percent) domestic wells sampled during 1993-95. Ten of the DBCP samples that exceeded the USEPA standards were from wells in the vineyard land-use setting, where DBCP was used to combat nematodes. In contrast, DBCP was not detected in any of the samples from the wells in the corn, alfalfa, and vegetable land-use setting. The soil fumigant 1,2-dibromoethane (also called EDB or ethylene dibromide) was the only other pesticide detected at a concentration that exceeded a USEPA drinking-water standard, although only six of the pesticides detected in ground water in the eastern San Joaquin Valley have drinking-water standards. EDB was detected in one ground-water sample.
Of the 30 domestic wells sampled as part of the regional aquifer survey in 1995, 19 had been sampled for pesticides during 1986-87. Samples from both periods were tested for 21 pesticides and 37 volatile organic compounds (VOC), but the laboratory methods of analyses were different for the two time periods. An increase from 13 pesticide detections during 1986-87 to 23 pesticide detections in 1995 can be attributed to the use of an analytical method that was 10 times more sensitive than the method used during 1986-87 (Burow and others, in press, b). If the data are adjusted to the same level of sensitivity, the number of pesticide detections is similar for the two periods: 10 detections during 1986-87 and 7 detections in 1995. Concentrations of pesticides generally were lower in 1995 than during 1986-87. Although the number of wells resampled is small, and the age of the sampled ground water has not been determined, there is no evidence that the pesticide concentrations or the number of pesticides detected during 1986-87 increased in 1995.
The number of pesticide detections is similar during 1986-87 and 1995 (red - concentration remained the same or decreased; blue - concentration increased; white - indeterminate; * -estimated. <, less than; µg/L, micrograms per liter)
|
Pesticide |
1986-87 concentration ( ug/L) |
1995 concentration ( ug/L) |
|---|---|---|
|
Atrazine |
<0.1 |
0.02 |
|
|
<0.1 |
0.056 |
|
|
0.1 |
0.007 |
|
|
<0.1 |
0.002 |
|
|
<0.1 |
0.12 |
|
|
0.4 |
0.081 |
|
|
<0.1 |
0.003 |
|
|
0.2 |
0.009 |
|
Simazine |
<0.1 |
0.059 |
|
|
0.2 |
0.01 |
|
|
<0.1 |
0.002 |
|
|
0.1 |
0.095 |
|
|
<0.1 |
0.006 |
|
|
0.1 |
0.11 |
|
|
<0.1 |
0.049 |
|
|
0.2 |
0.009 |
|
|
0.1 |
<0.005 |
|
|
0.2 |
0.075 |
|
DBCP |
<3.0 |
1.1 |
|
1,2-dichloro- propane |
6.4 |
0.4 |
|
Prometon |
<0.1 |
0.008* |
|
|
<0.1 |
0.004* |
|
Cyanazine |
<0.1 |
0.023 |
|
EDB |
<0.2 |
0.55 |
|
Dicamba |
0.01 |
<0.035 |
|
|
0.01 |
<0.035 |
|
Dichlorprop |
0.01 |
<0.032 |
Analyses of samples from the 20 multilevel monitoring wells in the vineyard land-use setting show that DBCP concentrations generally decreased with depth and were highly variable near the water table. Pesticides were detected most frequently near the water table in ground water that was recharged after 1980. Simazine was detected in all six ground-water samples from shallow wells (less than 90 feet deep), atrazine (or desethylatrazine) was detected in five of the six shallow wells, and DBCP was detected in four of the six shallow wells. Although plausible explanations exist for the high DBCP concentrations in young ground water, current data are insufficient to confirm the source of the high DBCP concentrations. These data suggest that ground water from domestic wells in the vineyard land-use setting would likely continue to contain DBCP, simazine, and atrazine (or desethylatrazine).