![]()
During 1991, about 63,000 tons of nitrogen and 20,000 tons of phosphorus fertilizer were applied in the Willamette Basin (Rinella and Janet, 1998). These elements are essential nutrients for aquatic plants; however, in high concentrations, they can cause excessive growth (eutrophication) that chokes stream channels. In drinking water, high nitrate concentrations cause methemoglobinemia or "blue baby" syndrome, which can be fatal to infants.
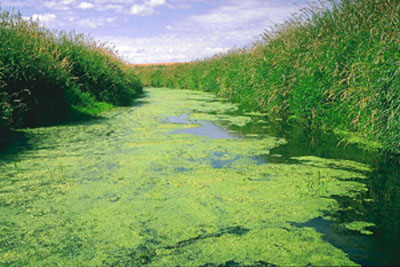
Excessive algal growth in the Little Pudding River results from high nutrient concentrations.
Ninety-eight percent of stream samples contained detectable nitrate concentrations: values ranged from 0.054 to 22 mg/L as nitrogen. The lowest nitrate concentrations were in streams draining predominantly forested basins (greater than 90 percent forest, by area).
Nitrate concentrations in streams increased as the percent of drainage area in agriculture increased. |
Although none of the streams sampled were used as a source of drinking water, the 10 mg/L maximum contaminant level (MCL) established for drinking water protection by the U.S. Environmental Protection Agency (USEPA, 1996) is a widely accepted standard for comparing nitrate concentrations. Nitrate concentrations exceeded the MCL in Bear and Zollner Creeks in the Pudding Basin northeast of Salem. Both streams drained predominantly agricultural land (greater than 50 percent agricultural land, by area).
In general, nitrate concentrations in streams increased as the percent of drainage area in agriculture increased. An example of this relationship is presented for 20 watersheds, ranging in size from 3.4 to 490 square miles, in the Pudding and Molalla Basins during April 26-29, 1993. Nitrate concentrations varied seasonally during 1993-95, as shown for the Pudding River at Aurora (drainage area, 490 square miles). The highest concentrations coincided with the beginning of rainfall induced runoff during late fall/early winter. A similar relationship was found for historic data in streams of the Willamette Basin (Bonn and others, 1995; 1996).
Ninety-five percent of stream samples contained detectable concentrations of total (dissolved plus suspended) phosphorus, ranging from 0.01 to 1.3 mg/L. Soluble reactive phosphorus (SRP, essentially dissolved orthophosphate) was detected in 89 percent of stream samples and varied from 0.01 to 0.93 mg/L.
Forty-five percent of streams yielded total phosphorus concentrations that exceeded 0.1 mg/L, the maximum value cited by the USEPA (1986) as a goal for prevention of nuisance plant growth in streams. Sixty-eight percent of streams where total phosphorus concentrations exceeded 0.1 mg/L drained largely agricultural land. In Pudding and Molalla Basin streams during April 1993, SRP concentrations increased with the percent of drainage area in agriculture, in a manner similar to that for nitrate. The lowest total phosphorus and SRP concentrations were observed in streams draining predominantly forested basins.
Forty-five percent of streams yielded total phosphorus concentrations that exceeded a value cited as a goal for prevention of nuisance plant growth. |
Data for the Pudding River show that total phosphorus and SRP concentrations varied seasonally. The highest total phosphorus concentrations generally coincided with the beginning of the fall/winter runoff period and probably were associated with the transport of suspended sediment. SRP concentrations were high during winter, but generally were higher during summer when contributions from point sources were greater relative to streamflow and, thus, dilution was less. Point sources contributed most of the SRP during summer low flow in 1994.
Total phosphorus concentrations in streams were highest in late fall/early winter when flows increased. SRP concentrations were highest in late summer when dilution by streamflow was minimal.
Nitrate concentrations in ground water exceeded the USEPA MCL of 10 mg/L in 6 of 70 shallow domestic wells (about 9 percent) sampled in the Willamette Basin in 1993 as part of the NAWQA Program. In contrast, the MCL was exceeded for 21 percent of 123 shallow domestic wells sampled by Oregon Department of Environmental Quality (ODEQ) during the 1980s (Bonn and others, 1995). Because ODEQ focused on known or perceived problems, a greater percentage of exceedances for their data is not unexpected.
Nitrate concentrations in ground water exceeded the USEPA MCL of 10 mg/L in 6 of 70 shallow domestic wells sampled in 1993. |
As seen from the graph, nitrate concentrations generally were higher in ground water with high dissolved oxygen (DO) concentrations than in ground water with low DO concentrations. Microbial reduction of nitrate, common in low DO ground water, is one likely explanation for the near absence of nitrate under low DO conditions.
Nitrate concentrations were greater where aquifer permeability was high than where aquifer permeability was low. Ground water in aquifers with low permeability tends to be older than in aquifers with high permeability. Because nitrogen fertilizer application rates in the Willamette Basin have increased in recent decades, older ground water would be expected to contain lower nitrate concentrations.
Nitrate concentrations in ground water were low where dissolved oxygen concentrations were low.
Nitrate concentrations were greater downgradient from irrigated agricultural areas than from non-irrigated agricultural areas. This pattern may reflect the generally greater application rate of nitrogen on irrigated crops (compared with nonirrigated crops) and the flushing effect of irrigation.
To a large degree, nitrate concentrations in ground water reflect land use practices at the time the water infiltrated into the soil, and these practices may not have been the same as when the ground water was sampled. For example, low tritium concentrations in water from 21 percent of the wells sampled in 1993 indicate that this water entered the ground before 1953 when nitrogen application rates also were low.
Because nitrogen fertilizer application rates in the Willamette Basin have increased in recent decades, nitrate concentrations in ground water pumped during 1993 probably reflect application rates that were less than 1993 rates. Water pumped in the future may contain higher nitrate concentrations than in 1993, as the increasing fertilizer application rates of the past continue to influence ground water quality downgradient from application areas. Because of the time lag between infiltration of water into the ground and its arrival at a downgradient well, effects of past and present ground water management practices may take years or decades to become apparent in ground water pumped from shallow domestic wells.
During 1993-95, more than 260 stream samples were collected for analysis of nutrients from 51 sites located throughout the Willamette Basin (p. 25). Site locations are shown on the land use map on page 24.
In 1993, 70 shallow domestic wells from throughout the Willamette Valley were sampled for nutrients (p. 25). The wells selected for sampling were completed in alluvium because more than 80 percent of ground water used in the Willamette Basin is pumped from alluvial aquifers. Site locations are shown on the hydrogeology map on page 24.
Detailed analyses of the data are presented by Rinella and Janet (1998) for surface water and by Hinkle (1997) for ground water.