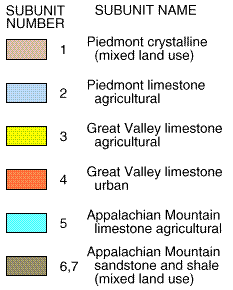
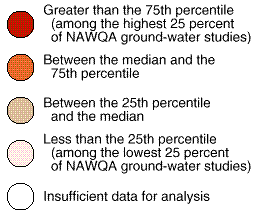
NUTRIENTS in water
|
|
 (14,184 bytes) (14,184 bytes)
|
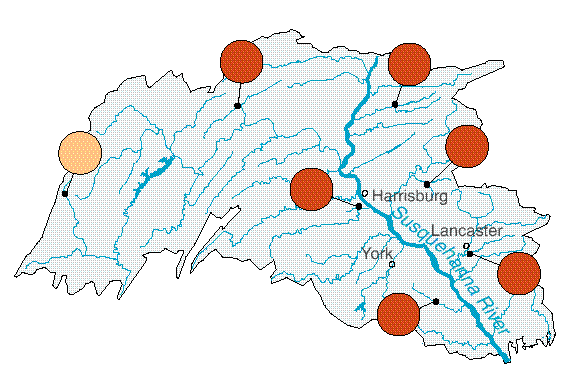
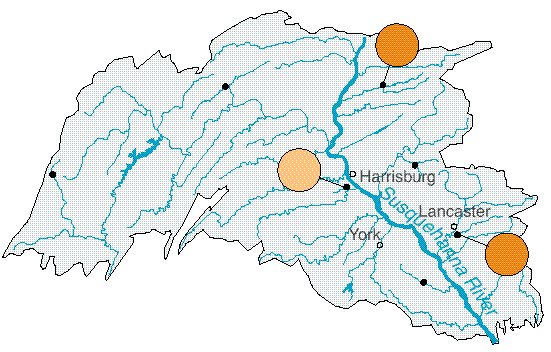
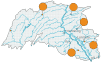
Comparisons of scores based on nitrate, phosphorus, and ammonia concentrations in streams showed that the agricultural and urban sites were among the highest of all NAWQA Study-Unit sites (above the 75th percentile). Animal manure and fertilizer are the primary sources of the nitrogen. The The forested site was above the 25th percentile nationally, which may be related to atmospheric deposition of nitrogen or the small part (less than 15 percent) of the basin in nonforested land use.
|
PESTICIDES in water
|
|
 (13,359 bytes) (13,359 bytes)
|
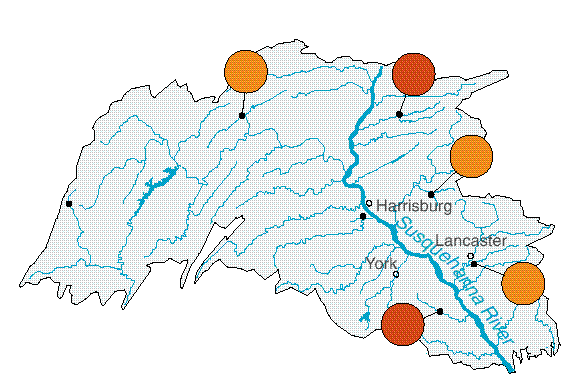
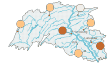
The scores based on total herbicide concentrations and total insecticide concentrations were higher than the national median at the two agricultural sites. The score for total herbicides and total insecticides was slightly lower than the national median at the urban site.
|
ORGANOCHLORINE PESTICIDES and PCBs in streambed sediment and biological tissue
|
|
 (14,084 bytes) (14,084 bytes)
|
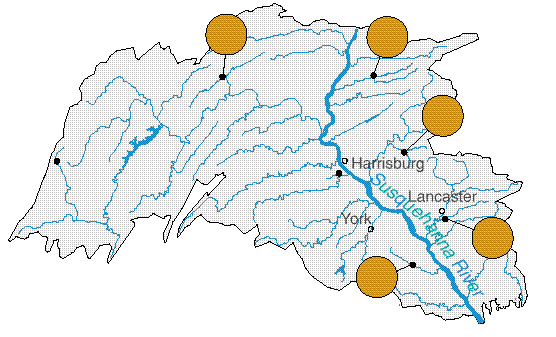
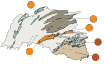
Comparison of scores based on total PCBs and organochlorines in fish tissue and streambed sediment showed two of the agricultural sites to be among the highest of all NAWQA Study-Unit sites; the other three agricultural sites were between the median and 75th percentile. The Pennsylvania interagency work group composed of key agencies compared the data to FDA action levels and concluded that there was no evidence of concentrations in fish tissue that would warrant human-health advisories for fish consumption. Although persistent, the major compounds detected showed signs of degradation. None of the five long-term monitoring sites shown here exceeded the USEPA Tier 1 sediment guidelines for total DDT, total chlordane, or total PCBs. Two of the long-term monitoring sites did not have sufficient sediment or target fish species for sample collection.
|
TRACE ELEMENTS in streambed sediment
|
|
 (13,006 bytes) (13,006 bytes)
|
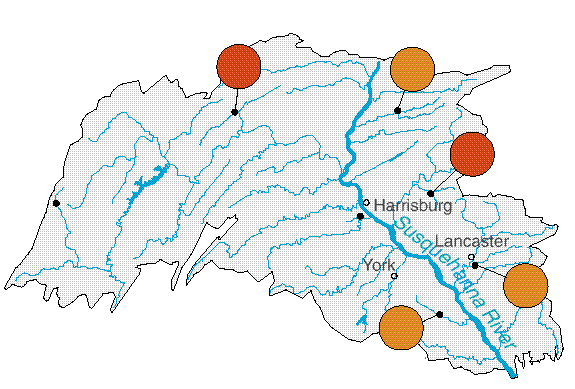
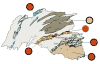
Scores based on trace-element concentrations in streambed sediments at the five long-term monitoring sites where sediment was collected were above the national median for all NAWQA Study Unit sites. The concentrations of trace elements in sediment were not well correlated with concentrations in fish liver tissue for 8 of the 11 trace elements, indicating that the elements in the sediment may not have been bioavailable.
|
SEMIVOLATILE ORGANIC COMPOUNDS (SVOCs) in streambed sediment
|
|
 (14,473 bytes) (14,473 bytes)
|
Comparison of SVOCs showed that the concentrations of phthalates, PAHs, and phenols at two of the sampling sites were among the highest of all NAWQA Study-Unit sites. Concentrations at the three other sites were above the national median. None of the long-term monitoring sites sampled exceeded the USEPA Tier 1 guidelines for SVOCs in streambed sediment.
|
STREAM-HABITAT DEGRADATION
|
|
 (15,064 bytes) (15,064 bytes)
|
Stream-habitat scores at six of the seven sites were ranked between the 25th and 75th percentile nationally. Bachman Run had the poorest stream-habitat score because of high bank erosion and minimal vegetative bank stability; it was ranked as one of the most degraded of all NAWQA Study-Unit sites.
|
FISH-COMMUNITY DEGRADATION
|
|
 (10,893 bytes) (10,893 bytes)
|
Fish communities at five of the seven sites were ranked between the 25th and 75th percentile nationally. East Mahantango Creek exhibited a diverse and healthy fish community and was ranked as having one of the least degraded fish communities of all NAWQA Study-Unit sites. The fish community at Mill Creek scored poorly because of the high percentage of pollution-tolerant and omnivorous species and the high incidence of anomalies; it ranked among the poorest of all NAWQA Study-Unit sites.
|
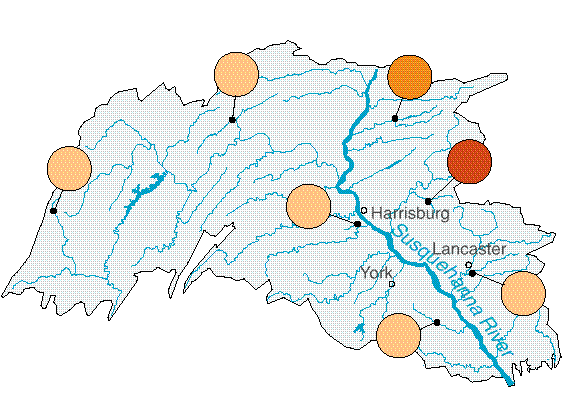
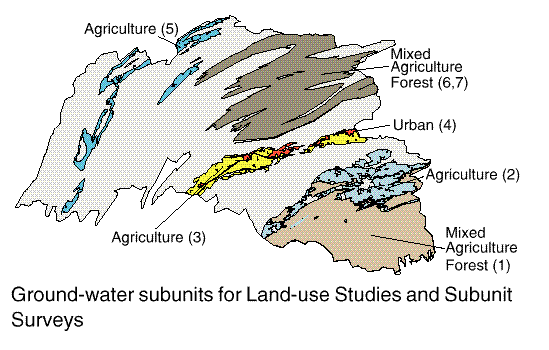
RADON |
|
 (14,771 bytes) (14,771 bytes)
|
Radon activities in limestone and crystalline subunits in the Piedmont Physiographic Province were among the highest of all NAWQA Study Units. Activities in the remaining subunits were slightly above the 50th percentile when compared to other subunits representing drinking-water aquifers in all NAWQA Study Units.
|
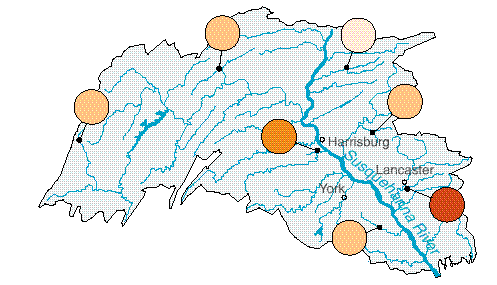
NITRATE |
|
 (15,233 bytes) (15,233 bytes)
|
Nitrate concentrations in agricultural areas underlain by limestone bedrock were among the highest of all NAWQA Study Units, and numerous drinking-water samples exceeded the drinking-water standard for nitrate. Ground water in the subunits underlain by crystalline bedrock also had high nitrate concentrations. Ground water in the urban subunit and the subunit underlain by sandstone and shale had nitrate concentrations closer to the median when compared to all subunits representing drinking-water aquifers in all NAWQA Study Units.
|
DISSOLVED SOLIDS |
|
 (13,433 bytes) (13,433 bytes)
|
Scores based on concentrations of dissolved solids were above the 50th percentile for all of the subunits underlain by limestone. The subunits underlain by crystalline bedrock and the subunit underlain by sandstone and shale had scores for dissolved solids that were among the lowest of all the subunits representing drinking-water aquifers in all NAWQA Study Units.
|
VOLATILE ORGANIC COMPOUNDS (VOCs) |
|
 (13,156 bytes) (13,156 bytes)
|
Scores based on the frequency of detections of VOCs in the Great Valley limestone urban subunit and the Piedmont limestone agricultural subunit were among the highest of subunits representing drinking-water aquifers in all NAWQA Study Units; however, the frequency of detection was much higher in the urban subunit. No VOCs were detected in the subunits in the Appalachian Mountains, which is the more rural part of the Study Unit. The Piedmont crystalline subunit and Great Valley carbonate agricultural subunit also had scores that indicated a low frequency of detections of VOCs when compared to national data.
|
PESTICIDES |
|
 (14,501 bytes) (14,501 bytes)
|
Pesticides were detected frequently in all the subunits except for the Appalachian Mountain sandstone and shale subunit. The limestone agricultural, limestone urban, and crystalline agricultural subunits were ranked as having some of the highest pesticide-detection frequencies of subunits representing drinking-water aquifers in all NAWQA Study Units; however, none of the detections of pesticides in water from any of the wells sampled exceeded drinking-water standards.
|