
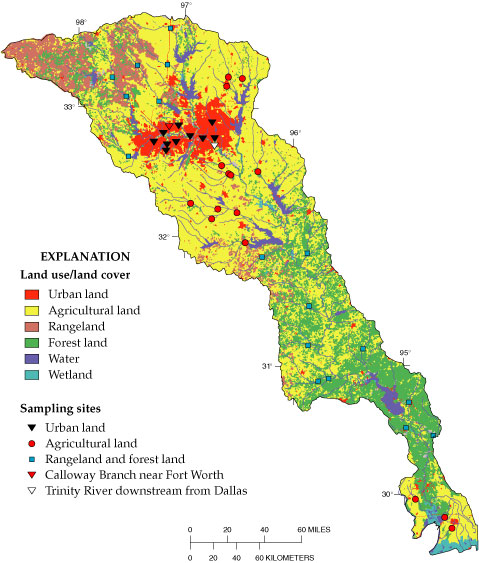
Nutrient sampling sites on streams of the Trinity River Basin during 1993-95. The greatest density of sites is in agricultural and urban areas.
Nutrients (nitrogen and phosphorus compounds) in surface water are essential for aquatic plant and animal life; but large concentrations of nutrients can have adverse ecological effects. Fertilizer, manure, plant decay, and atmospheric fallout are major nonpoint sources of nitrogen and phosphorus. Wastewater-treatment plant effluent is a major point source.
The EPA (1996) maximum contaminant level (MCL) for nitrate (as nitrogen) is 10 milligrams per liter. Excessive nitrate can restrict oxygen transport in the bloodstream. Ammonia in surface water is naturally converted to nitrate. This conversion, in addition to increasing nitrate concentration, removes oxygen from the water, which also can adversely affect fish and invertebrates.
The EPA recommends that total phosphorus concentration (as phosphorus) not exceed 0.10 milligram per liter in streams not discharging directly into reservoirs and not exceed 0.05 milligram per liter in streams discharging directly into reservoirs. Phosphorus commonly is associated with eutrophication—the enrichment of a body of water with nutrients resulting in accelerated algal or plant production. Eutrophication can result in fishkills, unpleasant odors, loss of recreational value, and other water-quality-related problems.
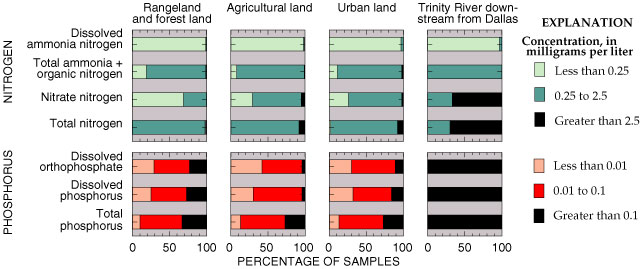
Water samples of tributary streams draining rangeland and forest land, agricultural land, and urban land, and of the Trinity River downstream from Dallas were collected from March 1993 to September 1995. For nitrate, only two samples exceeded the MCL; one was from Calloway Branch, a small urban stream northeast of Fort Worth, and the other was from the Trinity River downstream from Dallas. Most nitrate (as nitrogen) concentrations were less than 2.5 milligrams per liter. The distribution patterns of total nitrogen and three nitrogen species in the tributary streams draining agricultural and urban areas were very similar. Tributary streams draining rangeland and forest land had fewer samples with concentrations greater than 2.5 milligrams per liter, a result that is attributed to lesser amounts of fertilizer applied in rangeland and forest land than in agricultural and urban lands. Samples from the Trinity River downstream from Dallas, where the streamflow is dominated by effluent from regional wastewater-treatment plants, had appreciably greater concentrations of nitrate and total nitrogen than streams affected only by nonpoint sources (Shipp, 1995a).
About 30 percent of the total phosphorus samples from tributary streams draining the three land-use areas had concentrations greater than the EPA guideline, and all the samples from the Trinity River downstream from Dallas had concentrations greater than the EPA guideline. For the 10 sampling sites on tributaries that flow directly into reservoirs, concentrations in about 50 percent of the samples exceeded the EPA guideline. The distributions of total and dissolved phosphorus and orthophosphate concentrations were similar for tributary streams draining urban, rangeland, and forest land. In agricultural areas, fewer sample concentrations were greater than 0.10 milligram per liter. Within the agricultural area, concentrations of total phosphorus (and total nitrogen) tend to increase as the percentage of cropland increases.
Distributions of nitrogen and phosphorus concentrations in streams of the Trinity River Basin during 1993-95 reflect agricultural and urban land-use practices.
Total nitrogen and total phosphorus concentrations show noticeable seasonal patterns (Land and Shipp, 1996). Median total nitrogen concentrations increase from midwinter to midspring, decline in the summer, and increase again in the fall; median total phosphorus concentrations follow a generally similar pattern. Because much greater amounts of fertilizer are applied in the spring than in other seasons, the timing of the applications would seem to be the major reason for increases in concentrations in the spring. However, total nitrogen and (especially) total phosphorus concentrations were found to relate more closely to streamflow than to fertilizer applications. Monthly mean streamflow usually peaks in the spring, declines in the summer, and rises to a lesser peak in the fall.
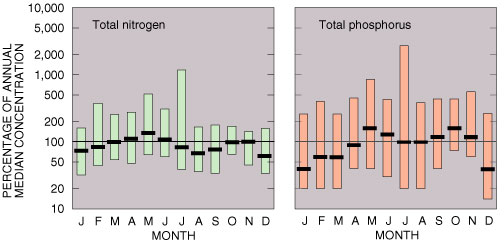
Seasonality of nitrogen and phosphorus concentrations in streams of the Trinity River Basin during 1993-95. Each bar shows the range between the 10th and 90th percentiles. The black line in each bar shows the monthly median concentration as a percentage of the annual median.
Nutrient concentrations at most sampling sites did not change appreciably from 1974 to 1991 (Van Metre and Reutter, 1995). The exceptions are five sites downstream from major wastewater-treatment plants in the Dallas area. As a result of upgrades to the treatment plants, ammonia plus organic nitrogen at the sampling sites decreased about 95 percent; concurrently, nitrate increased by a similar magnitude. The decrease in ammonia has led to an increase in dissolved oxygen, which reduces the threat of fishkills downstream from the wastewater-treatment plants.

An algal bloom in Richland Creek is indicative of excess nutrients.
| AccessibilityFOIAPrivacyPolicies and Notices | |
 |
|