
Seven major water-quality characteristics were evaluated for stream sites in each NAWQA Study Unit. Summary scores for each characteristic were computed for all sites that have adequate data. Scores for each site in the Trinity River Basin were compared with scores for all sites sampled in the 20 NAWQA Study Units during
1992–95. Results are summarized by percentiles; higher percentiles generally indicate poorer quality compared with other NAWQA sites. Water-quality conditions at each site also are compared to established criteria for protection of aquatic life. Applicable criteria are limited to nutrients and pesticides in water and semivolatile organic compounds (SVOCs), organochlorine pesticides, and PCBs in sediment. (Methods used to compute rankings and evaluate aquatic-life criteria are described in Gilliom and others, in press.)
|
|
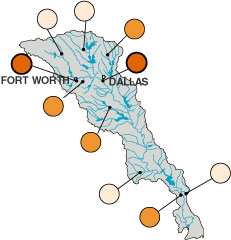
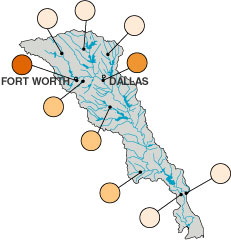
The median nutrient concentration at a Trinity River site downstream from large wastewater discharges is in the highest category of all NAWQA stream sites, and one sample from the site exceeded the EPA MCL. Otherwise, all the sites except one in a rural area are less than the national median. As expected, the median concentrations at reference sites are in the lowest quartile of all NAWQA Study Units across the Nation.
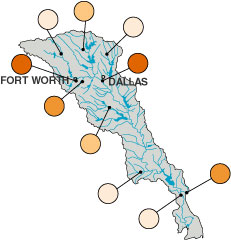
PESTICIDES in water
Median pesticide concentrations are greater than the national NAWQA median at all three sites for which there were adequate data to make the comparison. Sites with urban watersheds are in the highest category. A site with croplands in the watershed is in the second highest category. Exceedances of drinking-water standards are most often attributed to diazinon in urban streams and atrazine in agricultural streams.
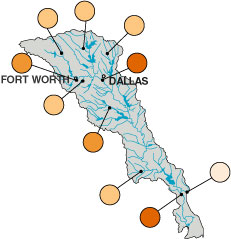
ORGANOCHLORINES
in streambed sediments and biota
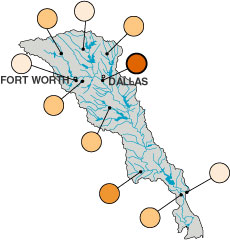
Concentrations of organochlorine pesticides and PCBs in bed sediments and biota (clam and fish tissue) at two sites on the Trinity River in the Dallas-Fort Worth area are in the highest category of all NAWQA Study Units. Sites in watersheds with little development are in the lowest category.
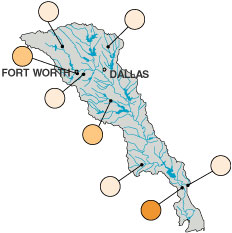
TRACE ELEMENTS
in streambed sediments
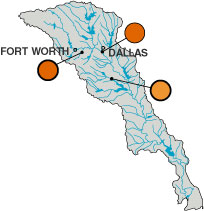
Concentrations of trace elements in sediments at a site on the West Fork Trinity River near downtown Fort Worth are in the highest category of all NAWQA sites. The next-highest concentrations are in the Trinity River downstream from Dallas. All other sites have concentrations less than the national median.
SEMIVOLATILE ORGANIC COMPOUNDS
in streambed sediments
Concentrations of SVOCs (primarily PAHs) in sediments at two sites on the Trinity River in the Dallas-Fort Worth area are in the highest category of all NAWQA sites. However, no compounds exceeded an aquatic-life criterion. Surprisingly, SVOCs at the reference site on Menard Creek are above the national median.
FISH COMMUNITIES
A fish-community index based on the number of diseased, pollution-tolerant, omnivorous, and nonnative fish is greater than the national NAWQA median at 4 of the 10 sites evaluated. The two most degraded sites are on the Trinity River; one is downstream from Dallas-Fort Worth, and the other is near the mouth of the Trinity River.
STREAM HABITAT
Habitat degradation is greater than the national median at one site on the Trinity River. Leveeing of the streams and bank erosion are the most influential factors for this degraded habitat. All the sites on relatively small rural streams are in the least-degraded category.
|
CONCLUSIONS Nutrient
concentrations in most streams in the Trinity River Basin were below
national median concentrations for NAWQA Study Units. Two exceptions are
the Trinity River downstream from Dallas and a rural site. Pesticide
concentrations at two urban sites were in the highest category, and
concentrations at an agricultural site were in the In general, concentrations of trace elements, PCBs, organochlorine pesticides, and PAHs in streambed sediments and aquatic biota exceeded national medians (highest two categories) or 75th percentiles (highest category) at urban sites and were below national medians at more rural sites. One urban site, one agricultural site, and two sites on the Trinity River downstream from Dallas had fish-community indices greater than the national median. One of those sites also had habitat degradation greater than the national median. |
| AccessibilityFOIAPrivacyPolicies and Notices | |
 |
|