
Hydrologic Benchmark Network Stations in the West-Central U.S. 1963-95 (USGS Circular 1173-C)
|
|
|
|
|
Kings Creek near Manhattan, Kansas (06879650)
Hydrologic Benchmark Network Stations in the West-Central U.S. 1963-95 (USGS Circular 1173-C)
|
|
|
|
|
Kings Creek near Manhattan, Kansas (06879650)
To download a printer friendly PDF version of this information click here.
This report details one of the approximately 50 stations in the Hydrologic Benchmark Network (HBN) described in the four-volume U.S. Geological Survey Circular 1173. The suggested citation for the information on this page is:
|
Clark, M.L., Eddy-Miller, C.A., Mast, M.A., 2000, Environmental characteristics and water-quality of Hydrologic Benchmark Network stations in the West-Central United States, U.S. Geological Survey Circular 1173-C, 115 p. |
All of the tables and figures are numbered as they appear in each circular. Use the navigation bar above to view the abstract, introduction and methods for the entire circular, as well as a map and list of all of the HBN sites. Use the table of contents below to view the information on this particular station.
|
Table of Contents |
| 1. Site Characteristics and Land Use |
| 2. Historical Water Quality Data and Time-Series Trends |
| 3. Synoptic Water Quality Data |
The Kings Creek HBN Basin is in the Central Lowland physiographic province (Fenneman, 1946) in
 |
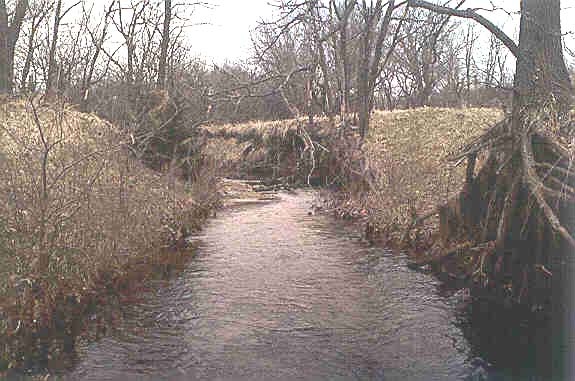
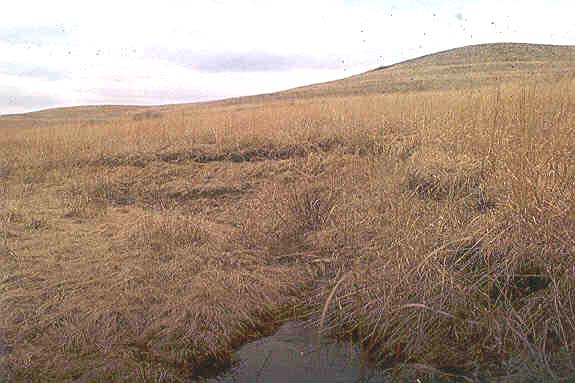
Kings Creek is an intermittent stream with sustained flows generally occurring in the spring. Average annual precipitation at the Manhattan, Kans., weather station is about 84 cm, which mostly falls in the form of rain during spring and early summer (National Climatic Data Center, 1996). Streamflow generally ceases during late summer, and the stream may remain dry during the fall. Flow in ephemeral headwater channels occurs only immediately following rainfall events. Mean monthly discharges range from less than 0.01 m³/s in September to 0.23 m³/s in May, and average annual runoff is about 20 cm (Putnam and others, 1996). The Kings Creek Basin is characterized by warm to hot summers and cold winters. Mean monthly temperature extremes at the weather station ranged from -1.8×C in January to 26.6×C in July during the period 1900-95 (National Climatic Data Center, 1996).
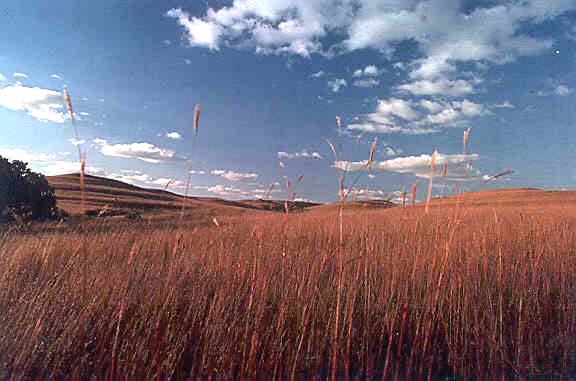
The Kings Creek Basin is contained within the Konza Prairie Research Natural Area and is the only HBN Basin that exclusively drains pristine, native tallgrass prairie. The grass species are big bluestem, indian grass, switchgrass, little bluestem, Kentucky bluegrass, and Junegrass. The grasses have never been plowed because of the rocky soils and steep topography (Knapp and others, 1998). The prairie contains many species of herbaceous plants other than grasses, including heath aster, dotted gayfeather, ironweed, and several goldenrods. Annual burnings are set by land managers to control woody vegetation. The burning pattern varies in the basin; less frequently burned areas have a greater plant diversity, whereas burned areas tend to have a greater dominance of warm-season grasses. Woody vegetation in the unburned areas include sumac, dogwood, and eastern red cedar. Strips of forest along stream channels are composed of oak species, hackberry, and American elm.
 |
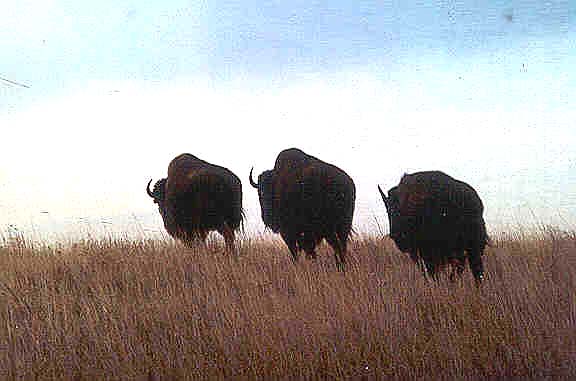
The Kings Creek Basin lies within Riley County and is entirely within the Konza Prairie Research Natural Area, which was established in 1972 as a research facility. The land was originally acquired by The Nature Conservancy and is leased to Kansas State University, Division of Biology, for research purposes (Knapp and others, 1998). The Konza Prairie was selected as a research site for the Long Term Ecological Research Program of the National Science Foundation in 1981. Permission to access the site is obtained by contacting the Konza Prairie Office at Kansas State University in Manhattan. A light-duty service road provides access to some of the Kings Creek tributaries. Foot trails also provide access to the basin. Land-use activities are designed and controlled in the Kings Creek Basin. The land-management plan is designed to study the effect of fire and grazing on prairie plants and animals. The burn schedule is variable in the basin; sections are burned on a 1-, 2-, 4-, or 20-year cycle. Grazing divisions in the basin include grazed and ungrazed sections; both types of grazing divisions have burn schedules. Grazing in the South Branch Kings Creek drainage is by native bison, which were reintroduced to the prairie in 1987. Grazing by experimental cattle herds is allowed in other parts of the Konza research area, outside the Kings Creek Basin.
The data set analyzed for the Kings Creek HBN station includes 72 water-quality samples that were collected from April 1980 to July 1995. Sampling frequency is described on the basis of water year, which begins on October 1 and ends on September 30. Annual sampling frequency was variable over the 15-year period. The median number of annual samples that were collected was three; only one sample was collected in 1994. The highest sampling frequencies were in 1989 and 1990 when 9 and 12 samples were collected, respectively. In 1989 and 1990, multiple sampling events were conducted during storm runoff as part of the USGS National Water-Quality Assessment Program, and those samples were used to supplement the HBN data set. All samples were analyzed at the NWQL in Arvada, Colo. The period of record for discharge is from water year 1979 to current year (2000).
 |
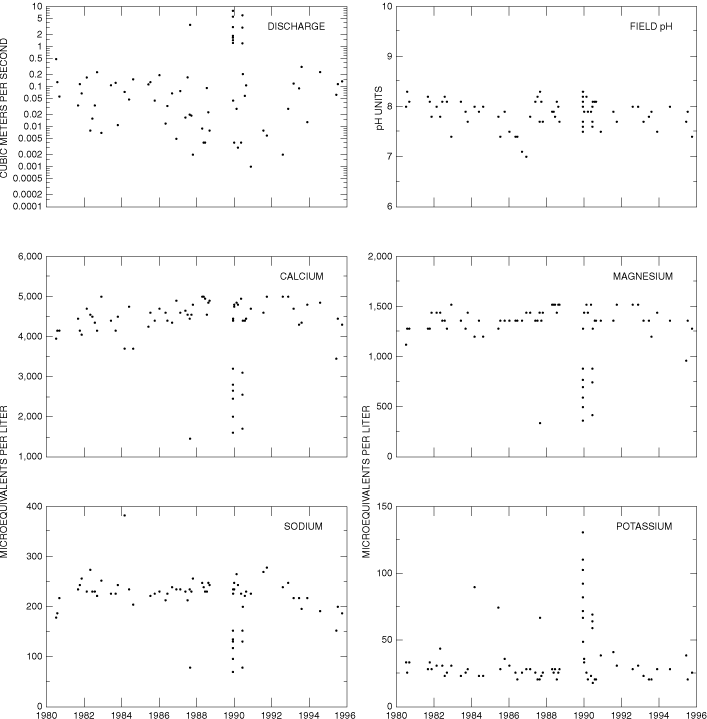
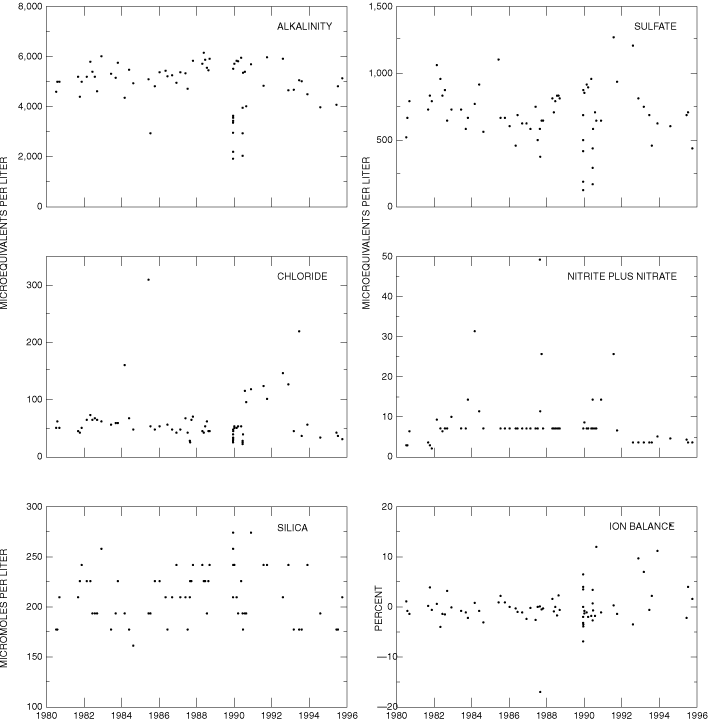
Data quality was checked using ion balances and time-series plots. Calculated ion balances for samples with complete major-ion analyses are shown in Figures 7a and 7b. Temporal variation of discharge, field pH, major dissolved constituents, and ion balance at Kings Creek, Kansas. More than 90 percent of the samples had ion balances within the ±10 percent range, indicating that the major-ion analytical results generally were of good quality and that unmeasured constituents, such as organic anions, nutrients, and trace metals, generally do not contribute substantially to the ion composition of the stream water. Time-series plots of ion concentrations were inspected for data quality (fig. 7). The increase in scatter in the chemical data during 1989 and 1990 was the result of samples that were collected during storm runoff periods, which also is reflected in the scatter in the discharge data for that same period (fig. 7).
The median and range of major-ion concentrations in the stream water collected at the Kings Creek HBN station and VWM concentrations in wet precipitation measured at the Konza Prairie NADP station are presented in table 10. The NADP station is about 1.5 km west of the HBN station. Precipitation chemistry at the NADP station was dilute and slightly acidic with VWM pH of 5.0 during the period of record, 1982-95. The dominant cation in precipitation was ammonium, which contributed about 37 percent of the total cation concentration; calcium contributed 31 percent and hydrogen contributed 19 percent. The dominant anions in precipitation were sulfate and nitrate, which contributed 54 and 40 percent, respectively. This was the highest VWM sulfate concentration (27 meq/L) recorded for the NADP stations used in this study. Sulfate concentrations in precipitation tend to be higher in the Midwest and Ohio Valley, reflecting the sulfur emission source in these areas. Ammonium and nitrate tend to be higher in precipitation chemistry where livestock and fertilizer applications are common (National Atmospheric Deposition Program/National Trends Network, 1997). The dry deposition of nitrogen is not included in the wet deposition value but is important in tallgrass prairies and has been estimated to be 25 to 50 percent of the total atmospheric input (Gilliam, 1987).
[Parameters in units of microequivalents per liter, except for discharge in cubic meters per second, specific conductance in microsiemens per centimeter at 25 degrees Celsius, pH in standard units, and silica in micromoles per liter; n, number of stream samples; VWM, volume-weighted mean; spec. cond., specific conductance; --, not reported; <, less than]
|
Parameter |
Stream Water |
Precipitation VWM |
|||||
|
Minimum |
First quartile |
Median |
Third quartile |
Maximum |
n |
||
| Discharge |
<0.001 |
0.01 |
0.07 |
0.17 |
7.9 |
72 |
-- |
| Spec. cond., field |
180 |
481 |
540 |
576 |
618 |
67 |
-- |
| pH, field |
7.0 |
7.7 |
7.9 |
8.1 |
8.3 |
72 |
5.0a |
| Calcium |
1,400 |
4,200 |
4,400 |
4,800 |
5,000 |
72 |
16 |
| Magnesium |
340 |
1,300 |
1,400 |
1,400 |
1,500 |
72 |
2.5 |
| Sodium |
70 |
200 |
230 |
240 |
380 |
72 |
3.5 |
| Potassium |
18 |
23 |
28 |
38 |
130 |
72 |
.8 |
| Ammonium |
<.7 |
<.7 |
2.1 |
2.9 |
7.1 |
60 |
19 |
| Alkalinity, laboratory |
1,900 |
4,600 |
5,200 |
5,500 |
6,200 |
70 |
-- |
| Sulfate |
120 |
580 |
690 |
830 |
1,300 |
72 |
27 |
| Chloride |
22 |
41 |
51 |
65 |
310 |
72 |
3.4 |
| Nitrite plus nitrate |
2.1 |
6.4 |
7.1 |
7.1 |
49 |
65 |
20b |
| Silica |
160 |
190 |
210 |
240 |
270 |
72 |
-- |
a Laboratory pH.
b Nitrate only.
Stream water in Kings Creek is a calcium bicarbonate type. The sum of ion concentrations ranged from about 4,300 to about 14,000 meq/L. Alkalinity ranged from 1,900 to 6,200 meq/L, and bicarbonate was the primary contributor to alkalinity at this station. The major cation, calcium, contributed 73 percent of median cation concentration in stream water. The major anion, bicarbonate, contributed 87 percent of the median anion concentration. The ion composition of the stream water reflects the weathering of the underlying limestone bedrock. Median concentrations of ammonium and nitrate were lower in the stream water than in the precipitation, indicating that nitrogen generally is retained by the prairie biomass. Nitrogen generally is a limiting nutrient in tallgrass prairies (Gilliam, 1987). Mean annual transport of nutrients from Kings Creek was very low compared to other streams in the lower Kansas River Basin (Helgesen, 1996); nitrate concentrations were low enough to limit algal growth during the summer (McArthur and others, 1985).
Correlations among dissolved constituents and discharge were determined for Kings Creek (table 11). The base cations and anions, except dissolved potassium, showed inverse relations with discharge. These results are consistent with a hydrologic system where base-flow chemistry that is dominated by ground water is diluted during periods of increased discharge, particularly rainfall events. Ion concentrations in ground water tend to be greater than in surficial sources because the contact time with rocks and minerals is longer. The time-series plots for base cations, except potassium, and base anions (fig. 7) show the inverse relation when compared to the discharge time-series plot during the 1989 and 1990 storm-event sampling. The behavior of potassium is more similar to plant nutrients and sediment. Exportation of nitrogen from the basin was reported to increase during storm events (McArthur and others, 1985), and sediment also shows a flow-driven relation during storm events (Knapp and others, 1998). The strongest ion correlation was between calcium and magnesium (rho value = 0.907), which is typical of a carbonate-dominated geologic environment.
[Q, discharge; Ca, calcium; Mg, magnesium; Na, sodium; K, potassium; Alk, alkalinity; SO4, sulfate; Cl, chloride; SiO2, silica; --, not applicable]
|
|
Q |
pH |
Ca |
Mg |
Na |
K |
Alk |
SO4 |
Cl |
| pH |
0.176 |
-- |
-- |
-- |
-- |
-- |
-- |
-- |
-- |
| Ca |
-.782 |
-0.164 |
-- |
-- |
-- |
-- |
-- |
-- |
-- |
| Mg |
-.804 |
-.187 |
0.907 |
-- |
-- |
-- |
-- |
-- |
-- |
| Na |
-.758 |
-.050 |
.682 |
0.774 |
-- |
-- |
-- |
-- |
-- |
| K |
.238 |
-.041 |
-.346 |
-.402 |
-0.164 |
-- |
-- |
-- |
-- |
| Alk |
-.784 |
-.051 |
.711 |
.742 |
.661 |
-0.362 |
-- |
-- |
-- |
| SO4 |
-.638 |
.159 |
.570 |
.610 |
.726 |
-.102 |
0.590 |
-- |
-- |
| Cl |
-.551 |
.047 |
.439 |
.480 |
.588 |
-.228 |
.441 |
0.626 |
-- |
| SiO2 |
-.274 |
-.085 |
.206 |
.205 |
.255 |
.566 |
.125 |
.053 |
-0.072 |
Results of the seasonal Kendall test for trends in discharge and major dissolved constituents for Kings Creek from 1982 through 1995 are presented in table 12. The only statistically significant trend (a = 0.01) was decreasing sodium for flow-adjusted concentrations. Except for the 1989 and 1990 storm-event sampling, sodium concentrations were generally constant until about 1992, after which they begin to decline. The time-series plot indicates that most discharge measurements made during 1993-95 were higher than the median discharge, and sodium did show an inverse correlation with discharge. However, the flow-adjustment should remove the bias introduced by discharge. The downward sodium trend is consistent with the decrease in sodium detected in precipitation by Lynch and others (1995). For the period 1980-92, decreasing sodium concentrations were detected at 53 of 58 NADP stations throughout the country. Statistically significant downward trends (a = 0.05) were reported at 28 of the 53 stations with decreasing sodium concentrations; many of these were in the regional area that includes Kansas.
[Trends in units of microequivalents per liter per year, except for discharge in cubic meters per second per year, pH in standard units per year, and silica in micromoles per liter per year; p-value, attained significance level; --, not calculated; <, less than]
|
Parameter |
Unadjusted |
Flow adjusted |
||
|
Trend |
p-value |
Trend |
p-value |
|
| Discharge |
0.01 |
0.701 |
-- |
-- |
| pH |
-.02 |
.055 |
-0.02 |
0.124 |
| Calcium |
8 |
.728 |
7 |
.698 |
| Magnesium |
<.01 |
.670 |
-2 |
.635 |
| Sodium |
-2 |
.056 |
-2 |
.007 |
| Potassium |
<.01 |
.824 |
.08 |
.698 |
| Alkalinity |
-50 |
.016 |
-70 |
.016 |
| Sulfate |
-7 |
.318 |
-5 |
.211 |
| Chloride |
-.4 |
.897 |
(b) |
-- |
| Nitrite plus nitrate |
-.2a |
.086 |
-- |
-- |
| Silica |
<.01 |
.999 |
.4 |
.635 |
a Trend test for highly censored data was used.
b Concentration-flow model not significant at a = 0.10.
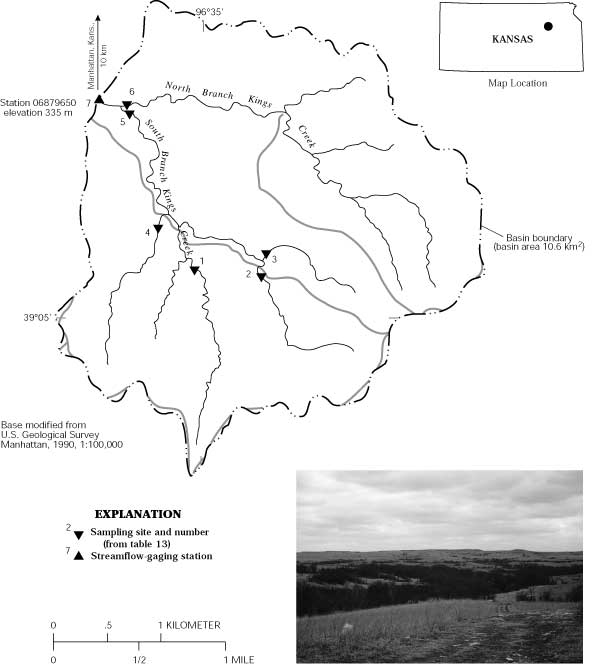
Results of a surface-water synoptic sampling conducted April 5, 1993, in the Kings Creek Basin are presented in table 13, and locations of the sampling sites are shown in figure 6. Discharge at the HBN station (site 7) was 0.48 m³/s, which is higher than the mean monthly discharge of 0.16 m³/s for the month of April (Putnam and others, 1996). Concentrations of dissolved constituents of tributaries generally were near or less than the median concentrations at the HBN station for the period 1980-95 (table 10). The sum of ions in the basin varied little, ranging from about 11,000 meq/L on South Branch Kings Creek (site 1) to about 12,000 meq/L on North Branch Kings Creek (site 6). The water chemistry in all the tributaries was similar to that at the HBN station and was a calcium bicarbonate type. The percent difference of cations and anions ranged from 0.2 to 1.2 percent, which indicates that unmeasured constituents, such as organic ions, nutrients, and trace metals, do not substantially contribute to the ionic composition of the basin waters.
[Site locations shown in fig. 6; Q, discharge in cubic meters per second; SC, specific conductance in microsiemens per centimeter at 25 degrees Celsius; pH in standard units; Ca, calcium; Mg, magnesium; Na, sodium; K, potassium; Alk, alkalinity; SO4, sulfate; Cl, chloride; NO3, nitrate; SiO2, silica; concentrations in microequivalents per liter, except silica is in micromoles per liter; --, not measured; <, less than; criteria used in selection of sampling sites: LU = land use]
|
Site |
Identification Number |
Q |
SC |
pH |
Ca |
Mg |
Na |
K |
Alk |
SO4 |
Cl |
NO3 |
SiO2 |
Criteria |
|
1 |
390515096350300 |
0.08 |
489 |
8.2 |
4,200 |
1,200 |
160 |
18 |
5,200 |
290 |
25 |
<0.4 |
170 |
LU |
|
2 |
390513096343700 |
.04 |
538 |
8.1 |
4,300 |
1,100 |
160 |
21 |
5,400 |
290 |
23 |
1.6 |
170 |
LU |
|
3 |
390519096343500 |
.01 |
493 |
8.2 |
4,000 |
1,000 |
170 |
24 |
5,000 |
290 |
28 |
1.8 |
170 |
LU |
|
4 |
390529096351700 |
-- |
521 |
8.1 |
4,600 |
1,200 |
160 |
18 |
5,400 |
330 |
31 |
<.4 |
170 |
LU |
|
5 |
390604096352900 |
.22 |
539 |
8.2 |
4,200 |
1,200 |
170 |
20 |
5,300 |
350 |
31 |
<.4 |
170 |
LU |
|
6 |
390606096352900 |
.16 |
543 |
8.2 |
4,400 |
1,300 |
210 |
23 |
5,300 |
500 |
45 |
.7 |
180 |
LU |
|
7 |
06879650 |
.48 |
543 |
8.1 |
4,400 |
1,300 |
190 |
21 |
5,300 |
460 |
37 |
1.2 |
180 |
-- |
The low variability of the water quality at the sampling sites is due to the small size of the Kings Creek Basin and the homogeneity of the geology and soils. The subbasins do have different burn and grazing practices. The
 |
Researchers have reported on other factors that affected nitrogen concentrations in prairie stream waters of the Konza Prairie Research Natural Area. Seasonal fluctuations were studied by McArthur and others (1985). They reported less nitrogen is exported from the basin during the summer growing season compared to fall or spring. Nitrate concentrations also responded to diurnal variations; the lowest concentrations tended to occur during daylight hours, corresponding to photosynthetic activity (McArthur and others, 1985). Tate (1990) reported that changes in flow characteristics influenced nitrate concentrations in the basin; nitrate concentrations were higher when the intermittent channels began to flow, then decreased as flow continued.
Bailey, Robert G., 1995, Descriptions of the ecoregions of the United States: U.S. Department of Agriculture, Forest Service, Miscellaneous Publication 1391, 108 p.
Fenneman, N.M., 1946, Physical divisions of the United States: Washington, D.C., U.S. Geological Survey special map, scale 1:7,000,000.
Gilliam, F.S., 1987, The chemistry of wet deposition for a tallgrass prairie ecosystem-Inputs and interactions with plant canopies: Biogeochemistry, v. 4, p. 203-217.
Helgesen, J.O., ed., 1996, Surface-water-quality assessment of the lower Kansas River basin, Kansas and Nebraska-Results of investigations 1987-90: U.S. Geological Survey Water-Supply Paper 2451, 129 p.
Jewett, J.M., 1941, The geology of Riley and Geary Counties, Kansas: State Geological Survey of Kansas Bulletin 39.
Knapp, A.K., Briggs, J.M., Hartnett, D.C., and Collins, S.L, eds., 1998, Grassland dynamics-Long-term ecological research in tallgrass prairie: Oxford University, 386 p.
Lynch, J.A., Bowersox, V.C., and Grimm, J.W., 1995, Trends in precipitation chemistry in the United States-A national perspective, 1980-92: Atmospheric Environment, v. 29, no. 11. p. 1231-1246.
McArthur, J.V., Gurtz, M.E., Tate, C.M., and Gilliam, F.S., 1985, The interaction of biological and hydrological phenomena that mediate the qualities of water draining native tallgrass prairie on the Konza Prairie Research Natural Area, in Perspectives on nonpoint source pollution: Kansas City, Proceedings of a National Conference, U.S. Environmental Protection Agency 440/5-85-001, p. 478-82.
National Atmospheric Deposition Program/National Trends Network, 1996, NADP/NTN Wet deposition in the United States, 1995: Fort Collins, Colorado State University, Natural Resource Ecology Laboratory, 10 p.
National Climatic Data Center, 1996, Summary of the day, CD-ROM: Boulder, Colorado, EarthInfo Incorporated.
Putnam, J.E., Lacock, D.L, Schneider, D.R., Carlson, M.D., and Dague, B.J., 1996, Water resources data, Kansas, water year 1995: U.S. Geological Survey Water-Data Report KS-95-1, 488 p.
Tate, C.M., 1990, Patterns and controls of nitrogen in tallgrass prairie streams: Ecology, v. 71, no. 5, p. 2007-2018.
U.S. Department of Agriculture, 1975b, Soil survey of Riley County and part of Geary County, Kansas: U.S. Department of Agriculture, Soil Conservation Service, 71 p.
a. U.S. Geological Survey topographic maps:
b. Geologic maps:
c. Soil surveys:
Table B-1. NWIS site-identification numbers and site names for water-quality sampling sites.
|
Site |
Identification Number |
Site Name |
|
1 |
390515096350300 |
Watershed N4D |
|
2 |
390513096343700 |
Watershed N1B |
|
3 |
390519096343500 |
Watershed N20B |
|
4 |
390529096351700 |
Watershed N2B |
|
5 |
390604096352900 |
South Branch Kings Creek |
|
6 |
390606096352900 |
North Branch Kings Creek |
|
7 |
06879650 |
Kings Creek near Manhattan, Kansas |
| Back to 1173-C Contents |
This page maintained by Nichole Bisceglia.
Last updated July 31, 2000.