
Hydrologic Benchmark Network Stations in the West-Central U.S. 1963-95 (USGS Circular 1173-C)
|
|
|
|
|
Rock Creek below Horse Creek near International Boundary, Montana (06169500)
Hydrologic Benchmark Network Stations in the West-Central U.S. 1963-95 (USGS Circular 1173-C)
|
|
|
|
|
Rock Creek below Horse Creek near International Boundary, Montana (06169500)
To download a printer friendly PDF version of this information click here.
This report details one of the approximately 50 stations in the Hydrologic Benchmark Network (HBN) described in the four-volume U.S. Geological Survey Circular 1173. The suggested citation for the information on this page is:
|
Clark, M.L., Eddy-Miller, C.A., Mast, M.A., 2000, Environmental characteristics and water-quality of Hydrologic Benchmark Network stations in the West-Central United States, U.S. Geological Survey Circular 1173-C, 115 p. |
All of the tables and figures are numbered as they appear in each circular. Use the navigation bar above to view the abstract, introduction and methods for the entire circular, as well as a map and list of all of the HBN sites. Use the table of contents below to view the information on this particular station.
|
Table of Contents |
| 1. Site Characteristics and Land Use |
| 2. Historical Water Quality Data and Time-Series Trends |
| 3. Synoptic Water Quality Data |
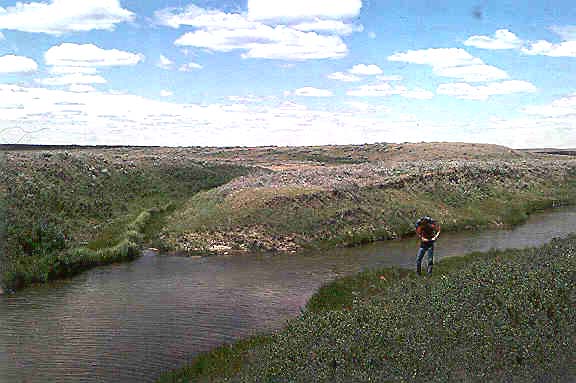
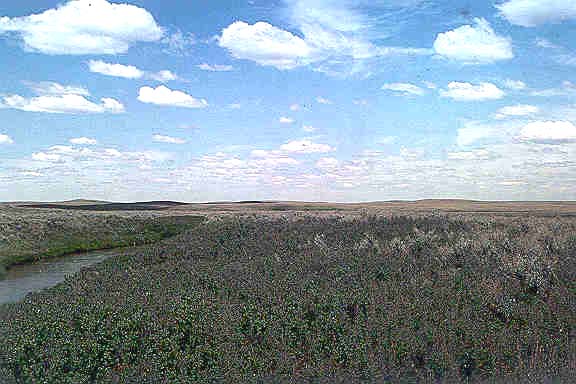
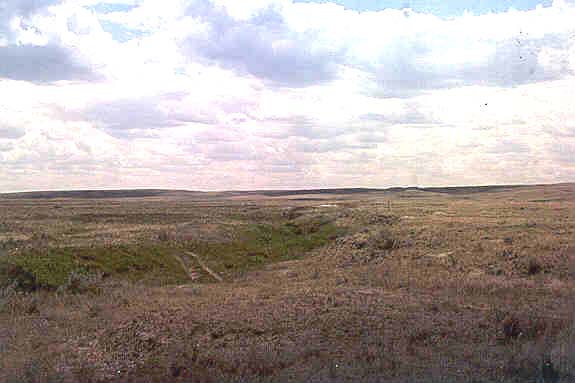
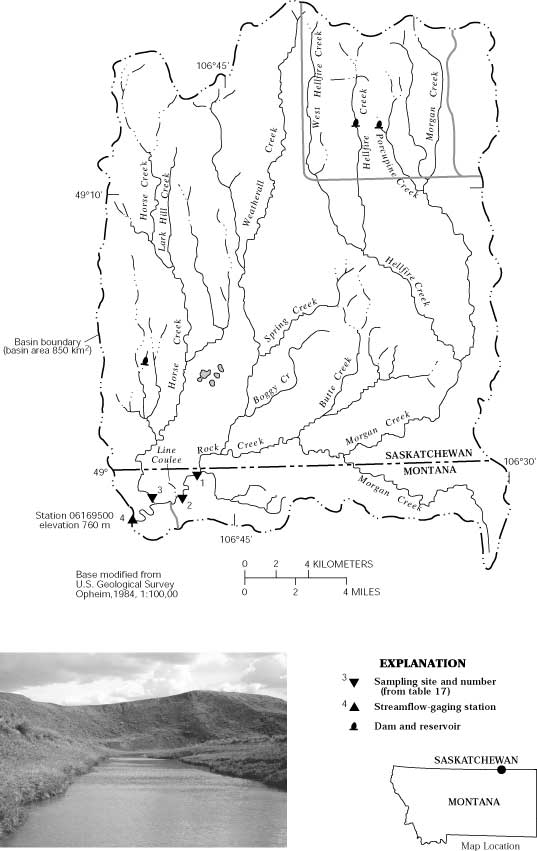
The Rock Creek HBN Basin is a sparsely populated basin in the Great Plains physiographic province
 |
Streams in the Rock Creek Basin mostly are ephemeral or intermittent, including Rock Creek. Rock Creek typically goes dry at times in the late summer and early fall and may not flow during the winter owing to freezing conditions. Snowmelt produces runoff each year during the spring, and thunderstorms produce runoff in most streams during the summer. Thunderstorm activity typically causes increased discharge within a couple days (M.R. Johnson, U.S. Geological Survey, oral commun., 1997). The mean monthly discharges range from 0.01 m³/s in January to 2.5 m³/s in April (Shields and others, 1996). Average annual precipitation at the Opheim 10N weather station (about 34 km southeast of the site) is 29 cm. June is the wettest month, and February is the driest (Parrett and Hull, 1989, p. 2). Average annual runoff is less than 2 cm (Shields and others, 1996). The climate of the basin is typically continental where winters are cold and dry, and summers are hot and moderately dry. Mean monthly temperatures ranged from -13.5×C in January to 18.8×C in July during the period of record, 1959-95 (National Climatic Data Center, 1996).
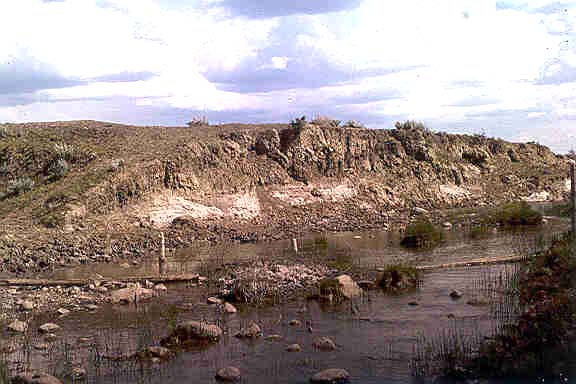
The basin is underlain by gently dipping sedimentary rocks of Mesozoic age and unconsolidated deposits of Cenozoic age (Whitaker and Pearson, 1972, pl. 1). The rocks of Mesozoic age include undifferentiated Cretaceous formations: Frenchman, Whitemud, and Eastend Formations and the Bearpaw Shale (Whitaker and
 |
The HBN station lies within Valley County, Mont.; however, most of the basin is within the Canadian Province of Saskatchewan. The Canadian part of the basin is designated as the Provincial Grasslands Park. Some of the land in the U.S. part of the basin is privately owned and some is administered by the Bureau of Land Management. Access is by way of a few light-duty roads and several unimproved roads. Access may be restricted across private holdings. Land use in the basin primarily is cattle grazing, with some hay and small grain production. Recreational use is limited to hunting in the fall. There are several minor diversions on Rock Creek and the tributary streams for irrigation and stock ponds.
The data set analyzed for the Rock Creek HBN station includes 91 water-quality samples that were collected from March 1977 to August 1995. Sampling frequency is described on the basis of water year, which begins on October 1 and ends on September 30. Sampling frequency was at its peak during 1979-82 when an average of 10 samples were collected per year. The typical sampling frequency for this site, with the exception of the 1979-82 period, was about three samples per year. Samples were analyzed at the USGS NWQL in Arvada, Colo. The period of record for discharge is from water year 1916 to 1926, and from 1956 to current year (2000).
Data quality was checked using ion balances and time-series plots. Calculated ion balances for samples with complete major-ion analyses are shown in
 |
The reason for the higher scatter of nitrate data up to about 1985 could not be isolated. The step-pattern observed in the nitrate data around 1992 reflects a change to a lower minimum laboratory reporting level. Changes were made in meters and electrodes used for field pH determinations during the study period. When changes in methods or instrumentation result in improved precision or elimination of measurement bias, time-series data can exhibit less scatter or a directional shift, respectively. The time-series data, therefore, may reflect the method or instrument change rather than an environmental change.
The median and range of major-ion concentrations in stream water collected at the Rock Creek HBN station and VWM concentrations in wet precipitation measured at the Give Out Morgan NADP station are presented in table 14. The NADP station is 190 km southeast of the HBN station. Precipitation chemistry at the NADP station was dilute and slightly acidic with a VWM pH of 5.3 from 1982 to 1995. The dominant cations in precipitation were ammonium, 34 percent, and calcium, 32 percent. The dominant anions in precipitation were sulfate, 55 percent, and nitrate, 37 percent. A high proportion of nitrate in precipitation in some western areas has been attributed to exhaust from cars and other vehicles in urban areas and agricultural activity in the Great Plains States (National Atmospheric Deposition Program/ National Trends Network, 1997).
[Parameters in units of microequivalents per liter, except for discharge in cubic meters per second, specific conductance in microsiemens per centimeter at 25 degrees Celsius, pH in standard units, and silica in micromoles per liter; n, number of stream samples; VWM, volume-weighted mean; spec. cond., specific conductance; --, not reported; <, less than]
|
Parameter |
Stream Water |
Precipitation VWM |
|||||
|
Minimum |
First quartile |
Median |
Third quartile |
Maximum |
n |
||
| Discharge |
<0.001 |
0.03 |
0.06 |
0.37 |
56 |
91 |
-- |
| Spec. cond., field |
90 |
750 |
1,220 |
1,560 |
2,380 |
91 |
-- |
| pH, field |
6.9 |
8.1 |
8.5 |
8.7 |
9.3 |
90 |
5.3a |
| Calcium |
240 |
950 |
1,400 |
1,800 |
3,600 |
87 |
15 |
| Magnesium |
210 |
1,200 |
2,300 |
2,900 |
4,100 |
87 |
5.7 |
| Sodium |
570 |
5,700 |
10,000 |
13,000 |
20,000 |
87 |
4.0 |
| Potassium |
90 |
190 |
210 |
250 |
310 |
89 |
1.5 |
| Ammonium |
<.7 |
1.4 |
4.3 |
7.9 |
36 |
60 |
16 |
| Alkalinity, laboratory |
780 |
5,600 |
9,000 |
11,000 |
16,000 |
90 |
-- |
| Sulfate |
140 |
2,500 |
4,400 |
6,500 |
12,000 |
89 |
21 |
| Chloride |
31 |
90 |
130 |
200 |
590 |
89 |
3.1 |
| Nitrite plus nitrate |
<.7 |
<.7 |
<7.1 |
7.1 |
51 |
72 |
14b |
| Silica |
8.2 |
58 |
120 |
180 |
340 |
87 |
-- |
a Laboratory pH.
b Nitrate only.
The stream water at the Rock Creek HBN station is a sodium bicarbonate type. The sum of ion concentrations ranged from about 2,300 to about 49,000 meq/L. Alkalinity ranged from 780 to 16,000 meq/L. Bicarbonate was the primary contributor to alkalinity at this station and accounted for 66 percent of the median anion concentration. Sodium accounted for 72 percent of median cation concentration in stream water. Wide
 |
Correlations among dissolved constituents and stream discharge were determined for Rock Creek (table 15). Base cations and anions were inversely correlated with discharge. These results are consistent with a hydrologic system where base-flow chemistry that is dominated by ground water is diluted during periods of increased discharge. Ion concentrations in ground water tend to be greater than in surficial sources because the contact time with rocks and minerals is longer. The correlations with discharge, however, were not always strong. Some increases in discharge may be associated with temporary increases in dissolved-solids concentrations because salts that have accumulated in the soil are flushed out during the initial phases of melting of snow, thawing of frozen ground, or rainfall events. The strongest correlation among cations was between magnesium and sodium (rho value = 0.881). The strongest solute correlation was between sodium and sulfate (rho value = 0.969). Strong correlations also were found between sodium and alkalinity (rho value = 0.906), magnesium and alkalinity (rho value = 0.927), magnesium and sulfate (rho value = 0.835), and sodium and chloride (rho value = 0.777). These data reflect an abundance of various mineral salts in the basin.
[Q, discharge; Ca, calcium; Mg, magnesium; Na, sodium; K, potassium; Alk, alkalinity; SO4, sulfate; Cl, chloride; SiO2, silica; --, not applicable]
|
|
Q |
pH |
Ca |
Mg |
Na |
K |
Alk |
SO4 |
Cl |
| pH |
-0.639 |
-- |
-- |
-- |
-- |
-- |
-- |
-- |
-- |
| Ca |
-.173 |
-0.048 |
-- |
-- |
-- |
-- |
-- |
-- |
-- |
| Mg |
-.540 |
.379 |
0.668 |
-- |
-- |
-- |
-- |
-- |
-- |
| Na |
-.702 |
.485 |
.435 |
0.881 |
-- |
-- |
-- |
-- |
-- |
| K |
-.570 |
.316 |
.331 |
.620 |
0.714 |
-- |
-- |
-- |
-- |
| Alk |
-.649 |
.455 |
.569 |
.927 |
.906 |
0.664 |
-- |
-- |
-- |
| SO4 |
-.652 |
.473 |
.431 |
.835 |
.969 |
.689 |
0.832 |
-- |
-- |
| Cl |
-.577 |
.343 |
.449 |
.691 |
.777 |
.602 |
.739 |
0.754 |
-- |
| SiO2 |
.346 |
-.624 |
.394 |
-.173 |
-.329 |
-.164 |
-.162 |
-.350 |
-0.064 |
Results of the seasonal Kendall test for trends in discharge and major dissolved constituents for Rock Creek during the period of 1978 through 1995 are presented in table 16. Statistically significant upward trends (a = 0.01) were detected in pH and alkalinity for unadjusted concentrations. The alkalinity trend was no longer detected once the concentrations were adjusted for discharge, indicating that the trend was likely a function of streamflow conditions rather than changing water-quality conditions in the basin. The upward trend in pH remained after flow adjustment. A significant downward trend in sulfate concentrations also was detected in the flow-adjusted data. These trends in stream-water chemistry correspond with trends detected by Lynch and others (1995) for precipitation chemistry at an NADP station in western Montana during the period 1980-92. Lins (1987) reported that monthly sulfur-dioxide emissions in Montana decreased by 47 percent between 1975 and 1984. After accounting for evapotranspiration, stream-water sulfate concentrations were about 10 times greater than precipitation sulfate contributions, making it difficult to attribute stream-water trends only to changes in precipitation chemistry. The sulfate concentrations may have been slightly affected by sulfate method changes in 1982, which corresponds with the change from a methylthymol blue procedure to a turbidimetric titration method (U.S. Geological Survey Office of Water Quality Technical Memorandum No. 83.07, 1983), and 1990, which corresponds with the change from turbidimetric titration to an ion-exchange chromatography analytical method (U.S. Geological Survey Office of Water Quality Technical Memorandum No. 90.04, 1989; U.S. Geological Survey Office of Water Quality Technical Memorandum No. 90.13, 1990). The method changes, however, were more likely to have a higher impact on water with low sulfate concentrations.
[Trends in units of microequivalents per liter per year, except for discharge in cubic meters per second per year, pH in standard units per year, and silica in micromoles per liter per year; p-value, attained significance level; --, not calculated; <, less than]
|
Parameter |
Unadjusted |
Flow adjusted |
||
|
Trend |
p-value |
Trend |
p-value |
|
| Discharge |
-0.09 |
0.088 |
-- |
-- |
| pH |
.04 |
<.001 |
0.02 |
0.001 |
| Calcium |
<.01 |
.748 |
-4 |
.671 |
| Magnesium |
20 |
.365 |
-8 |
.339 |
| Sodium |
30 |
.471 |
-100 |
.151 |
| Potassium |
<.01 |
.840 |
-.4 |
.688 |
| Alkalinity |
100 |
.003 |
40 |
.369 |
| Sulfate |
-40 |
.130 |
-100 |
.005 |
| Chloride |
-.8 |
.662 |
-2 |
.234 |
| Nitrite plus nitrate |
.1a |
.565 |
-- |
-- |
| Silica |
<.01 |
.999 |
(b) |
-- |
a Trend test for highly censored data was used.
b Concentration-flow model not significant at a = 0.10.
Results of a surface-water synoptic sampling conducted June 9 and 10, 1993, in the Rock Creek Basin are shown in table 17, and locations of the sampling sites are shown in figure 8. All sampling sites are south of the international border, in the southwestern part of the basin, and may not be representative of waters in the upper basin. Discharge at the HBN station (site 4) was 0.020 m³/s, which is less than the historical mean monthly discharge of 0.34 m³/s for the month of June (Shields and others, 1996). The discharge measured is more typical of streamflow conditions that occur in winter than in June.
[Site locations shown in fig. 8; Q, discharge in cubic meters per second; SC, specific conductance in microsiemens per centimeter at 25 degrees Celsius; pH in standard units; Ca, calcium; Mg, magnesium; Na, sodium; K, potassium; Alk, alkalinity; SO4, sulfate; Cl, chloride; NO3, nitrate; SiO2, silica; concentrations in microequivalents per liter, except silica is in micromoles per liter; --, not measured; <, less than; criteria used in selection of sampling sites: TRIB = major tributary]
|
Site |
Identification number |
Q |
SC |
pH |
Ca |
Mg |
Na |
K |
Alk |
SO4 |
Cl |
NO3 |
SiO2 |
Criteria |
|
1 |
485949106463900 |
0.022 |
1,260 |
8.9 |
1,100 |
2,500 |
10,000 |
200 |
10,000 |
3,800 |
76 |
<0.4 |
8.5 |
TRIB |
|
2 |
485858106473500 |
.020 |
1,330 |
9.0 |
950 |
2,700 |
11,000 |
230 |
11,000 |
4,200 |
79 |
<.4 |
13 |
TRIB |
|
3 |
485856106492600 |
.020 |
713 |
8.5 |
1,400 |
1,200 |
4,300 |
280 |
4,400 |
3,100 |
60 |
.5 |
9.3 |
TRIB |
|
4 |
06169500 |
.020 |
1,430 |
8.9 |
1,100 |
2,600 |
11,000 |
240 |
12,000 |
4,400 |
120 |
2.1 |
28 |
-- |
The water type of the main-stem sites (sites 1, 2, and 4) and Horse Creek tributary (site 3) was sodium bicarbonate. Concentrations of dissolved constituents for the three main-stem sites (sites 1, 2, and 4) and one tributary (site 3) generally were within the range of historical values recorded at the HBN station for the period 1977-95 (table 14). The sum of ions ranged from about 15,000 meq/L on Horse Creek (site 3) to about 31,000 meq/L at the HBN station (site 4). Sodium carbonate salts contribute less to the ion composition of the water of Horse Creek than Rock Creek, as indicated by the percentages of contributions from major ions. Sodium constituted about 60 percent of cation concentration in the Horse Creek sample compared to about 73 percent in the Rock Creek samples. Bicarbonate constituted about 58 percent of the anion concentration in the Horse Creek sample compared to about 73 percent in the samples from Rock Creek. After adjusting for the effects of evapotranspiration, precipitation only contributes part of the salt-forming anions. Sulfate contributions from precipitation ranged from about 10 percent (site 4) to about 13 percent (site 3). This indicates that sources for sulfate occur in both Horse Creek and Rock Creek drainages. Chloride contributions from precipitation range from about 53 percent (site 4) to nearly 100 percent (site 3). Discharge and lower ion concentrations in Horse Creek did not appear to have any dilution effects on Rock Creek as ion concentrations increased between sites 2 and 4. Precipitation chemistry probably can account for nitrate concentrations at all four synoptic sites.
Bailey, Robert G., 1995, Descriptions of the ecoregions of the United States: U.S. Department of Agriculture, Forest Service, Miscellaneous Publication 1391, 108 p.
Biesecker, J.E., and Leifeste, D.K., 1975, Water quality of hydrologic benchmarks-An indicator of water quality in the natural environment: U.S. Geological Survey Circular 460-E, 21 p.
Colton, R.B., Whitaker, S.T., and Ehler, W.C., 1989, Geologic map of the Opheim 1× ¥ 30' quadrangle, Valley and Daniels Counties, Montana: U.S. Geological Survey Open-File Report 89-319, 10 p., scale 1:100,000.
Deer, W.A., Howie, R.A., and Zussman, J., 1966, An introduction to the rock-forming minerals: England, Longman Group Limited, 528 p.
Fenneman, N.M., 1946, Physical divisions of the United States: Washington, D.C., U.S. Geological Survey special map, scale 1:7,000,000.
Hem, J.D., 1992, Study and interpretation of the chemical characteristics of natural water: U.S. Geological Survey Water-Supply Paper 2254, 263 p.
Lins, H.F., 1987, Trend analysis of monthly sulfur dioxide emissions in the conterminous United States, 1975-1984: Atmospheric Environment, v. 21, no.11, p. 2297-2309.
Lynch, J.A., Bowersox, V.C., and Grimm, J.W., 1995, Trends in precipitation chemistry in the United States-A national perspective, 1980-92: Atmospheric Environment, v. 29, no. 11. p. 1231-1246.
National Atmospheric Deposition Program/National Trends Network, 1996, NADP/NTN Wet deposition in the United States, 1995: Fort Collins, Colorado State University, Natural Resource Ecology Laboratory, 10 p.
National Climatic Data Center, 1996, Summary of the day, CD-ROM: Boulder, Colorado, EarthInfo Incorporated.
Parrett, Charles, and Hull, J.A., 1989, Streamflow characteristics of small tributaries of Rock Creek, Milk River Basin, Montana, base period water years 1983-87: U.S. Geological Survey Water-Resources Investigations Report 89-4206, 10 p.
Shields, R.R., White, M.K., Ladd, P.B., and Chambers, C.L., 1996, Water resources data, Montana, water year 1995: U.S. Geological Survey Water-Data Report MT-95-1, 521 p.
U.S. Department of Agriculture, 1984b, Soil survey of Valley County, Montana: U.S. Department of Agriculture, Soil Conservation Service, 102 p.
U.S. Geological Survey, 1983, Analytical methods-Sulfate determinations: Office of Water Quality Technical Memorandum No. 83.07, accessed December 27, 1999, at URL http://water.usgs.gov/admin/memo/.
U.S. Geological Survey, 1989, Analytical methods-Turbidimetric sulfate method: Office of Water Quality Technical Memorandum No. 90.04, accessed December 27, 1999, at URL http://water.usgs.gov/admin/memo/.
U.S. Geological Survey, 1990, Programs and plans-National water-quality networks FY1991: Office of Water Quality Technical Memorandum No. 90.13, accessed December 27, 1999, at URL http://water.usgs.gov/admin/memo/.
Whitaker, S.H., and Pearson, D.E., 1972, Geological map of Saskatchewan: Province of Saskatchewan, Department of Mineral Resources and Saskatchewan Research Council, 1 pl.
a. U.S. Geological Survey topographic maps:
b. Geologic maps:
c. Soil surveys:
d. Other maps:
Table B-1. NWIS site-identification numbers and site names for water-quality sampling sites.
|
Site |
Identification Number |
Site Name |
|
1 |
485949106463900 |
Rock Creek below International Boundary |
|
2 |
485858106473500 |
Rock Creek above Line Coulee |
|
3 |
485856106492600 |
Horse Creek above confluence with Rock Creek |
|
4 |
06169500 |
Rock Creek below Horse Creek near International Boundary, Montana |
| Back to 1173-C Contents |
This page maintained by Nichole Bisceglia.
Last updated July 31, 2000.