
Hydrologic Benchmark Network Stations in the West-Central U.S. 1963-95 (USGS Circular 1173-C)
|
|
|
|
|
Rio Mora near Tererro, New Mexico (08377900)
Hydrologic Benchmark Network Stations in the West-Central U.S. 1963-95 (USGS Circular 1173-C)
|
|
|
|
|
Rio Mora near Tererro, New Mexico (08377900)
To download a printer friendly PDF version of this information click here.
This report details one of the approximately 50 stations in the Hydrologic Benchmark Network (HBN) described in the four-volume U.S. Geological Survey Circular 1173. The suggested citation for the information on this page is:
|
Clark, M.L., Eddy-Miller, C.A., Mast, M.A., 2000, Environmental characteristics and water-quality of Hydrologic Benchmark Network stations in the West-Central United States, U.S. Geological Survey Circular 1173-C, 115 p. |
All of the tables and figures are numbered as they appear in each circular. Use the navigation bar above to view the abstract, introduction and methods for the entire circular, as well as a map and list of all of the HBN sites. Use the table of contents below to view the information on this particular station.
|
Table of Contents |
| 1. Site Characteristics and Land Use |
| 2. Historical Water Quality Data and Time-Series Trends |
| 3. Synoptic Water Quality Data |
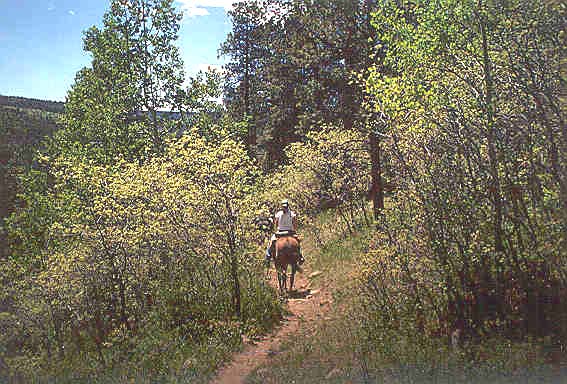
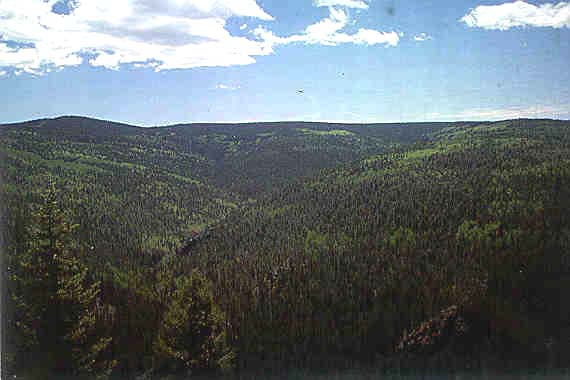
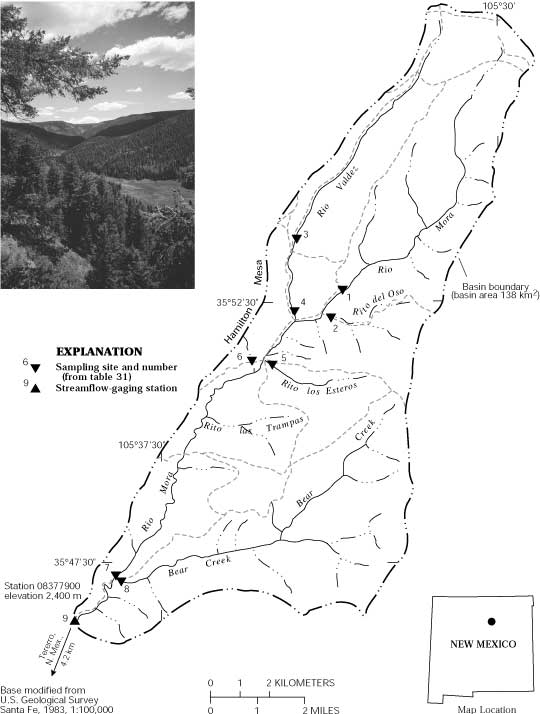
The Rio Mora HBN Basin is in the Southern Rocky Mountains physiographic province (Fenneman, 1946) in northern New Mexico (Figure 15. Map showing study area in the Rio Mora Basin and photograph of the landscape in the upper part of the basin). The HBN station is 4.2 km north of Tererro, N. Mex., at a latitude of 35×46'38'' and longitude
 |
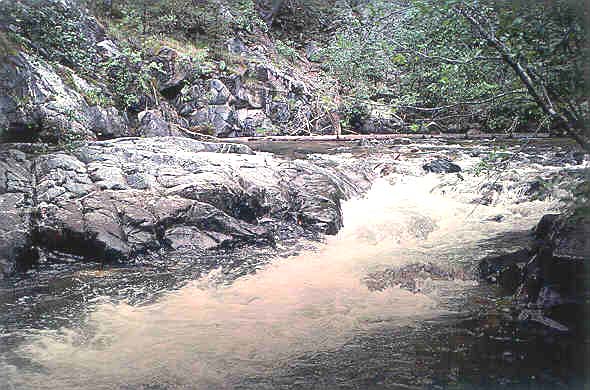
The Rio Mora is a perennial stream with mean monthly discharges that range from 0.17 m³/s in January to 3.6 m³/s in May (Ortiz and Lange, 1996). Average annual precipitation at the Tererro weather station, which is at an elevation about 120 m lower than the HBN station, is 45 cm. Precipitation in the basin increases with increasing elevation. The snowpack usually accumulates from December to late February. Average annual runoff is about 20 cm (Ortiz and Lange, 1996). Mean monthly temperatures ranged from -2.2×C in January to 15.8×C in July during the period of record, 1948-61 (National Climatic Data Center, 1996).
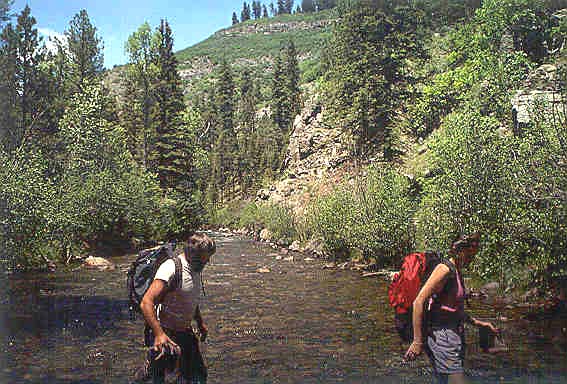 |
The Rio Mora HBN station is in San Miguel County. The Rio Mora HBN Basin lies almost entirely within the Santa Fe National Forest except for a small, privately owned area near the HBN station. About 90 percent of the basin lies within the Pecos Wilderness Area. Access to the HBN station, during both summer and winter, is by an improved dirt road. An unimproved road continues upstream, past the HBN station. The rest of the basin is accessed primarily by a series of pack trails. Because most of the basin is within a designated wilderness area, access is restricted to foot trails and horseback. Recreation and grazing are the predominant land uses. Recreational activities in the basin include backcountry hiking, camping, hunting, and cross-country skiing.
The data set analyzed for the Rio Mora HBN station includes 201 water-quality samples that were collected from November 1962 to August 1995. Sampling frequency is described on the basis of water year, which begins on October 1 and ends on September 30. Sampling frequency was variable; 1 sample was collected in water year 1963 and between 5 to 14 samples were collected between water years 1964 to 1975. From 1976 to 1982, sampling frequency was bimonthly and was reduced to quarterly from 1983 to 1995. Samples were analyzed at the USGS New Mexico District water-quality laboratory until early 1970. From early 1970 through 1973, samples were analyzed at the USGS water-quality laboratory in Salt Lake City, Utah. After 1973, with the creation of the USGS Central Laboratory System, all samples were analyzed at the water-quality laboratory (now called NWQL) in Arvada, Colo. The period of record for discharge is from water year 1964 to current year (2000).
Data quality was checked using ion balances and time-series plots. Calculated ion balances for samples with complete major-ion analyses are shown in Figures 16a and 16b. Temporal variation of discharge, field pH, major dissolved constituents, and ion balance at Rio Mora, New Mexico. More than 90 percent of the samples had ion balances within the ±5 percent range, indicating that the major-ion analytical results generally were of good quality and that unmeasured constituents, such as organic anions, nutrients, and trace metals, do not contribute substantially to the ion composition of the stream water. Time-series plots of ion concentrations were inspected for evidence of influences that are related to analytical method changes (fig. 16). A small decrease in scatter of sulfate concentrations after 1982 corresponds with the change
 |
The median and range of major-ion concentrations in the stream water collected at the Rio Mora HBN station and the VWM concentrations in wet precipitation measured at the Bandelier National Monument NADP station are presented in table 28. The NADP station is about 68 km west of the HBN station. Precipitation chemistry at the NADP station is dilute and slightly acidic with a VWM pH of 5.0 during the period of record, 1982-95. The dominant cation in precipitation was calcium, which contributed about 32 percent of the total cation concentration; hydrogen contributed about 29 percent and ammonium contributed about 23 percent. Sulfate, the dominant anion in precipitation, contributed about 54 percent of the total anion concentration; nitrate contributed about 39 percent of the total anion concentration. A high proportion of nitrate in precipitation in the Rocky Mountains has been attributed to exhaust from cars and other vehicles in urban areas and agricultural activity in the Great Plains States (National Atmospheric Deposition Program/National Trends Network, 1997).
[Parameters in units of microequivalents per liter, except for discharge in cubic meters per second, specific conductance in microsiemens per centimeter at 25 degrees Celsius, pH in standard units, and silica in micromoles per liter; n, number of stream samples; VWM, volume-weighted mean; spec. cond., specific conductance; --, not reported; <, less than]
|
Parameter |
Stream Water |
Precipitation VWM |
|||||
|
Minimum |
First quartile |
Median |
Third quartile |
Maximum |
n |
||
| Discharge |
0.03 |
0.19 |
0.42 |
0.91 |
9.3 |
200 |
-- |
| Spec. cond., field |
34 |
86 |
101 |
117 |
223 |
200 |
-- |
| pH, field |
6.5 |
7.3 |
7.6 |
7.9 |
9.0 |
201 |
5.0a |
| Calcium |
150 |
700 |
800 |
950 |
1,800 |
195 |
11 |
| Magnesium |
48 |
110 |
140 |
160 |
300 |
195 |
1.8 |
| Sodium |
26 |
48 |
61 |
74 |
170 |
193 |
2.8 |
| Potassium |
7.7 |
10 |
13 |
15 |
46 |
191 |
.77 |
| Ammonium |
<.7 |
.7 |
2.1 |
4.3 |
18 |
66 |
8.0 |
| Alkalinity, laboratory |
260 |
720 |
860 |
960 |
1,900 |
201 |
-- |
| Sulfate |
21 |
140 |
170 |
210 |
400 |
193 |
18 |
| Chloride |
<2.8 |
11 |
17 |
25 |
180 |
199 |
2.6 |
| Nitrite plus nitrate |
<.7 |
<3.6 |
6.0 |
7.1 |
21 |
86 |
13b |
| Silica |
69 |
92 |
98 |
100 |
150 |
192 |
-- |
a Laboratory pH.
Stream water in the Rio Mora is a slightly alkaline, calcium bicarbonate type. The sum of ion concentrations ranged from about 700 to about 4,500 meq/L. Alkalinity ranged from 260 to 1,900 meq/L, and bicarbonate was the primary contributor to alkalinity at this station. Calcium, the major cation, accounted for about 79 percent of the median cation concentration in stream water; bicarbonate, the major anion, accounted for about 82 percent of the median anion
 |
Correlations among dissolved constituents and discharge were determined for the Rio Mora (table 29). The base cations and anions showed inverse relations with discharge. These results are consistent with a hydrologic system where base-flow chemistry that is dominated by ground water is diluted during periods of increased discharge, including snowmelt runoff. Ion concentrations in ground water tend to be greater than in surficial sources because the contact time with rocks and minerals is longer. Strong correlations existed among the major carbonate ions. Carbonate rocks, including limestone, are common in the basin and are important in controlling the ion composition of the ground- and stream-water chemistry. The calcium-magnesium (rho value = 0.950) calcium-alkalinity correlations (rho value = 0.951) were the highest. The correlation between magnesium and alkalinity was 0.906. A strong correlation (rho value = 0.918) also exists between magnesium and sodium.
[Q, discharge; Ca, calcium; Mg, magnesium; Na, sodium; K, potassium; Alk, alkalinity; SO4, sulfate; Cl, chloride; SiO2, silica; --, not applicable]
|
|
Q |
pH |
Ca |
Mg |
Na |
K |
Alk |
SO4 |
Cl |
| pH |
-0.135 |
-- |
-- |
-- |
-- |
-- |
-- |
-- |
-- |
| Ca |
-.771 |
0.070 |
-- |
-- |
-- |
-- |
-- |
-- |
-- |
| Mg |
-.805 |
.094 |
0.950 |
-- |
-- |
-- |
-- |
-- |
-- |
| Na |
-.792 |
.045 |
.872 |
0.918 |
-- |
-- |
-- |
-- |
-- |
| K |
-.121 |
.110 |
.101 |
.165 |
0.226 |
-- |
-- |
-- |
-- |
| Alk |
-.712 |
-.063 |
.951 |
.906 |
.814 |
0.118 |
-- |
-- |
-- |
| SO4 |
-.593 |
.188 |
.700 |
.681 |
.683 |
.269 |
0.590 |
-- |
-- |
| Cl |
-.230 |
-.020 |
.330 |
.387 |
.319 |
.247 |
.324 |
0.424 |
-- |
| SiO2 |
-.388 |
-.023 |
.683 |
.685 |
.631 |
.136 |
.708 |
.460 |
0.150 |
Results of the seasonal Kendall test for trends in discharge and major dissolved constituents for the Rio Mora from 1965 through 1995 are presented in table 30. Statistically significant upward trends (a = 0.01) occurred in discharge. The trend in discharge is only representative of instantaneous measurements made during water-quality sampling and may not correspond with a trend in the continuous discharge record. Insufficient data existed for nitrate to calculate a trend. The scatter in the time-series plot for nitrate concentrations is a function of a change in the minimum reporting level for the laboratory method about 1991, rather than an environmental change.
[Trends in units of microequivalents per liter per year, except for discharge in cubic meters per second per year, pH in standard units per year, and silica in micromoles per liter per year; p-value, attained significance level; --, not calculated; <, less than]
|
Parameter |
Unadjusted |
Flow adjusted |
||
|
Trend |
p-value |
Trend |
p-value |
|
| Discharge |
0.3 |
0.004 |
-- |
-- |
| pH |
<.01 |
.749 |
(a) |
-- |
| Calcium |
<.01 |
.503 |
1 |
0.317 |
| Magnesium |
<.01 |
.313 |
0.2 |
.436 |
| Sodium |
<.01 |
.661 |
.2 |
.224 |
| Potassium |
<.01 |
.094 |
(a) |
-- |
| Alkalinity |
<.01 |
.525 |
3 |
.013 |
| Sulfate |
-1 |
.006 |
-.7 |
.039 |
| Chloride |
<.01 |
.227 |
(a) |
-- |
| Nitrite plus nitrate |
(b) |
-- |
-- |
-- |
| Silica |
.1 |
.080 |
.2 |
.012 |
a Concentration-flow model not significant at a = 0.10.
b Insufficient data to calculate trend.
A statistically significant downward trend (a = 0.01) occurred in unadjusted concentrations of sulfate. The sulfate trend was no longer detected after the concentrations were flow adjusted for variations in discharge. Trends in sulfate concentrations in New Mexico's surface waters have varied over the study period in other studies. Smith and Alexander (1983) observed an upward trend in flow-adjusted sulfate concentrations and a corresponding downward trend in alkalinity (a = 0.01 to 0.10) for the period late 1960's to 1981 at this station. For the study period 1975-89, downward trends in sulfate were reported at several surface-water stations in New Mexico (U.S. Geological Survey, 1993). The decrease was attributed to reductions in emissions from copper smelters. Lins (1987) reported that sulfur-dioxide emissions in New Mexico decreased by 33 percent for the period 1975-84. Lynch and others (1995) have reported corresponding decreases in precipitation sulfate concentrations for the period 1980-92.
Results of a surface-water synoptic sampling conducted June 18-20, 1991, in the Rio Mora Basin are presented in table 31, and locations of the sampling sites are shown in figure 15. Discharge at the HBN station (site 9) was 1.3 m³/s compared to the mean monthly discharge of 2.5 m³/s for the month of June (Ortiz and Lange, 1996). The sum of ions ranged from 700 (site1) to 2,700 meq/L (site 6); the concentration at the HBN station (site 9) was 1,500 meq/L. Concentrations of dissolved constituents were within the range of concentrations observed at the Rio Mora HBN station for the period of record, 1963-95 (table 28), except for sodium at the Rio Mora site upstream from the pack trail (site 1), which was less than any samples at the HBN station. The concentrations of constituents collected at the HBN station (site 9) during the synoptic sampling generally were less than the first-quartile values reported for the station (table 28). Concentrations of dissolved constituents, except sulfate and nitrate, increased in the downstream direction at sites on the Rio Mora (sites 1, 7, and 9). The water type of samples that were collected throughout the Rio Mora Basin was calcium bicarbonate. Sulfate concentrations were variable in the drainages and ranged from 46 (site 5) to 250 (site 3) meq/L. The percent difference of cations and anions ranged from 2.4 to 7.4 percent, indicating that unmeasured ions do not substantially contribute to the ionic content of the water.
[Site locations shown in fig. 15; Q, discharge in cubic meters per second; SC, specific conductance in microsiemens per centimeter at 25 degrees Celsius; pH in standard units; Ca, calcium; Mg, magnesium; Na, sodium; K, potassium; Alk, alkalinity; SO4, sulfate; Cl, chloride; NO3, nitrate; SiO2, silica; concentrations in microequivalents per liter, except silica is in micromoles per liter; --, not measured; <, less than; criteria used in selection of sampling sites: BG = bedrock geology, TRIB = major tributary]
|
Site |
Identification number |
Q |
SC |
pH |
Ca |
Mg |
Na |
K |
Alk |
SO4 |
Cl |
NO3 |
SiO2 |
Criteria |
|
1 |
355241105333100 |
0.45 |
39 |
7.5 |
270 |
55 |
22 |
9.0 |
270 |
67 |
6.5 |
<0.7 |
75 |
BG |
|
2 |
355216105335100 |
.05 |
92 |
7.8 |
700 |
160 |
74 |
13 |
790 |
200 |
8.7 |
<.7 |
140 |
BG |
|
3 |
355329105343700 |
.18 |
71 |
7.8 |
600 |
88 |
26 |
9.7 |
530 |
250 |
6.2 |
<.7 |
73 |
BG |
|
4 |
355215105323700 |
.26 |
73 |
7.8 |
600 |
100 |
26 |
10 |
560 |
130 |
6.5 |
1.4 |
77 |
TRIB |
|
5 |
355120105350900 |
.09 |
92 |
7.9 |
750 |
120 |
44 |
11 |
770 |
46 |
8.7 |
<.7 |
93 |
BG |
|
6 |
355127105352700 |
-- |
138 |
8.1 |
1,200 |
180 |
52 |
10 |
1,100 |
160 |
5.6 |
<3.6 |
110 |
BG |
|
7 |
354725105383200 |
.91 |
65 |
7.8 |
500 |
88 |
35 |
10 |
490 |
230 |
7.3 |
<.7 |
85 |
TRIB |
|
8 |
354724105383200 |
.19 |
133 |
8.1 |
1,100 |
150 |
52 |
12 |
1,100 |
75 |
8.5 |
<3.6 |
110 |
TRIB |
|
9 |
08377900 |
1.3 |
81 |
7.9 |
650 |
110 |
39 |
11 |
620 |
100 |
8.5 |
<.7 |
92 |
-- |
Tributaries contributing high concentrations of calcium and bicarbonate were Bear Creek (site 8) and the unnamed tributary below Hamilton Mesa (site 6). The tributary below Hamilton Mesa may contain higher concentrations of calcium (1,200 meq/L) and bicarbonate (1,100 meq/L) because it is the only subbasin draining almost entirely sedimentary rocks. The concentrations of calcium (1,100 meq/L) and bicarbonate (1,100 meq/L) at Bear Creek (site 8), which drains sedimentary, igneous, and metamorphic rocks, are more than double the concentrations at the nearby Rio Mora site (site 7) upstream from the mouth of Bear Creek. The influence of Bear Creek on water quality at the Rio Mora HBN station (site 9) is reflected in higher concentrations of calcium, magnesium, and alkalinity, and a lower sulfate concentration compared to the upstream site (site 7). Nitrate concentrations are low in all basins and are characteristic of undeveloped areas (Mueller and others, 1995).
Bailey, Robert G., 1995, Descriptions of the ecoregions of the United States: U.S. Department of Agriculture, Forest Service, Miscellaneous Publication 1391, 108 p.
Fenneman, N.M., 1946, Physical divisions of the United States: Washington, D.C., U.S. Geological Survey special map, scale 1:7,000,000.
Lins, H.F., 1987, Trend analysis of monthly sulfur dioxide emissions in the conterminous United States, 1975-1984: Atmospheric Environment, v. 21, no.11, p. 2297-2309.
Lynch, J.A., Bowersox, V.C., and Grimm, J.W., 1995, Trends in precipitation chemistry in the United States-A national perspective, 1980-92: Atmospheric Environment, v. 29, no. 11. p. 1231-1246.
Moench, R.H., Grambling, J.A., and Robertson, J.M., 1988, Geologic map of the Pecos Wilderness, Santa Fe, San Miguel, Mora, Rio Arriba, and Taos Counties, New Mexico: U.S. Geological Survey Miscellaneous Field Studies Map MF-1921-B, 2 pl., 1:48,000.
Mueller, D.K., Hamilton, P.A., Helsel, D.R., Hitt, K.J., and Ruddy, B.C., 1995, Nutrients in ground water and surface water of the United States-An analysis of data through 1992: U.S. Geological Survey Water-Resources Investigations Report 95-4031, 74 p.
National Atmospheric Deposition Program/National Trends Network, 1997, Inside rain, a look at the National Atmospheric Deposition Program: Fort Collins, Colorado State University, Natural Resource Ecology Laboratory, 24 p.
National Climatic Data Center, 1996, Summary of the day, CD-ROM: Boulder, Colorado, EarthInfo Incorporated.
Ortiz, David, and Lange, K.M., 1996, Water resources data, New Mexico, water year 1995: U.S. Geological Survey Water-Data Report NM-95-1, 629 p.
Smith, R.A., and Alexander, R.B., 1983, Evidence for acid-precipitation-induced trends in stream chemistry at hydrologic benchmark stations: U.S. Geological Survey Circular 910, 12 p.
U.S. Geological Survey, 1983, Analytical methods-Sulfate determinations: Office of Water Quality Technical Memorandum No. 83.07, accessed December 27, 1999, at URL http://water.usgs.gov/admin/memo/
U.S. Geological Survey, 1993, National water summary 1990-91-Hydrologic events and stream water quality: U.S. Geological Survey Water-Supply Paper 2400, 590 p.
U.S. Geological Survey, U.S. Bureau of Mines, New Mexico Bureau of Mines and Mineral Resources, 1980, Mineral resources of the Pecos Wilderness and adjacent areas, Santa Fe, San Miguel, Mora, Rio Arriba, and Taos Counties, New Mexico: U.S. Geological Survey Open-File Report 80-382, 103 p.
a. U.S. Geological Survey topographic maps:
b. Geologic maps:
c. Soil surveys:
No soil survey available.
d. Other maps:
Table B-1. NWIS site-identification numbers and site names for water-quality sampling sites.
|
Site |
Identification Number |
Site Name |
|
1 |
355241105333100 |
Rio Mora above pack trail |
|
2 |
355216105335100 |
Rito del Oso |
|
3 |
355329105343700 |
upper Rio Valdez |
|
4 |
355215105323700 |
Rio Valdez |
|
5 |
355120105350900 |
Rito Los Esteros |
|
6 |
355127105352700 |
tributary below Hamilton Mesa |
|
7 |
354725105383200 |
Rio Mora above Bear Creek |
|
8 |
354724105383200 |
Bear Creek |
|
9 |
08377900 |
Rio Mora near Tererro, New Mexico |
| Back to 1173-C Contents |
This page maintained by Nichole Bisceglia.
Last updated July 31, 2000.