
Hydrologic Benchmark Network Stations in the West-Central U.S. 1963-95 (USGS Circular 1173)
|
|
|
|
|
Bear Den Creek near Mandaree, North Dakota (06332515)
Hydrologic Benchmark Network Stations in the West-Central U.S. 1963-95 (USGS Circular 1173)
|
|
|
|
|
Bear Den Creek near Mandaree, North Dakota (06332515)
To download a printer friendly PDF version of this information click here.
This report details one of the approximately 50 stations in the Hydrologic Benchmark Network (HBN) described in the four-volume U.S. Geological Survey Circular 1173. The suggested citation for the information on this page is:
|
Clark, M.L., Eddy-Miller, C.A., Mast, M.A., 2000, Environmental characteristics and water-quality of Hydrologic Benchmark Network stations in the West-Central United States, U.S. Geological Survey Circular 1173-C, 115 p. |
All of the tables and figures are numbered as they appear in each circular. Use the navigation bar above to view the abstract, introduction and methods for the entire circular, as well as a map and list of all of the HBN sites. Use the table of contents below to view the information on this particular station.
|
Table of Contents |
| 1. Site Characteristics and Land Use |
| 2. Historical Water Quality Data and Time-Series Trends |
| 3. Synoptic Water Quality Data |
 |
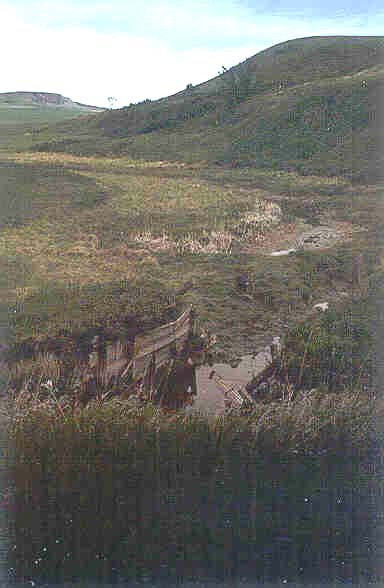
Bear Den Creek is an intermittent stream. At times during the late summer and winter months, little or no flow occurs in the channel. Spring rains produce the highest flows in March and April. Mean monthly discharges range from 0.004 m³/s in December to 1.0 m³/s in March (Harkness and others, 1996). Average annual precipitation at the Keene weather station (17 km northwest of the HBN station) is 39 cm. Most of the precipitation falls as rain in the spring and early summer. Average annual runoff is about 3 cm (Harkness and others, 1996). The climate is characterized by cold winters and mild summers; mean monthly temperatures ranged from -12.3×C in January to 20.5×C in July during the period of record, 1959-95 (National Climatic Data Center, 1996).
The Bear Den Creek Basin is underlain by the Sentinel Butte Formation of Paleocene age. The formation contains
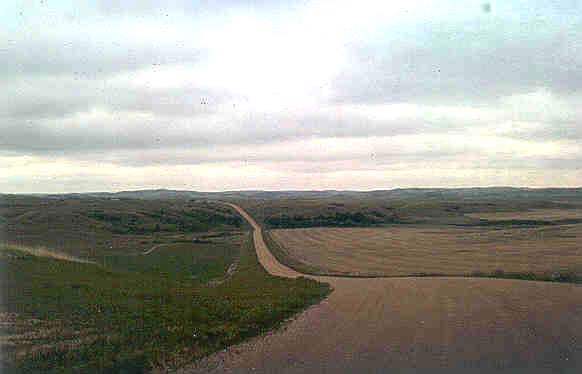 |
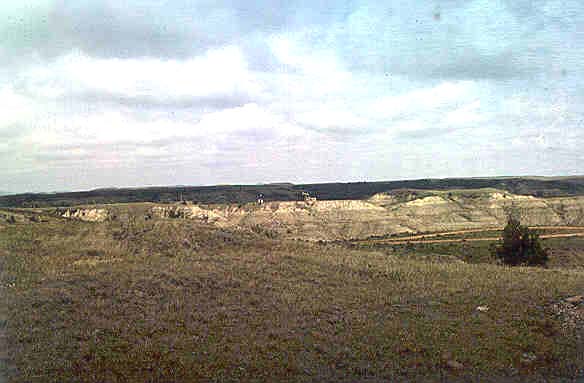
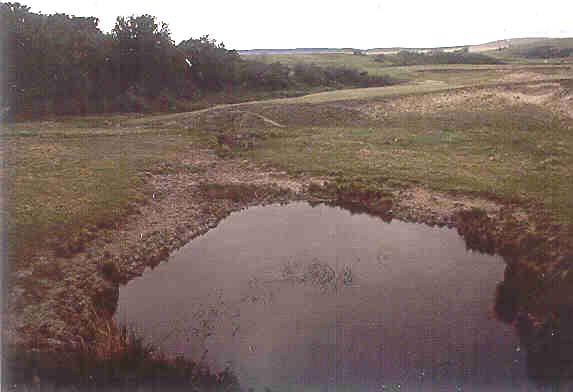
The Bear Den Creek HBN station is in McKenzie County. The Bear Den Creek Basin is 75 percent privately owned, 20 percent is owned by the Fort Berthold Indian Reservation, 2 percent is State land, 2 percent is Federal land, and 1 percent other (Paul Deutsch, Natural Resources Conservation Service, written commun., 1996). Access to the HBN station is by a primitive road off a secondary highway on the Fort Berthold Indian Reservation. The basin is accessible year round, as weather permits. Primitive roads, improved roads, and primary access routes (typically suited for automobile travel) traverse parts of the upper basin. No roads exist in parts of the lower and eastern basin. Land use in the basin is predominantly agriculture, including pastures with cattle and horse grazing in the central and eastern parts and a small amount of cultivation in the western part. Rural residences and stock ponds are present in the basin. An oil and gas field and pipeline associated with oil production is located in the northwest part of the basin (Lawrence, 1987). Oil drilling was active during the 1970's and 1980's (L.L. Rutschke, U.S. Geological Survey, oral commun., 1997). Scoria gravel pits also are present in the basin.
The data set analyzed for the Bear Den Creek HBN station includes 236 water-quality samples that were collected from August 1966 to August 1995. Sampling frequency is described on the basis of water year, which begins on October 1 and ends on September 30. Sampling frequency was variable during the period of record. The most complete data set exists for the period between 1968 and 1981 when 10-14 samples were collected annually. After 1981, sampling frequency decreased; five or six samples were collected in most water years. Samples were analyzed at USGS district water-quality laboratories until the early 1970's. After 1973, with the creation of the USGS Central Laboratory System, all samples were analyzed at the water-quality laboratory (now called NWQL) in Arvada, Colo. The period of record for discharge is from water year 1966 to current year (2000).
 |
The median and range of major-ion concentrations in the stream water collected at the Bear Den Creek HBN station and VWM concentrations in wet precipitation measured at the Theodore Roosevelt National Park NADP station are presented in table 32. The NADP station is about 59 km southwest of the HBN station. Precipitation chemistry at the NADP station is dilute and slightly acidic with VWM pH of 5.3 during the period of record, 1981-95. Ammonium, the dominant cation in precipitation, contributed 37 percent of the total cation concentration, followed by calcium, which contributed 30 percent of the total cation concentration. The dominant anion in precipitation was sulfate, which contributed 57 percent of the total anion concentration, followed by nitrate, which contributed 38 percent of the concentration. Contributions from nitrogen species were less at this site than in precipitation from eastern North Dakota, possibly because the area is farther from the intensive crop activities in the Midwest.
[Parameters in units of microequivalents per liter, except for discharge in cubic meters per second, specific conductance in microsiemens per centimeter at 25 degrees Celsius, pH in standard units, and silica in micromoles per liter; n, number of stream samples; VWM, volume-weighted mean; spec. cond., specific conductance; --, not reported; <, less than]
|
Parameter |
Stream Water |
Precipitation VWM |
|||||
|
Minimum |
First quartile |
Median |
Third quartile |
Maximum |
n |
||
| Discharge | <0.001 | 0.005 | 0.007 | 0.02 | 31 | 236 | -- |
| Spec. cond., field | 192 | 1,950 | 2,650 | 2,900 | 4,600 | 236 | -- |
| pH, field | 6.7 | 8.2 | 8.4 | 8.6 | 9.6 | 233 | 5.3a |
| Calcium | 270 | 1,200 | 1,700 | 2,300 | 3,500 | 235 | 12 |
| Magnesium | 340 | 1,600 | 2,100 | 2,300 | 3,800 | 234 | 4.0 |
| Sodium | 830 | 17,000 | 25,000 | 29,000 | 51,000 | 235 | 3.3 |
| Potassium | 15 | 160 | 190 | 230 | 360 | 235 | .80 |
| Ammonium | <.7 | 1.4 | 3.6 | 7.9 | 27 | 88 | 15 |
| Alkalinity, laboratory | 1,000 | 10,000 | 14,000 | 17,000 | 28,000 | 234 | -- |
| Sulfate | 730 | 11,000 | 15,000 | 16,000 | 27,000 | 236 | 21 |
| Chloride | 2.8 | 93 | 120 | 170 | 1,800 | 235 | 2.2 |
| Nitrite plus nitrate | <.7 | <3.6 | 7.1 | 8.3 | 59 | 124 | 14b |
| Silica | 10 | 110 | 160 | 200 | 380 | 235 | -- |
a Laboratory pH.
b Nitrate only.
Stream water in Bear Den Creek is a sodium sulfate-bicarbonate type. The sum of ion concentrations ranged from about 3,800 to about 100,000 meq/L. Alkalinity ranged from 1,000 to 28,000 meq/L, and bicarbonate is the primary contributor to alkalinity at this station. The dominant cation in the stream water was sodium, which accounted for 86 percent of the median cation concentration. The sodium concentrations were over 10 times greater than the calcium or magnesium concentrations. Wide ranges of sodium can occur in natural waters because high concentrations of sodium can be reached before any precipitate is formed (Hem, 1992, p. 101). Potassium concentrations were high, which probably reflect the weathering of the clay materials in the basin (Deer and others, 1966). Dissolved solids at this HBN station were
 |
Correlations among dissolved constituents and discharge were determined for Bear Den Creek (table 33). The base cations and anions showed weak and mixed, positive and inverse relations with discharge. The average annual runoff is very low, which indicates that dilution of stream waters from precipitation is not a substantial process in the basin on an annual basis. Dilution from precipitation may be important, however, on an event basis. Some increases in discharge may be associated with temporary increases in dissolved-solids concentrations because salts that have accumulated in the soil are flushed out during the initial phases of the melting of snow, thawing of frozen ground, or rainfall events. Strong correlations were between sodium and alkalinity (rho value = 0.903) and sodium and sulfate (rho value = 0.869). Magnesium also was correlated with sodium, alkalinity, and sulfate. These relations, as well as the high concentrations of these constituents, indicate that dissolution of sodium- and magnesium-rich carbonate and sulfate salts contributes to the ion composition of the stream water.
[Q, discharge; Ca, calcium; Mg, magnesium; Na, sodium; K, potassium; Alk, alkalinity; SO4, sulfate; Cl, chloride; SiO2, silica; --, not applicable]
|
|
Q |
pH |
Ca |
Mg |
Na |
K |
Alk |
SO4 |
Cl |
| pH |
-0.410 |
-- |
-- |
-- |
-- |
-- |
-- |
-- |
-- |
| Ca |
.080 |
-0.301 |
-- |
-- |
-- |
-- |
-- |
-- |
-- |
| Mg |
-.295 |
.056 |
0.485 |
-- |
-- |
-- |
-- |
-- |
-- |
| Na |
-.538 |
.299 |
.107 |
0.667 |
-- |
-- |
-- |
-- |
-- |
| K |
.195 |
-.057 |
-.143 |
-.168 |
-0.291 |
-- |
-- |
-- |
-- |
| Alk |
-.637 |
.214 |
.135 |
.637 |
.903 |
-0.388 |
-- |
-- |
-- |
| SO4 |
-.431 |
.299 |
.250 |
.735 |
.869 |
-.121 |
0.717 |
-- |
-- |
| Cl |
.002 |
-.197 |
.111 |
.079 |
.027 |
.192 |
-.008 |
0.036 |
-- |
| SiO2 |
.124 |
-.508 |
.621 |
.181 |
-.076 |
-.167 |
.067 |
-.054 |
0.041 |
Results of the seasonal Kendall test for trends in discharge and major dissolved constituents for Bear Den Creek from 1967 through 1995 are presented in table 34. The only statistically significant trend (a = 0.01) was an increase in unadjusted pH values. The flow-adjusted model did not predict a significant trend in pH, indicating variations in discharge may be controlling the hydrogen concentrations. Other trends in regional precipitation chemistry may be difficult to detect at this HBN station because, even after accounting for evapotranspiration, precipitation concentrations of base cations and anions were very small compared to stream-water concentrations of these constituents.
[Trends in units of microequivalents per liter per year, except for discharge in cubic meters per second per year, pH in standard units per year, and silica in micromoles per liter per year; p-value, attained significance level; --, not calculated; <, less than]
|
Parameter |
Unadjusted |
Flow adjusted |
||
|
Trend |
p-value |
Trend |
p-value |
|
| Discharge |
<0.01 |
0.064 |
-- |
-- |
| pH |
.01 |
.004 |
<0.01 |
0.091 |
| Calcium |
<.01 |
.767 |
-3 |
.704 |
| Magnesium |
9 |
.033 |
4 |
.263 |
| Sodium |
100 |
.145 |
-36 |
.454 |
| Potassium |
-1 |
.025 |
-.5 |
.277 |
| Alkalinity |
59 |
.072 |
-37 |
.075 |
| Sulfate |
11 |
.654 |
-32 |
.224 |
| Chloride |
-.9 |
.197 |
-.6 |
.441 |
| Nitrite plus nitrate |
.2a |
.071 |
-- |
-- |
|
Silica |
-1 |
.048 |
-1 |
.023 |
a Trend test for highly censored data was used.
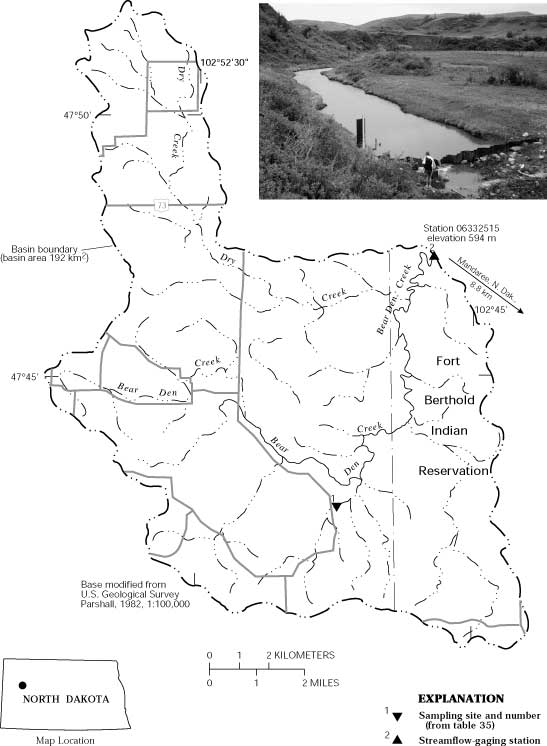
Results of a surface-water synoptic sampling event conducted on June 6, 1993, in the Bear Den Creek Basin are presented in table 35, and locations of the sampling sites are shown in figure 17. Discharge at the HBN station (site 2) was 0.03 m³/s, which is slightly less than the mean monthly discharge of 0.08 m³/s for the month of June (Harkness and others, 1996). Bear Den Creek typically starts to go dry about this time of year. Although a rain event occurred 1 day prior to the synoptic sampling, most of the ephemeral tributaries were dry during the synoptic sampling. One unnamed tributary in the south part of the drainage was sampled, but it was not measurably flowing.
[Site locations shown in fig. 17; Q, discharge in cubic meters per second; SC, specific conductance in microsiemens per centimeter at 25 degrees Celsius; pH in standard units; Ca, calcium; Mg, magnesium; Na, sodium; K, potassium; Alk, alkalinity; SO4, sulfate; Cl, chloride; NO3, nitrate; SiO2, silica; concentrations in microequivalents per liter, except silica is in micromoles per liter; --, not measured; criteria used in selection of sampling sites: TRIB = major tributary]
|
Site |
Identification number |
Q |
SC |
pH |
Ca |
Mg |
Na |
K |
Alk |
SO4 |
Cl |
NO3 |
SiO2 |
Criteria |
|
1 |
474235102485100 |
-- |
3,650 |
8.3 |
2,200 |
2,800 |
33,000 |
250 |
16,000 |
23,000 |
480 |
0.4 |
140 |
TRIB |
|
2 |
06332515 |
0.03 |
2,410 |
8.8 |
1,200 |
1,400 |
22,000 |
140 |
13,000 |
12,000 |
45 |
.4 |
100 |
-- |
The sums of ions were 78,000 meq/L at the unnamed tributary site (site 1) and 50,000 meq/L at the HBN station (site 2). All analyzed constituents from the samples that were collected during the synoptic study were within the range recorded at the HBN station for the period of record, 1966-95 (table 32). The water type at the unnamed tributary (site 1) was sodium sulfate. The water type at the HBN station (site 2) was a sodium bicarbonate, although sulfate was a substantial component, contributing 48 percent of the total anion concentration. The composition of the water at site 1 indicates that dissolution of several salts contribute to the ion composition, including sodium carbonate, sodium sulfate, and sodium chloride. The chloride concentration at site 1 was more than 10 times the concentration at the HBN station. After adjusting for the effects of evapotranspiration, precipitation is estimated to contribute only about 5 percent of the chloride at site 1 compared to about 50 percent of the chloride at site 2. Sulfate contributions from precipitation were about 1 percent at site 1 and about 2 percent at site 2. This is a much smaller percentage than is typical of stations in the HBN program; precipitation is estimated to contribute at least 90 percent of the mean stream sulfate concentration at about one-half of the HBN stations around the country (Smith and Alexander, 1983). Precipitation chemistry can account for the nitrate concentrations in samples that were collected during the synoptic study.
Bailey, Robert G., 1995, Descriptions of the ecoregions of the United States: U.S. Department of Agriculture, Forest Service, Miscellaneous Publication 1391, 108 p.
Biesecker, J.E., and Leifeste, D.K., 1975, Water quality of hydrologic benchmarks-An indicator of water quality in the natural environment: U.S. Geological Survey Circular 460-E, 21 p.
Bluemle, J.P., 1975, Guide to the geology of southwestern North Dakota: North Dakota Geological Survey Educational Series 9, 37 p.
Carlson, C.G., 1985, Geology of McKenzie County, North Dakota: North Dakota Geological Survey, Bulletin 80, Part 1.
Cobb, E.D., and Biesecker, J.E., 1971, The National Hydrologic Benchmark Network: U.S. Geological Survey Circular 460-D, 38 p.
Deer, W.A., Howie, R.A., and Zussman, J., 1966, An introduction to the rock-forming minerals: England, Longman Group Limited, 528 p.
Fenneman, N.M., 1946, Physical divisions of the United States: Washington, D.C., U.S. Geological Survey special map, scale 1:7,000,000.
Harkness, R.E., Haffield, N.D., Berkas, W.R., Norbeck, S.W., and Strobel, M.L., 1996, Water resources data, North Dakota, water year 1995: U.S. Geological Survey Water-Data Report ND-95-1, 534 p.
Hem, J.D., 1992, Study and interpretation of the chemical characteristics of natural water: U.S. Geological Survey Water-Supply Paper 2254, 263 p.
Lawrence, C.L., 1987, Streamflow characteristics at hydrologic bench-mark stations: U.S. Geological Survey Circular 941, 123 p.
National Climatic Data Center, 1996, Summary of the day, CD-ROM: Boulder, Colorado, EarthInfo Incorporated.
Smith, R.A., and Alexander, R.B., 1983, Evidence for acid-precipitation-induced trends in stream chemistry at hydrologic benchmark stations: U.S. Geological Survey Circular 910, 12 p.
U.S. Geological Survey, 1989, Analytical methods-Turbidimetric sulfate method: Office of Water Quality Technical Memorandum No. 90.04, accessed December 27, 1999, at URL http://water.usgs.gov/admin/memo/.
U.S. Geological Survey, 1990, Programs and plans-National water-quality networks FY1991: Office of Water Quality Technical Memorandum No. 90.13, accessed December 27, 1999, at URL http://water.usgs.gov/admin/memo/.
a. U.S. Geological Survey topographic maps:
b. Geologic maps:
c. Soil surveys:
No soil survey available.
d. Other maps:
Table B-1. NWIS site-identification numbers and site names for water-quality sampling sites.
|
Site |
Identification Number |
Site Name |
|
1 |
474235102485100 |
unnamed tributary south of middle Bear Den Creek |
|
2 |
06332515 |
Bear Den Creek near Mandaree, North Dakota |
| Back to 1173-C Contents |
This page maintained by Nichole Bisceglia.
Last updated July 31, 2000.