
Hydrologic Benchmark Network Stations in the West-Central U.S. 1963-95 (USGS Circular 1173-C)
|
|
|
|
|
Beaver Creek near Finley, North Dakota (05064900)
Hydrologic Benchmark Network Stations in the West-Central U.S. 1963-95 (USGS Circular 1173-C)
|
|
|
|
|
Beaver Creek near Finley, North Dakota (05064900)
To download a printer friendly PDF version of this information click here.
This report details one of the approximately 50 stations in the Hydrologic Benchmark Network (HBN) described in the four-volume U.S. Geological Survey Circular 1173. The suggested citation for the information on this page is:
|
Clark, M.L., Eddy-Miller, C.A., Mast, M.A., 2000, Environmental characteristics and water-quality of Hydrologic Benchmark Network stations in the West-Central United States, U.S. Geological Survey Circular 1173-C, 115 p. |
All of the tables and figures are numbered as they appear in each circular. Use the navigation bar above to view the abstract, introduction and methods for the entire circular, as well as a map and list of all of the HBN sites. Use the table of contents below to view the information on this particular station.
|
Table of Contents |
| 1. Site Characteristics and Land Use |
| 2. Historical Water Quality Data and Time-Series Trends |
| 3. Synoptic Water Quality Data |
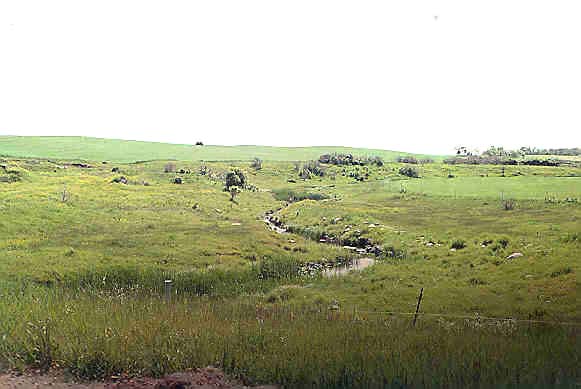
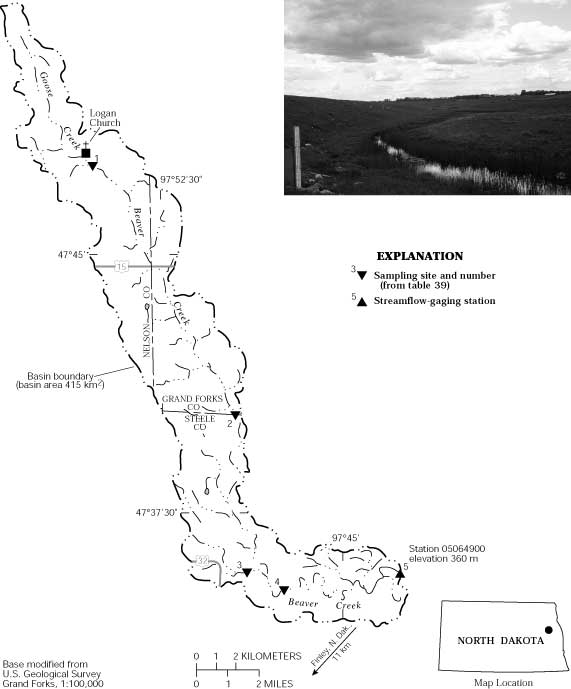
The Beaver Creek HBN Basin lies in the Western Lake Section of the Central Lowland physiographic province (Fenneman, 1946) in eastern North Dakota (Figure 19. Map showing study area in Beaver Creek Basin and photograph upstream from the streamflow gaging station). The HBN station is about 11 km northeast of Finley, N. Dak., at a latitude of 47×35'40'' and a longitude of 97×42'18''. Beaver Creek drains 415 km² of gently undulating terrain;
 |
Beaver Creek has intermittent flow, a meandering channel, and ponded sections. Since June 1987, flow has been regulated by a flood-control dam about 3 km upstream from the HBN station (Harkness and others, 1996). No flow typically occurs for several months during the winter each year when ice and snow may fill in the channel. Mean monthly discharges range from less than 0.002 m³/s in January to 1.5 m³/s in April (Harkness and others, 1996). Average annual precipitation at the Cooperstown weather station (about 48 km southwest of the HBN station) is 49 cm. Average annual runoff in the basin is about 2 cm (Harkness and others, 1996). The basin has cold winters and fairly mild summers. Mean monthly temperatures ranged from -14.8×C in January to 21.0×C in July during the period of record, 1934-95 (National Climatic Data Center, 1996).
Basin geology consists of a thick mantle of clay-rich glacial till with granitic cobbles and boulders. The glacial deposits are primarily ground moraine composed of glacial till and collapsed glacial sediment, eskers, and drumlins (Harris and Luther, 1991). Larger deposits may have resulted when the ice margin stabilized and more debris was deposited at the
 |
The Beaver Creek HBN station is in Steele County. Land ownership in the basin is predominantly private with the exception of rights-of-way along public roads. Light-duty, improved roads and secondary highways provide access to the Beaver Creek Basin year round. Access to the HBN station is by gravel road off the paved road. Snowmobiles are sometimes required off the main road during winter. The Beaver Creek Basin predominantly is agricultural; about 50 percent of the basin is pasture and rangeland, and about 50 percent is planted in crops such as wheat, barley, corn, and sunflowers (K.L. Boespflug, U.S. Geological Survey, oral commun., 1997). Pastures are grazed by cows, horses, and sheep. The basin also contains stock ponds, rural residences, and gravel pits. During the last 30 years, the basin has had a decrease in rural population, a decrease in rangeland, and an increase in the planting of low residue crops. Since 1985, land-use practices have been implemented to control cropland erosion within the basin, particularly along the stream corridor (Stuart Blotter, Natural Resources Conservation Service, written commun., 1996).
The data set analyzed for the Beaver Creek HBN station includes 132 water-quality samples that were collected from April 1965 to September 1995. Sampling frequency is described on the basis of water year, which begins on October 1 and ends on September 30. The sampling frequency was variable over the study period. During the period 1965-80, five samples were collected each year on average, but the range of samples that were collected in any given year was between one and nine. The sampling frequency decreased during the period 1981-95 to an average of three samples per year. Samples were analyzed at USGS district water-quality laboratories until the early 1970's. After 1973, with the creation of the USGS Central Laboratory System, all samples were analyzed at the water-quality laboratory (now called NWQL) in Arvada, Colo. The period of record for discharge is from water year 1965 to the current year (2000).
 |
Data quality was checked using ion balances and time-series plots. Calculated ion balances for samples with complete major-ion analyses are shown in Figures 20a and 20b. Temporal variation of discharge, field pH, major dissolved constituents, and ion balance at Beaver Creek, North Dakota. More than 95 percent of the samples had ion balances within the ±5 percent range, indicating that the major-ion analytical results generally were of good quality and that unmeasured constituents, such as organic anions, nutrients, and trace metals, do not contribute substantially to the ion composition of the stream water. Time-series plots of ion concentrations were inspected for data quality (fig. 20). The time-series data generally do not reflect method changes for cations and sulfate, probably owing to the large range of concentrations observed at this station. A decrease in the ion balance is observed.
The median and range of dissolved-constituent concentrations in the stream water collected at the Beaver Creek HBN station and VWM concentrations in wet precipitation measured at the Icelandic State Park NADP station are presented in table 36. The NADP station is about 132 km northwest of the HBN station. Precipitation chemistry at the NADP station is dilute and slightly acidic with VWM pH of 5.4 during the period of record, 1983-95. The dominant cation in precipitation was ammonium, which contributed about 50 percent of the total cation concentration; calcium contributed 24 percent. The dominant anions in precipitation were sulfate and nitrate, contributing 50 and 44 percent of the total anion concentration, respectively. The ammonium contributed by precipitation was higher at this HBN station than at most sites. Ammonium concentrations increase where livestock waste and fertilizer applications are widespread (National Atmospheric Deposition Program/National Trends Network, 1997).
[Parameters in units of microequivalents per liter, except for discharge in cubic meters per second, specific conductance in microsiemens per centimeter at 25 degrees Celsius, pH in standard units, and silica in micromoles per liter; n, number of stream samples; VWM, volume-weighted mean; spec. cond., specific conductance; --, not reported; <, less than]
|
Parameter |
Stream Water |
Precipitation VWM |
|||||
|
Minimum |
First quartile |
Median |
Third quartile |
Maximum |
n |
||
| Discharge |
<0.001 |
0.012 |
0.057 |
0.48 |
35 |
132 |
-- |
| Spec. cond., field |
210 |
759 |
1,090 |
1,440 |
2,730 |
132 |
-- |
| pH, field |
6.1 |
7.7 |
8.0 |
8.2 |
8.7 |
131 |
5.4a |
| Calcium |
1,000 |
3,400 |
4,800 |
6,400 |
10,000 |
132 |
11 |
| Magnesium |
600 |
2,200 |
3,400 |
4,600 |
8,000 |
132 |
4.1 |
| Sodium |
310 |
2,000 |
3,400 |
4,800 |
8,300 |
132 |
2.7 |
| Potassium |
38 |
210 |
260 |
310 |
490 |
132 |
1.1 |
| Ammonium |
1.4 |
3.6 |
5.7 |
9.3 |
59 |
46 |
23 |
| Alkalinity, laboratory |
960 |
3,200 |
5,000 |
6,200 |
13,000 |
132 |
-- |
| Sulfate |
120 |
3,800 |
6,200 |
9,200 |
16,000 |
130 |
18 |
| Chloride |
65 |
340 |
560 |
920 |
1,900 |
132 |
2.3 |
| Nitrite plus nitrate |
<.7 |
4.1 |
7.1 |
58.5 |
140 |
63 |
16b |
| Silica |
37 |
170 |
230 |
330 |
580 |
130 |
-- |
a Laboratory pH.
b Nitrate only.
Stream water in Beaver Creek is a calcium-magnesium-sodium sulfate type. The sum of ion concentrations ranged from about 4,000 to about 68,000 meq/L. Alkalinity ranged from 960 to 13,000 meq/L, and bicarbonate is the primary contributor to alkalinity at this station. Calcium, the major cation, contributed about 40 percent of the median cation concentration in stream water. Magnesium and sodium each accounted for 29 percent of the median cation concentration. Potassium concentrations were high, which probably reflect the weathering of the clay materials in the basin (Deer and others, 1966). Sulfate contributed 53 percent and bicarbonate contributed 42 percent of the median anion concentration in stream water. Dissolved solids at this HBN station were higher than at most other stations in the Hydrologic Benchmark Network. Specific conductance (210 to 2,730 mS/cm) is an indicator of the high dissolved solids at this station. Streams in basins with low average annual runoff and geologic settings that contain fine-grained sediments generally are characterized by high dissolved-solids concentrations (Biesecker and Leifeste, 1975). Annual precipitation and runoff data indicate that evapotranspiration can account for about a twentyfold increase in stream-water dissolved-solids concentrations compared to precipitation (Harkness and others, 1996). Therefore, the maximum ammonium and nitrate concentrations can be accounted for by precipitation as well.
[Q, discharge; Ca, calcium; Mg, magnesium; Na, sodium; K, potassium; Alk, alkalinity; SO4, sulfate; Cl, chloride; SiO2, silica; --, not applicable]
|
|
Q |
pH |
Ca |
Mg |
Na |
K |
Alk |
SO4 |
Cl |
| pH |
-0.123 |
-- |
-- |
-- |
-- |
-- |
-- |
-- |
-- |
| Ca |
-.534 |
0.239 |
-- |
-- |
-- |
-- |
-- |
-- |
-- |
| Mg |
-.491 |
.316 |
0.946 |
-- |
-- |
-- |
-- |
-- |
-- |
| Na |
-.384 |
.340 |
.875 |
0.958 |
-- |
-- |
-- |
-- |
-- |
| K |
-.406 |
.158 |
.403 |
.383 |
0.301 |
-- |
-- |
-- |
-- |
| Alk |
-.330 |
.251 |
.816 |
.856 |
.881 |
0.242 |
-- |
-- |
-- |
| SO4 |
-.449 |
.316 |
.921 |
.964 |
.929 |
.384 |
0.749 |
-- |
-- |
| Cl |
-.711 |
.123 |
.845 |
.826 |
.768 |
.481 |
.658 |
0.815 |
-- |
| SiO2 |
.101 |
-.190 |
-.026 |
-.032 |
.056 |
-.177 |
.190 |
.098 |
-0.114 |
Correlations among dissolved constituents and discharge were determined for Beaver Creek (table 37). The base cations and anions all showed inverse but mostly weak correlations with discharge. The low annual runoff (less than 2 cm) indicates that dilution of stream waters from precipitation is not a substantial process in the basin on an annual basis, but it
 |
Results of the seasonal Kendall test for trends in discharge and major dissolved constituents for Beaver Creek from 1968 through 1995 are presented in table 38. Statistically significant upward trends (a = 0.01) existed for flow-adjusted concentrations of dissolved magnesium and sulfate. The absence of a trend in unadjusted concentrations helps eliminate changes in laboratory methods as a source of the trends. Smith and Alexander (1983) determined trends in sulfate, alkalinity, and pH were not statistically significant for this HBN station during the period from the mid-1960's to 1981, although sulfur-dioxide emissions increased by 55 percent in North Dakota during the period 1975-84 (Lins, 1987). Recent trends in precipitation at regional NADP stations show decreasing sulfate and magnesium for the period 1980-92 (Lynch and others, 1995). However, after accounting for evapotranspiration, precipitation only accounts for about 6 percent of the stream-water sulfate. This may indicate that the source of the sulfate and magnesium is dissolution of magnesium-sulfate salts within the basin, as indicated by the strong correlation between magnesium and sulfate.
[Trends in units of microequivalents per liter per year, except for discharge in cubic meters per second per year, pH in standard units per year, and silica in micromoles per liter per year; p-value, attained significance level; --, not calculated; <, less than]
|
Parameter |
Unadjusted |
Flow adjusted |
||
|
Trend |
p-value |
Trend |
p-value |
|
| Discharge |
<0.01 |
0.925 |
-- |
-- |
| pH |
<.01 |
.895 |
(b) |
-- |
| Calcium |
20 |
.191 |
20 |
0.160 |
| Magnesium |
30 |
.014 |
40 |
.004 |
| Sodium |
50 |
.029 |
40 |
.036 |
| Potassium |
3 |
.057 |
3 |
.023 |
| Alkalinity |
40 |
.073 |
30 |
.113 |
| Sulfate |
90 |
.025 |
100 |
.007 |
| Chloride |
3 |
.632 |
5 |
.189 |
| Nitrite plus nitrate |
.4a |
.625 |
-- |
-- |
| Silica |
1 |
.410 |
(b) |
-- |
a Trend test for highly censored data was used.
b Concentration-flow model not significant at a = 0.10.
Results of a surface-water synoptic sampling conducted June 4 and 5, 1993, in the Beaver Creek Basin are presented in table 39, and locations of the sampling sites are shown in figure 19. Discharge at the HBN station (site 5) was 0.02 m³/s, which is less than the mean monthly discharge of 0.15 m³/s for the month of June (Harkness and others, 1996). The water type of samples that were collected in the basin was mixed. Water type at sites on the main stem (sites 1, 2, 4, and 5) was a calcium-sodium-magnesium sulfate. The water type of the unnamed tributary (site 3) was a calcium-sodium-magnesium sulfate-bicarbonate.
[Site locations shown in fig. 19; Q, discharge in cubic meters per second; SC, specific conductance in microsiemens per centimeter at 25 degrees Celsius; pH in standard units; Ca, calcium; Mg, magnesium; Na, sodium; K, potassium; Alk, alkalinity; SO4, sulfate; Cl, chloride; NO3, nitrate; SiO2, silica; concentrations in microequivalents per liter, except silica is in micromoles per liter; --, not measured; <, less than; criteria used in selection of sampling sites: TRIB = major tributary, LU = land use]
|
Site |
Identification number |
Q |
SC |
pH |
Ca |
Mg |
Na |
K |
Alk |
SO4 |
Cl |
NO3 |
SiO2 |
Criteria |
|
1 |
474737097552700 |
-- |
1,910 |
8.0 |
8,500 |
6,200 |
7,400 |
490 |
8,200 |
14,000 |
560 |
<0.4 |
270 |
TRIB |
|
2 |
474021097492800 |
0.01 |
1,960 |
8.1 |
8,500 |
5,800 |
7,800 |
330 |
7,800 |
15,000 |
540 |
5.4 |
320 |
LU |
|
3 |
473546097485100 |
-- |
1,710 |
7.9 |
9,500 |
6,000 |
4,300 |
150 |
9,200 |
9,400 |
730 |
1.2 |
350 |
LU |
|
4 |
473517097472900 |
.02 |
1,790 |
7.9 |
8,000 |
5,500 |
6,100 |
330 |
7,500 |
13,000 |
590 |
1.2 |
200 |
LU |
|
5 |
05064900 |
.02 |
1,510 |
8.3 |
6,500 |
4,900 |
5,200 |
360 |
6,100 |
9,400 |
730 |
.4 |
110 |
-- |
The sum of ions in the basin ranged from 33,000 meq/L at the HBN station (site 5) to 46,000 meq/L (site 2). The concentrations of ions sampled at the synoptic sites was generally between the third quartile and the maximum values reported at the HBN station during the period of 1965-95 (table 36). The high ion concentrations correspond to a low discharge, indicating that ground water is likely the source. After adjusting for the effects of evapotranspiration, precipitation is estimated to contribute only a small percentage of the salt-forming anions. Chloride contributions from precipitation ranged from about 6 percent (sites 3 and 5) to about 8 percent (site 2). Sulfate contributions from precipitation ranged from about 2 percent (site 2) to about 4 percent (sites 3 and 5). This is a much smaller percentage than is typical of most stations in the HBN; precipitation is estimated to contribute at least 90 percent of the mean stream sulfate concentration at about one-half of the HBN stations around the country (Smith and Alexander, 1983). Dissolved constituents generally were higher in the upper basin and decreased in a downstream direction. The decrease in ions at the station may be due to dilution from unsampled tributaries, although a corresponding increase in flow was not measured during the synoptic sampling. The percent difference of cations and anions ranged from 0.9 to 3.1 percent, indicating that unmeasured ions did not substantially contribute to the ionic content of the water. Concentrations of nitrate were lower in stream water than in precipitation, indicating that nitrogen generally is retained by the biomass in the basin.
Bailey, Robert G., 1995, Descriptions of the ecoregions of the United States: U.S. Department of Agriculture, Forest Service, Miscellaneous Publication 1391, 108 p.
Biesecker, J.E., and Leifeste, D.K., 1975, Water quality of hydrologic benchmarks-An indicator of water quality in the natural environment: U.S. Geological Survey Circular 460-E, 21 p.
Bluemle, J.P., 1975, Guide to the geology of southwestern North Dakota: North Dakota Geological Survey Educational Series 9, 37 p.
Cobb, E.D., and Biesecker, J.E., 1971, The National Hydrologic Benchmark Network: U.S. Geological Survey Circular 460-D, 38 p.
Deer, W.A., Howie, R.A., and Zussman, J., 1966, An introduction to the rock-forming minerals: England, Longman Group Limited, 528 p.
Fenneman, N.M., 1946, Physical divisions of the United States: Washington, D.C., U.S. Geological Survey special map, scale 1:7,000,000.
Harkness, R.E., Haffield, N.D., Berkas, W.R., Norbeck, S.W., and Strobel, M.L., 1996, Water resources data, North Dakota, water year 1995: U.S. Geological Survey Water-Data Report ND-95-1, 534 p.
Harris, K.L., and Luther, M.R., 1991, Surface geology of the Goose River map area: North Dakota Geological Survey Atlas Series Map 14, sheet A1.
Lins, H.F., 1987, Trend analysis of monthly sulfur dioxide emissions in the conterminous United States, 1975-1984: Atmospheric Environment, v. 21, no.11, p. 2297-2309.
Lynch, J.A., Bowersox, V.C., and Grimm, J.W., 1995, Trends in precipitation chemistry in the United States-A national perspective, 1980-92: Atmospheric Environment, v. 29, no. 11. p. 1231-1246.
National Atmospheric Deposition Program/National Trends Network, 1997, Inside rain, a look at the National Atmospheric Deposition Program: Fort Collins, Colorado State University, Natural Resource Ecology Laboratory, 24 p.
National Climatic Data Center, 1996, Summary of the day, CD-ROM: Boulder, Colorado, EarthInfo Incorporated.
Smith, R.A., and Alexander, R.B., 1983, Evidence for acid-precipitation-induced trends in stream chemistry at hydrologic benchmark stations: U.S. Geological Survey Circular 910, 12 p.
U.S. Department of Agriculture, 1997, Soil survey of Steele County, North Dakota: U.S. Department of Agriculture, Natural Resources Conservation Service, 214 p.
a. U.S. Geological Survey topographic maps:
b. Geologic maps:
c. Soil surveys:
Table B-1. NWIS site-identification numbers and site names for water-quality sampling sites.
|
Site |
Identification Number |
Site Name |
|
1 |
474737097552700 |
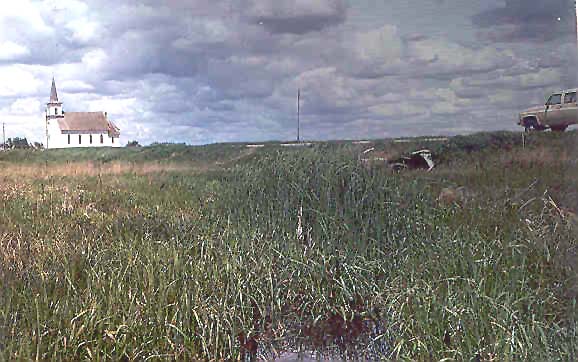
Beaver Creek at Logan Church |
|
2 |
474021097492800 |
Beaver Creek at Steele and Grand Forks County Boundary |
|
3 |
473546097485100 |
unnamed tributary to Beaver Creek |
|
4 |
473517097472900 |
Beaver Creek below unnamed tributary |
|
5 |
05064900 |
Beaver Creek near Finley, North Dakota |
| Back to 1173-C Contents |
This page maintained by Nichole Bisceglia.
Last updated July 31, 2000.