
Hydrologic Benchmark Network Stations in the West-Central U.S. 1963-95 (USGS Circular 1173-C)
|
|
|
|
|
Little Vermillion River near Salem, South Dakota (06478540)
Hydrologic Benchmark Network Stations in the West-Central U.S. 1963-95 (USGS Circular 1173-C)
|
|
|
|
|
Little Vermillion River near Salem, South Dakota (06478540)
To download a printer friendly PDF version of this information click here.
This report details one of the approximately 50 stations in the Hydrologic Benchmark Network (HBN) described in the four-volume U.S. Geological Survey Circular 1173. The suggested citation for the information on this page is:
|
Clark, M.L., Eddy-Miller, C.A., Mast, M.A., 2000, Environmental characteristics and water-quality of Hydrologic Benchmark Network stations in the West-Central United States, U.S. Geological Survey Circular 1173-C, 115 p. |
All of the tables and figures are numbered as they appear in each circular. Use the navigation bar above to view the abstract, introduction and methods for the entire circular, as well as a map and list of all of the HBN sites. Use the table of contents below to view the information on this particular station.
|
Table of Contents |
| 1. Site Characteristics and Land Use |
| 2. Historical Water Quality Data and Time-Series Trends |
| 3. Synoptic Water Quality Data |
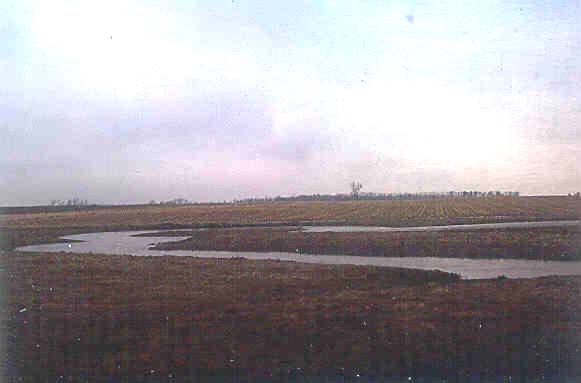
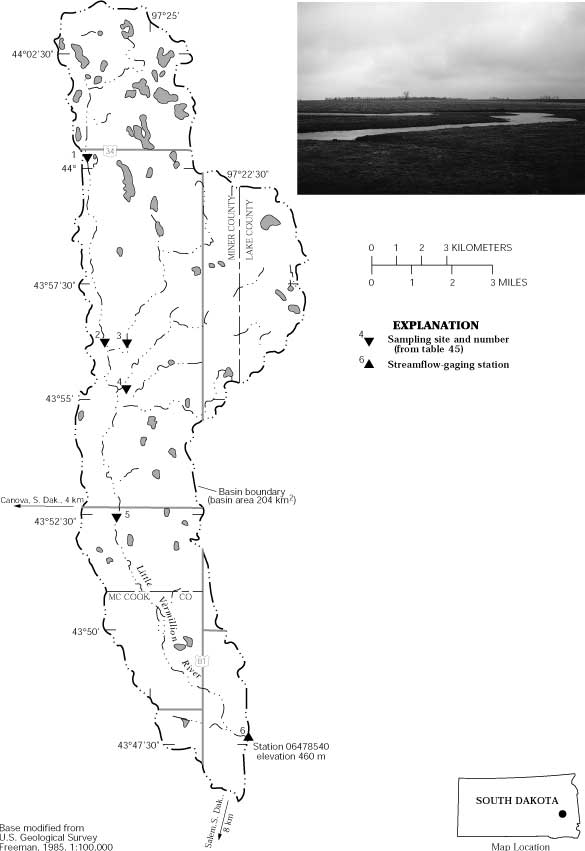
The Little Vermillion River HBN Basin lies in the Western Lake section of the Central Lowland physiographic province (Fenneman, 1946) in eastern South Dakota (Figure 23. Map showing study area in Little Vermillion River Basin and photograph of the Little Vermillion River in the upper basin). The HBN station is about 8 km northeast of
 |
The Little Vermillion River is an intermittent stream. No flow occurs for many days each year, primarily during fall and winter. Mean monthly discharge ranges from 0.001 m³/s in January to 0.51 m³/s in July (Burr and others, 1996). Average annual precipitation at the Salem weather station, about 17 km southwest of the site, is 64 cm. Most of the precipitation occurs as rain in spring and summer. Average annual runoff is only about 3 cm (Burr and others, 1996). The mean monthly temperatures ranged from about -11.9×C in January to 24.0×C in August during the period of record, 1969-72 (National Climatic Data Center, 1996).
The surface of the Little Vermillion HBN Basin is mantled by deposits of Pleistocene age. Outwash and alluvium are near the stream channel. Glacial deposits of outwash, oxidized till, and unoxidized till show evidence of three intervals of glaciation (Schroeder, 1988). Glacial deposits are composed of silty, pebbly clays, sands, and gravel. Average thickness of these deposits is about 50 m. Bedrock geology underlying the glacial deposits includes Pierre Shale and Niobrara
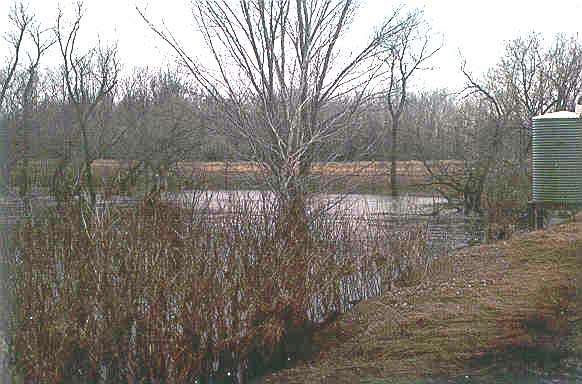 |
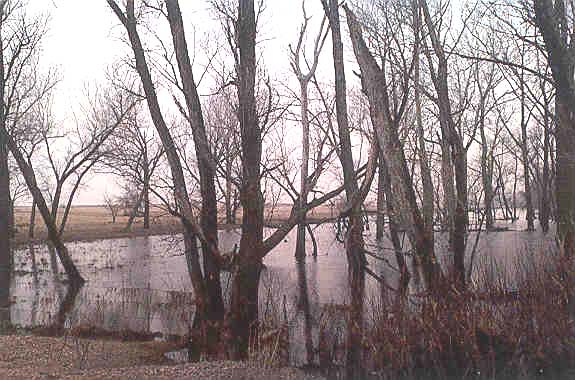
The Little Vermillion River HBN Basin is in Miner and McCook Counties. Land ownership is private except for rights-of-way along public roads. Railroad tracks and a network of roads, including unimproved, improved, and highways, provide access to the basin year round. Nearly the entire basin is used for agriculture. Crops, including corn and soybeans, are grown on about 90 percent of the land, and the remaining area is used for grazing cattle. During the 1980's, much of the area occupied by row crops was returned to grassland under the Conservation Reserve Program (Darrell Campbell, Farm Service Agency, oral commun., 1997). In the 1990's, some of the set-aside grassland was returned to row crops (M.J. Burr, U.S. Geological Survey, oral commun., 1997). Rural residences and stock ponds are present throughout the basin, and several lakes lie in the upper basin where waterfowl production is managed. Gravel pits are constructed in the basin, primarily along the main channel of the Little Vermillion River (Koch and McGarvie, 1988).
Samples for chemical analyses have not been collected routinely at the Little Vermillion HBN station. The data set analyzed for this report for the Little Vermillion River HBN station includes 121 measurements of instantaneous discharge and 113 measurements of specific conductance for the period February 1976 to August 1995. The entire period of record for discharge is from 1966 to 1997. Median values and ranges of discharge and specific conductance are shown in table 44. Discharge ranged from less than 0.001 to 18 m³/s with a median discharge of 0.34 m³/s. The range of specific conductance for the period was 140 to 1,970 mS/cm, with a median value of 860 mS/cm. Specific conductance is an indicator of dissolved solids. Based on the range of specific-conductance values, dissolved solids generally are high at this site. Streams in basins with fine-grained sediments and low annual runoff tend to have high dissolved-solids concentrations (Biesecker and Leifeste, 1975). Specific conductance had an inverse relation with discharge. The Spearman rank correlation coefficient was -0.716 and was significant for an a of 0.01.
[Discharge in cubic meters per second; specific conductance in microsiemens per centimeter at 25 degrees Celsius; n, number of stream samples; <, less than]
|
Parameter |
Stream Water |
|||||
|
Minimum |
First quartile |
Median |
Third quartile |
Maximum |
n |
|
| Discharge |
<0.001 |
0.04 |
0.34 |
1.8 |
18 |
121 |
| Specific conductance, field |
140 |
520 |
860 |
1,180 |
1,970 |
113 |
Results of a surface-water synoptic sampling conducted April 8, 1993, in the Little Vermillion River Basin are presented in table 45, and locations of the sampling sites are shown in figure 23. Discharge at the HBN station (site 6) was 2.3 m³/s compared to the mean monthly discharge of 0.46 m³/s for the month of April (Burr and others, 1996). The water type at the Little Vermillion River HBN station is a calcium-magnesium sulfate type. The sum of ions at the HBN station is 20,000 meq/L. The specific conductance of 958 mS/cm was higher than the median but less than the third quartile for the
 |
The waters at the remaining synoptic sites (sites 1-5) are calcium-magnesium sulfate. The sum of ions in tributary and upper-basin main-stem sites ranged from about 17,000 meq/L (site 4) to about 24,000 meq/L (site 2). The specific conductance on the main stem (site 2) in the upper basin was 1,120 mS/cm, which was higher than the specific conductance measured downstream at sites 5 (979 mS/cm) and 6 (958 mS/cm). This sampling was conducted on the rising limb of the hydrograph, and this dilution effect is not typical of base-flow conditions for this station. Nitrate concentrations in samples that were collected from several synoptic sites (sites 2, 3, 4, and 5) were higher than concentrations in most of the other HBN basins and undeveloped sites in other studies (Mueller and others, 1995). This may indicate that there is a source for some nitrogen in the basin, possibly fertilizer or animal waste; however, evapotranspiration rates also are high in this basin.
[Site locations shown in fig. 23; Q, discharge in cubic meters per second; SC, specific conductance in microsiemens per centimeter at 25 degrees Celsius; pH in standard units; Ca, calcium; Mg, magnesium; Na, sodium; K, potassium; Alk, alkalinity; SO4, sulfate; Cl, chloride; NO3, nitrate; SiO2, silica; concentrations in microequivalents per liter, except silica is in micromoles per liter; --, not measured; <, less than; criteria used in selection of sampling sites: BG = bedrock geology, TRIB = major tributary, LU = land use]
|
Site |
Identification number |
Q |
SC |
pH |
Ca |
Mg |
Na |
K |
Alk |
SO4 |
Cl |
NO3 |
SiO2 |
Criteria |
|
1 |
440027097265200 |
-- |
1,020 |
7.8 |
4,500 |
4,300 |
1,600 |
510 |
3,400 |
7,300 |
310 |
<0.4 |
280 |
BG |
|
2 |
435609097260800 |
-- |
1,120 |
7.9 |
4,800 |
4,900 |
2,000 |
510 |
3,000 |
8,100 |
420 |
54 |
250 |
TRIB |
|
3 |
435609097253600 |
-- |
884 |
7.8 |
3,900 |
3,400 |
1,200 |
490 |
2,300 |
6,000 |
450 |
140 |
220 |
TRIB |
|
4 |
435516097254000 |
-- |
840 |
7.9 |
3,800 |
3,300 |
1,000 |
410 |
2,400 |
5,800 |
370 |
61 |
220 |
TRIB |
|
5 |
435238097254800 |
-- |
979 |
7.8 |
4,400 |
4,000 |
1,500 |
460 |
2,400 |
7,500 |
340 |
79 |
220 |
LU |
|
6 |
06478540 |
2.3 |
958 |
7.9 |
4,200 |
3,800 |
1,300 |
440 |
3,300 |
6,500 |
340 |
6.8 |
160 |
-- |
Bailey, Robert G., 1995, Descriptions of the ecoregions of the United States: U.S. Department of Agriculture, Forest Service, Miscellaneous Publication 1391, 108 p.
Biesecker, J.E., and Leifeste, D.K., 1975, Water quality of hydrologic benchmarks-An indicator of water quality in the natural environment: U.S. Geological Survey Circular 460-E, 21 p.
Burr, M.J., Teller, R.W., and Neizert, K.M., 1996, Water resources data, South Dakota, water year 1995: U.S. Geological Survey Water-Data Report SD-95-1, 379 p.
Cobb, E.D., and Biesecker, J.E., 1971, The National Hydrologic Benchmark Network: U.S. Geological Survey Circular 460-D, 38 p.
Darton, N.H., 1951, Geologic map of South Dakota: U.S. Geological Survey, 1 pl.
Deer, W.A., Howie, R.A., and Zussman, J., 1966, An introduction to the rock-forming minerals: England, Longman Group Limited, 528 p.
Fenneman, N.M., 1946, Physical divisions of the United States: Washington, D.C., U.S. Geological Survey special map, scale 1:7,000,000.
Koch, N.C., and McGarvie, S.D., 1988, Water resources of Miner County, South Dakota: U.S. Geological Survey Water-Resources Investigations Report 86-4035, 37 p.
Mueller, D.K., Hamilton, P.A., Helsel, D.R., Hitt, K.J., and Ruddy, B.C., 1995, Nutrients in ground water and surface water of the United States-An analysis of data through 1992: U.S. Geological Survey Water-Resources Investigations Report 95-4031, 74 p.
National Climatic Data Center, 1996, Summary of the day, CD-ROM: Boulder, Colorado, EarthInfo Incorporated.
Schroeder, Wayne, 1988, Geology and water resources of Miner County, South Dakota: Department of Water and Natural Resources, South Dakota Geological Survey Bulletin 31, 38 p.
U.S. Department of Agriculture, 1980, Soil survey of McCook County, South Dakota: U.S. Department of Agriculture, Soil Conservation Service, 123 p.
U.S. Department of Agriculture, 1984a, Soil survey of Miner County, South Dakota: U.S. Department of Agriculture, Soil Conservation Service, 116 p.
a. U.S. Geological Survey topographic maps:
b. Geologic maps:
c. Soil surveys:
Table B-1. NWIS site-identification numbers and site names for water-quality sampling sites.
|
Site |
Identification Number |
Site Name |
|
1 |
440027097265200 |
upper west branch Little Vermillion River |
|
2 |
435609097260800 |
west branch Little Vermillion River |
|
3 |
435609097253600 |
upper east branch Little Vermillion River |
|
4 |
435516097254000 |
lower east branch Little Vermillion River |
|
5 |
435238097254800 |
Little Vermillion River at highway near Canova |
|
6 |
06478540 |
Little Vermillion River near Salem, South Dakota |
| Back to 1173-C Contents |
This page maintained by Nichole Bisceglia.
Last updated July 31, 2000.