
Hydrologic Benchmark Network Stations in the West-Central U.S. 1963-95 (USGS Circular 1173-C)
|
|
|
|
|
Cache Creek near Jackson, Wyoming (13018300)
Hydrologic Benchmark Network Stations in the West-Central U.S. 1963-95 (USGS Circular 1173-C)
|
|
|
|
|
Cache Creek near Jackson, Wyoming (13018300)
To download a printer friendly PDF version of this information click here.
This report details one of the approximately 50 stations in the Hydrologic Benchmark Network (HBN) described in the four-volume U.S. Geological Survey Circular 1173. The suggested citation for the information on this page is:
|
Clark, M.L., Eddy-Miller, C.A., Mast, M.A., 2000, Environmental characteristics and water-quality of Hydrologic Benchmark Network stations in the West-Central United States, U.S. Geological Survey Circular 1173-C, 115 p. |
All of the tables and figures are numbered as they appear in each circular. Use the navigation bar above to view the abstract, introduction and methods for the entire circular, as well as a map and list of all of the HBN sites. Use the table of contents below to view the information on this particular station.
|
Table of Contents |
| 1. Site Characteristics and Land Use |
| 2. Historical Water Quality Data and Time-Series Trends |
| 3. Synoptic Water Quality Data |
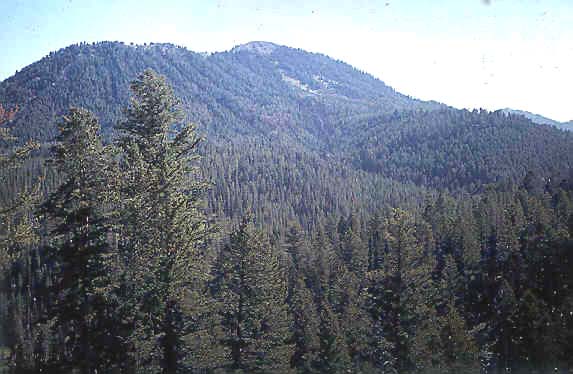
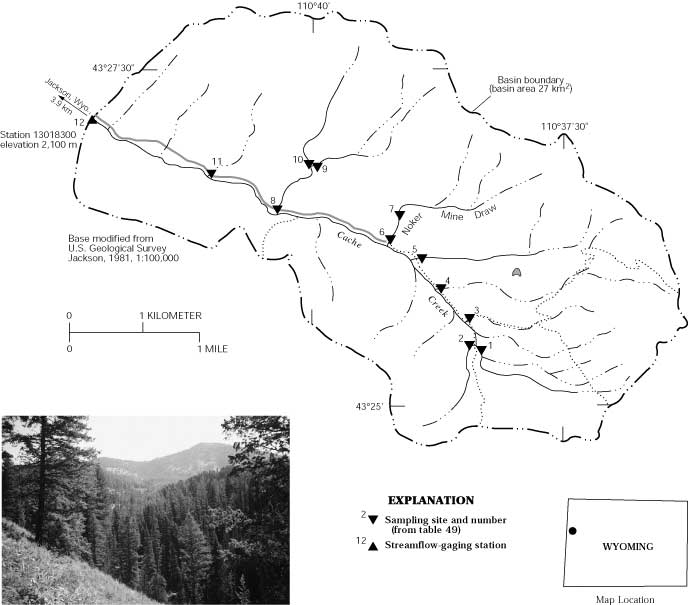
The Cache Creek HBN Basin is in the Middle Rocky Mountains physiographic province (Fenneman, 1946) in western Wyoming (Figure 24. Map showing study area in Cache Creek Basin and photograph of the landscape of the basin). The HBN station is 3.9 km southeast of the town of Jackson, Wyo., at a latitude of 43×27'08'' and a longitude of 110×42'12''. Cache Creek drains about 27 km² of steep mountain and canyon terrain in the Gros Ventre Mountains. Basin elevations range from about 2,100 to about 3,100 m. The ecoregion of the basin is classified as the Southern Rocky Mountain Steppe-Open Woodland-Coniferous Forest-Alpine Meadow Province (Bailey, 1995). Timber covers about 80 percent of the north-facing slopes and 50 percent of the south-facing slopes. On the south-facing slopes, subalpine fir, lodgepole pine, and Engelmann spruce are the dominant timber species. Subalpine fir, Douglas fir, and lodgepole pine timber species dominate the north-facing slopes. Grass, forbs, and brush cover the remaining area up to timberline. Underbrush includes mountain big sagebrush, whortleberry, huckleberry, and pinegrass (Sandra Key, U.S. Forest Service, written commun., 1997). Cache Creek is tributary to Flat Creek, which is tributary to the Snake River.
 |
The relief within the Cache Creek Basin is the result of uplifting by folding and faulting (Simons and others, 1988). Two thrust faults trend through the study area: the Cache Creek Thrust Fault and Jackson Thrust Fault. The underlying bedrock is composed of deformed sedimentary rocks (Goetze, 1981). Paleozoic rocks are in the upper drainages on the north side of the Cache Creek Thrust Fault. Paleozoic rocks from several periods are located in the basin: Cambrian shale and limestone; Ordovician dolomite; Devonian siltstone and shale; Mississippian limestone, shale, and sandstone; and Pennsylvanian and Permian sandstone, shale, limestone, and dolomite. Cretaceous units primarily are in the eastern part of the basin, including the Cody Shale, Bacon Ridge Sandstone, and the Sohare Formation. The Cody Shale is described as a dark, marine shale with glauconitic sandstones. The Bacon Ridge Sandstone is light-gray to tan, fine- to medium-grained, massive to thick-bedded sandstone. The Sohare Formation contains sandstone, shale, marlstone, and some beds of minable coal. Unconsolidated units cover a large part of the valley and slopes and include slope wash, landslide debris and slump blocks, talus deposits, and partly lithified limestone conglomerate. Soils in the basin are well drained with moderate to rapid permeabilities (Glenn, 1981). Two main soil types occupy the dissected forest slopes. The soil type on steep slopes (greater than 20 percent) are light-brown, sandy, gravelly loam, containing about 10 to 60 percent rock fragments. Clay content ranges from about 20 to 45 percent. The soils on gradual slopes (less than 20 percent) are grayish-brown to pale-brown, lime-loamy, mixed, silt loam. Rock fragment content is about 10 to 30 percent. Subsoils are well developed in this soil type (Glenn, 1981).
 |
The Cache Creek Basin is in Teton County and lies entirely within the Bridger-Teton National Forest. The northern and eastern parts of the basin predominantly lie in the Gros Ventre Wilderness Area. One dirt road serves the lower part of the basin. Travel on the road is restricted to authorized use by the Forest Service, other agencies, and permitted outfitters. The upper part of the basin is reached by trail only. Access for the general public is by horses, hiking, and mountain biking in summer and is restricted to skiing, snowshoeing, and snowmobiles in the winter. Mechanized vehicles only are allowed in that portion of the basin outside the Gros Ventre Wilderness Area. Land use in the basin has changed over the years. Two small coal mines provided coal for local needs up to the mid-1930's. Prior to 1938, small-scale logging and cattle grazing occurred in the basin (Sandra Key, U.S. Forest Service, written commun., 1997). In 1942, the basin was closed to grazing and timber harvest for protection of the water supply from Cache Creek to the town of Jackson. Restoration in the basin during the 1960's included road closure, road and trail erosion control, and seeding of disturbed areas. Since the 1970's, recreation has been the predominant land use. Hiking, biking, and camping activity can be substantial during summer owing to the close proximity of the basin to the town of Jackson and Grand Teton and Yellowstone National Parks. Hunting is the dominant recreational use in the fall, and cross-country skiing and snowshoeing are popular winter recreational uses in the basin.
The data set analyzed for the Cache Creek HBN station includes 272 water-quality samples that were collected from July 1965 to August 1995. Sampling frequency is described on the basis of water year, which begins on October 1 and ends on September 30. Between 10-12 samples were collected per year for most of the period from 1966 through 1982. After 1982, sampling frequency was reduced, generally to a bimonthly schedule. Samples were analyzed at USGS district water-quality laboratories until the early 1970's. After 1973, with the creation of the USGS Central Laboratory System, all samples were analyzed at the water-quality laboratory (now called NWQL) in Arvada, Colo. The period of record for discharge is from June 1962 to current year (2000).
 |
The median and range of major-ion concentrations in the stream water collected at the Cache Creek HBN station and VWM concentrations in wet precipitation measured at the Gypsum Creek NADP station are presented in table 46. The NADP station is about 83 km southeast of the HBN station. Precipitation chemistry at the NADP station was dilute and slightly acidic with VWM pH of 5.3 over the 1985-95 period of record. The dominant cation in precipitation was calcium, which contributed 35 percent of the total cation concentration; ammonium contributed 24 percent and hydrogen contributed 19 percent. The dominant anions in precipitation were sulfate, which contributed 46 percent, and nitrate, which contributed 40 percent of the total anion concentration.
[Parameters in units of microequivalents per liter, except for discharge in cubic meters per second, specific conductance in microsiemens per centimeter at 25 degrees Celsius, pH in standard units, and silica in micromoles per liter; n, number of stream samples; VWM, volume-weighted mean; spec. cond., specific conductance; --, not reported; <, less than]
|
Parameter |
Stream Water |
Precipitation VWM |
|||||
|
Minimum |
First quartile |
Median |
Third quartile |
Maximum |
n |
||
| Discharge |
0.06 |
0.13 |
0.20 |
0.37 |
3.1 |
272 |
-- |
| Spec. cond., field |
220 |
300 |
315 |
334 |
450 |
269 |
-- |
| pH, field |
7.2 |
8.1 |
8.3 |
8.5 |
9.1 |
269 |
5.3a |
| Calcium |
1,400 |
2,200 |
2,300 |
2,400 |
3,100 |
272 |
9.5 |
| Magnesium |
620 |
1,000 |
1,100 |
1,200 |
1,700 |
272 |
2.0 |
| Sodium |
52 |
87 |
100 |
120 |
260 |
272 |
3.4 |
| Potassium |
5.1 |
13 |
15 |
20 |
67 |
270 |
.52 |
| Ammonium |
<.7 |
1.4 |
2.1 |
4.3 |
12 |
98 |
6.4 |
| Alkalinity, laboratory |
2,200 |
3,200 |
3,400 |
3,500 |
4,400 |
272 |
-- |
| Sulfate |
10.4 |
94 |
120 |
160 |
500 |
272 |
11 |
| Chloride |
<2.8 |
14 |
22 |
31 |
150 |
271 |
3.3 |
| Nitrite plus nitrate |
<.7 |
<3.6 |
7.1 |
8.6 |
86 |
139 |
9.6b |
| Silica |
45 |
74 |
79 |
84 |
140 |
272 |
-- |
a Laboratory pH.
b Nitrate only.
Stream water in Cache Creek is a fairly buffered, calcium bicarbonate type. The sum of ion concentrations ranged from about 5,900 to about 8,900 meq/L. Alkalinity ranged from 2,200 to 4,400 meq/L, and bicarbonate was the primary contributor to alkalinity at this station. Calcium and magnesium accounted for 97 percent of the median cation concentration in stream water; alkalinity accounted for 96 percent of the median anion concentration. These results indicate that carbonaceous rocks, including limestone and dolomite, are the primary contributors to the ion composition of the stream water. Concentrations of dissolved constituents were higher in Cache Creek, which drains sedimentary rocks, compared to other high mountain HBN sites that drain Precambrian igneous and metamorphic rocks. Annual precipitation and runoff data indicate that evapotranspiration can account for about a twofold increase in stream-water concentrations compared to precipitation (Smalley and others, 1996). Although chloride concentrations in stream water were small, precipitation chemistry can account for only about 30 percent. The sedimentary rocks in the basin are of marine origin and may contribute some of the chloride to stream water. Concentrations of ammonium and nitrate were lower in the stream water than in the precipitation, indicating that nitrogen generally is retained by the biomass in the basin.
[Q, discharge; Ca, calcium; Mg, magnesium; Na, sodium; K, potassium; Alk, alkalinity; SO4, sulfate; Cl, chloride; SiO2, silica; --, not applicable]
|
|
Q |
pH |
Ca |
Mg |
Na |
K |
Alk |
SO4 |
Cl |
| pH |
0.208 |
-- |
-- |
-- |
-- |
-- |
-- |
-- |
-- |
| Ca |
-.119 |
-0.008 |
-- |
-- |
-- |
-- |
-- |
-- |
-- |
| Mg |
-.696 |
-.125 |
0.424 |
-- |
-- |
-- |
-- |
-- |
-- |
| Na |
-.200 |
-.010 |
.721 |
0.308 |
-- |
-- |
-- |
-- |
-- |
| K |
.113 |
.065 |
.328 |
.096 |
0.418 |
-- |
-- |
-- |
-- |
| Alk |
-.369 |
-.114 |
.586 |
.516 |
.528 |
0.237 |
-- |
-- |
-- |
| SO4 |
-.490 |
-.182 |
.303 |
.525 |
.369 |
.260 |
0.358 |
-- |
-- |
| Cl |
-.114 |
-.063 |
.097 |
.192 |
.074 |
.283 |
.062 |
0.269 |
-- |
| SiO2 |
-.435 |
-.089 |
.581 |
.667 |
.619 |
.331 |
.483 |
.576 |
0.229 |
Correlations among dissolved constituents and discharge were determined for Cache Creek (table 47). The base cations and anions, except potassium, showed inverse relations with discharge. However, these correlations were weak. Positive correlations occurred among dissolved constituents, but most of these correlations also were weak. The strongest correlation was between calcium and sodium (rho value = 0.721). The weak correlations may result from the large number of different geologic units and lithologies exposed in the basin and the different contributions from various drainages during runoff conditions.
 |
Results of the seasonal Kendall test for trends in discharge and major dissolved constituents for Cache Creek from 1965 through 1995 are presented in table 48. Statistically significant upward trends (a = 0.01) occurred for pH and nitrate for unadjusted concentrations. Statistically significant downward trends in magnesium and sulfate were determined in unadjusted concentrations. Flow adjusting for variations due to discharge removed the trends in pH; insufficient data existed to flow-adjust nitrate concentrations. The trend in unadjusted nitrate concentrations may be a function of a change in the minimum reporting level for the laboratory method rather than an environmental change, as seen in the linear step pattern in the time-series plot about 1982. The trends for sulfate and magnesium were retained after flow adjusting, indicating that they probably were not caused by variations in discharge. Smith and Alexander (1983) also detected a downward trend in sulfate concentrations for the period mid- to late 1960's to 1981 at this station. Lins (1987), however, reported an increase in sulfur-dioxide emissions of 24 percent in Wyoming for the period 1975-84. Most Western States, including Montana, New Mexico, Utah, Arizona, Nevada, California, Oregon, and Washington, had decreasing sulfur-dioxide emissions, indicating that regional emissions were lower overall. The magnesium and sulfate trends are consistent with trends in precipitation chemistry for the region that show decreasing sulfate and magnesium for the period 1980-92 (Lynch and others, 1995). However, it is unlikely that stream-water magnesium would be affected by precipitation chemistry owing to much higher magnesium concentration in the stream.
[Trends in units of microequivalents per liter per year, except for discharge in cubic meters per second per year, pH in standard units per year, and silica in micromoles per liter per year; p-value, attained significance level; --, not calculated; <, less than]
|
Parameter |
Unadjusted |
Flow adjusted |
||
|
Trend |
p-value |
Trend |
p-value |
|
| Discharge |
-0.02 |
0.377 |
-- |
-- |
| pH |
.01 |
<.001 |
(b) |
-- |
| Calcium |
-2 |
.033 |
-3 |
0.018 |
| Magnesium |
<.01 |
.009 |
-2 |
<.001 |
| Sodium |
<.01 |
.444 |
(b) |
-- |
| Potassium |
<.01 |
.433 |
(b) |
-- |
| Alkalinity |
-1 |
.276 |
-2 |
.071 |
| Sulfate |
-2 |
.008 |
-1 |
.006 |
| Chloride |
-.1 |
.192 |
(b) |
-- |
| Nitrite plus nitrate |
.2a |
<.001 |
-- |
-- |
| Silica |
-.2 |
.015 |
-.2 |
.016 |
a Trend test for highly censored data was used.
b Concentration-flow model not significant at a = 0.10.
Results of a surface-water synoptic sampling conducted July 30 and 31, 1992, in the Cache Creek Basin are presented in table 49, and locations of the sampling sites are shown in figure 24. Discharge at the HBN station (site 12) was 0.13 m³/s compared to the mean monthly discharge of 0.68 m³/s for the month of July (Smalley and others, 1996). The water type of all samples that were collected from tributaries and main-stem sites in the Cache Creek Basin was calcium bicarbonate. The sum of ions ranged from about 5,400 (site 4) to about 9,800 meq/L (site 11); the ion concentration at the HBN station (site 12) was about 6,600 meq/L. Concentrations of dissolved constituents at tributaries generally were within the range of dissolved constituents for the HBN station for the period 1965-95 (table 46). Quaternary deposits cover a large portion of drainage upstream from site 4 and may explain the higher discharge at this site. Quaternary deposits also make up a large part of the surficial geology upstream from site 11; however, stream discharge was low at site 11 during the synoptic sampling (less than 0.001 m³/s). The parent materials of the Quaternary deposits account for the differences in the water chemistry at these sites (sites 4 and 11). Rocks in the upper basin of site 4 are Cambrian shale and limestone, whereas rocks in the upper basin of site 11 are Permian rocks containing phosphorite. The phosphorite rocks probably contribute to the high sodium concentration at site 11 (870 meq/L). Cretaceous shales probably are the source of the elevated sodium concentrations at sites 1, 2, and 3. Sulfate concentrations were the highest in samples from sites 2 and 4. Site 4, which was sampled downstream from an abandoned coal mine, may have been affected by acid-mine drainage, as evidenced by iron staining on the streambed. The waters of these tributaries, however, were alkaline (pH values of 8.3 and 8.4, respectively). No difference was observed in the water quality at sites upstream (site 7) and downstream (site 6) from the mine on Noker Mine Draw. The percent difference of cations and anions in all samples ranged from 0.1 to 5.3 percent, indicating that unmeasured ions did not substantially contribute to the ionic composition of the water, but all were positive. Nitrate concentrations are low in all basins and are characteristic of undeveloped areas (Mueller and others, 1995).
[Site locations shown in fig. 24; Q, discharge in cubic meters per second; SC, specific conductance in microsiemens per centimeter at 25 degrees Celsius; pH in standard units; Ca, calcium; Mg, magnesium; Na, sodium; K, potassium; Alk, alkalinity; SO4, sulfate; Cl, chloride; NO3, nitrate; SiO2, silica; concentrations in microequivalents per liter, except silica is in micromoles per liter; --, not measured; <, less than; criteria used in selection of sampling sites: BG = bedrock geology, TRIB = major tributary, LU = land use]
|
Site |
Identification number |
Q |
SC |
pH |
Ca |
Mg |
Na |
K |
Alk |
SO4 |
Cl |
NO3 |
SiO2 |
Criteria |
|
1 |
432526110382100 |
0.007 |
399 |
8.3 |
3,100 |
1,100 |
170 |
18 |
4,000 |
54 |
25 |
0.4 |
77 |
BG |
|
2 |
432527110382500 |
.003 |
430 |
8.3 |
3,400 |
1,200 |
160 |
15 |
4,500 |
110 |
25 |
1.6 |
90 |
BG |
|
3 |
432539110382700 |
<.001 |
452 |
8.2 |
3,100 |
1,300 |
350 |
18 |
4,400 |
83 |
25 |
1.6 |
100 |
TRIB |
|
4 |
432552110384200 |
.07 |
260 |
8.4 |
1,800 |
800 |
22 |
14 |
2,600 |
110 |
17 |
4.9 |
57 |
LU |
|
5 |
432606110385600 |
.01 |
347 |
8.4 |
2,600 |
960 |
78 |
17 |
3,300 |
77 |
20 |
1.0 |
73 |
TRIB |
|
6 |
432615110391300 |
.03 |
303 |
8.5 |
2,000 |
1,100 |
52 |
15 |
3,100 |
67 |
20 |
3.0 |
72 |
LU |
|
7 |
432625110390700 |
-- |
304 |
8.4 |
2,000 |
1,100 |
48 |
15 |
3,100 |
60 |
17 |
4.2 |
72 |
LU |
|
8 |
432627110402200 |
.04 |
315 |
8.5 |
2,000 |
1,200 |
35 |
11 |
3,300 |
54 |
20 |
5.8 |
73 |
TRIB |
|
9 |
432647110395800 |
-- |
313 |
8.3 |
2,000 |
1,200 |
35 |
11 |
3,200 |
56 |
20 |
8.0 |
70 |
BG |
|
10 |
432647110400000 |
-- |
322 |
8.3 |
2,000 |
1,300 |
30 |
10 |
3,300 |
63 |
20 |
8.2 |
75 |
BG |
|
11 |
432559110385700 |
<.001 |
475 |
8.4 |
3,300 |
960 |
870 |
24 |
4,600 |
29 |
28 |
.7 |
110 |
BG |
|
12 |
13018300 |
.13 |
311 |
8.4 |
2,100 |
1,100 |
83 |
15 |
3,200 |
88 |
20 |
.6 |
73 |
-- |
Bailey, Robert G., 1995, Descriptions of the ecoregions of the United States: U.S. Department of Agriculture, Forest Service, Miscellaneous Publication 1391, 108 p.
Fenneman, N.M., 1946, Physical divisions of the United States: Washington, D.C., U.S. Geological Survey special map, scale 1:7,000,000.
Glenn, W.R., 1981, Soil resource inventory order 3, Cache Creek-Little Granite Creek EIS area, Bridger-Teton National Forest: U.S. Geological Survey Open-File Report 81-855, 51 p.
Lins, H.F., 1987, Trend analysis of monthly sulfur dioxide emissions in the conterminous United States, 1975-1984: Atmospheric Environment, v. 21, no.11, p. 2297-2309.
Lynch, J.A., Bowersox, V.C., and Grimm, J.W., 1995, Trends in precipitation chemistry in the United States-A national perspective, 1980-92: Atmospheric Environment, v. 29, no. 11. p. 1231-1246.
Mueller, D.K., Hamilton, P.A., Helsel, D.R., Hitt, K.J., and Ruddy, B.C., 1995, Nutrients in ground water and surface water of the United States-An analysis of data through 1992: U.S. Geological Survey Water-Resources Investigations Report 95-4031, 74 p.
National Climatic Data Center, 1996, Summary of the day, CD-ROM: Boulder, Colorado, EarthInfo Incorporated.
Simons, F.S., Love, J.D., Keefer, W.R., Harwood, D.S., and Kulik, D.M., 1988, Mineral resources of the Gros Ventre Wilderness Study Area, Teton and Sublette Counties, Wyoming: U.S. Geological Survey Bulletin 1591, 65 p.
Smalley, M.L., Woodruff, R.E., Clark, M.L., and McCollam, P.B., 1996, Water resources data, Wyoming, water year 1995: U.S. Geological Survey Water-Data Report WY-95-1, 393 p.
Smith, R.A., and Alexander, R.B., 1983, Evidence for acid-precipitation-induced trends in stream chemistry at hydrologic benchmark stations: U.S. Geological Survey Circular 910, 12 p.
a. U.S. Geological Survey topographic maps:
b. Geologic maps:
c. Soil surveys:
d. Other maps:
Table B-1. NWIS site-identification numbers and site names for water-quality sampling sites.
|
Site |
Identification Number |
Site Name |
|
1 |
432526110382100 |
upper Cache Creek |
|
2 |
432527110382500 |
unnamed tributary to upper Cache Creek |
|
3 |
432539110382700 |
unnamed tributary to upper Cache Creek near pack trail |
|
4 |
432552110384200 |
unnamed tributary to Cache Creek below coal mine |
|
5 |
432606110385600 |
unnamed tributary to Cache Creek above Noker Mine Draw |
|
6 |
432615110391300 |
Noker Mine Draw tributary near Cache Creek |
|
7 |
432625110390700 |
Noker Mine Draw tributary above mine |
|
8 |
432627110402200 |
unnamed tributary below Cache Creek Thrust Fault near Cache Creek |
|
9 |
432647110395800 |
east branch of Noker Mine Draw tributary above mine |
|
10 |
432647110400000 |
north branch of Noker Mine Draw tributary above mine |
|
11 |
432559110385700 |
unnamed tributary one mile upstream of Cache Creek gage |
|
12 |
13018300 |
Cache Creek near Jackson, Wyoming |
| Back to 1173-C Contents |
This page maintained by Nichole Bisceglia.
Last updated July 31, 2000.