
Hydrologic Benchmark Network Stations in the West-Central U.S. 1963-95 (USGS Circular 1173-C)
|
|
|
|
|
Encampment River above Hog Park Creek near Encampment, Wyoming (06623800)
Hydrologic Benchmark Network Stations in the West-Central U.S. 1963-95 (USGS Circular 1173-C)
|
|
|
|
|
Encampment River above Hog Park Creek near Encampment, Wyoming (06623800)
To download a printer friendly PDF version of this information click here.
This report details one of the approximately 50 stations in the Hydrologic Benchmark Network (HBN) described in the four-volume U.S. Geological Survey Circular 1173. The suggested citation for the information on this page is: <
|
Clark, M.L., Eddy-Miller, C.A., Mast, M.A., 2000, Environmental characteristics and water-quality of Hydrologic Benchmark Network stations in the West-Central United States, U.S. Geological Survey Circular 1173-C, 115 p. |
All of the tables and figures are numbered as they appear in each circular. Use the navigation bar above to view the abstract, introduction and methods for the entire circular, as well as a map and list of all of the HBN sites. Use the table of contents below to view the information on this particular station.
|
Table of Contents |
| 1. Site Characteristics and Land Use |
| 2. Historical Water Quality Data and Time-Series Trends |
| 3. Synoptic Water Quality Data |
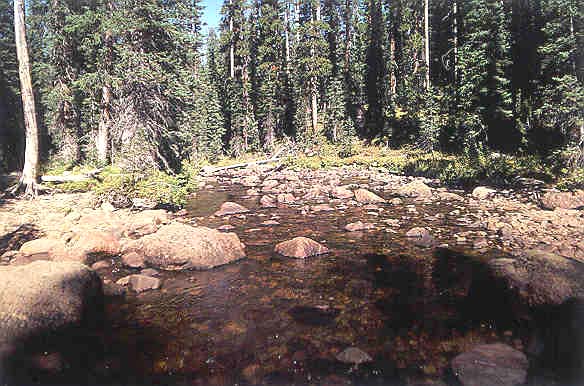
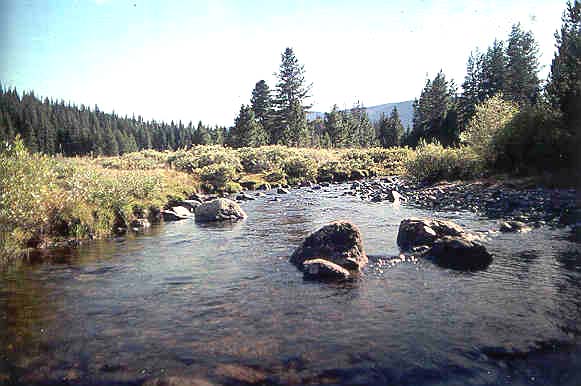
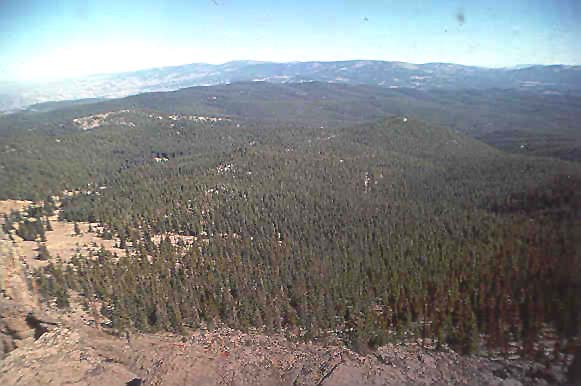
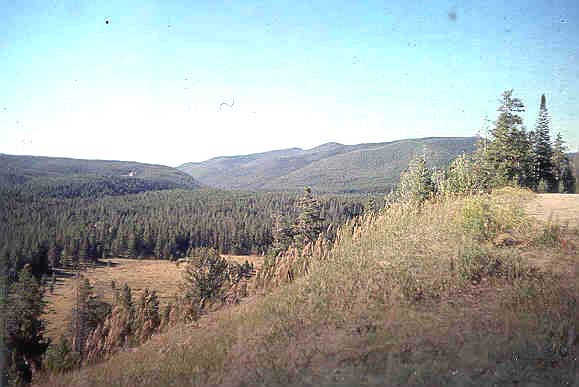
The Encampment River HBN Basin is in the Southern Rocky Mountains physiographic province (Fenneman, 1946) in northern Colorado and southern Wyoming (Figure 26. Map showing study area in Encampment River Basin and photograph of the East Fork Encampment River). The HBN station is 21 km south of Encampment, Wyo., at a latitude of 41×01'25'' and a longitude of 106×49'27''. The Encampment River drains 188 km² of mountainous terrain in the Park Range of northern Colorado and the Sierra Madres of southern Wyoming. Elevations in the basin range from 2, 520 to more than 3,470 m. The stream gradient of the main stream is about 19 m/km. The ecoregion of the basin is classified as the Southern Rocky Mountain Steppe-Open Woodland-Coniferous Forest- Alpine Meadow Province (Bailey, 1995). Over 90 percent of the area is covered by montane and subalpine forest types, including spruce and subalpine fir, lodgepole pine, and minor amounts of aspen (Jerry Schmidt, U.S. Forest Service, written commun., 1997). Vegetation of the alpine meadows and valleys includes grasses, wildflowers, and small shrubs. A small part of the basin is bare ground or rock, lying above timberline. The Encampment River is tributary to the North Platte River.
 |
The Encampment River is a perennial stream with a snowmelt-dominated hydrograph. Mean monthly discharge ranges from 0.52 m³/s during base flow in February to 17 m³/s during snowmelt runoff in June (Smalley and others, 1996). Average annual precipitation at the Encampment weather station is about 37 cm. Precipitation increases in the basin with increasing elevation. At the higher elevations, precipitation is about 76 cm, which mostly falls as snow during the period October through May (Cobb and Biesecker, 1971). Average annual runoff is about 50 cm. The climate of the basin is characterized by cold winters and mild summers. Mean monthly temperatures ranged from -5.8×C in January to about 17.2×C in July at the Encampment weather station during the period 1948-95 (National Climatic Data Center, 1996). Basin temperatures decrease with increasing elevation.
The geology of the basin is dominated by crystalline rocks. The rocks generally are resistant to erosion and form ledges and cliffs. Most of the area is underlain by intrusive and metamorphic rock types (Snyder, 1980; Houston and Graff, 1995). The Precambrian intrusive rocks are red to gray, massive, and range in composition from biotite granite to quartz monzonite to granodiorite. The metamorphic rocks include felsic gneiss and amphibolite metavolcanics that predominantly are faintly layered pink, gray, or green gneisses and are about 50 percent felsic and 50 percent mafic. Minerals in the metamorphic unit include quartz, feldspars, biotite, muscovite, magnetite, hornblende, garnet, sillimanite, and epidote. A small part of the southwestern part of the basin contains Permian or Triassic calcareous siltstone, shale, mudstone, and conglomerate. Precambrian metavolcanics and metasedimentary rocks are complexly folded and faulted (Snyder and others, 1987). Mineralization also occurred locally. Quaternary glacial till and remnant moraines lie within canyons and at the mouths of canyons.
|
Activities in the Encampment River HBN Basin that may affect water quality include logging operations, primarily at lower elevations, cattle grazing, and recreational use (Jerry Schmidt, U.S. Forest Service, written commun., 1997). Grazing was intense around the turn of the century and continued until the mid-1900's when animal numbers were reduced. Grazing by sheep continued until 1968, when the allotment was temporarily rested. In 1978, the allotment was reopened to cattle grazing. Timber harvest has occurred in many of the drainages outside the wilderness area from the early 1900's to present (2000). Timber harvest was minimal in the West Fork and East Fork Encampment River tributaries during the period 1960 to 1990. Timber harvest was allowed in these basins during 1990-96; a total of about 620 km² was harvested during this period. Best-management practices, including limiting clearcut size and tractor-logging harvesting, presently are used to minimize impact to forest resources. In the early 1900's, railroad ties were floated or driven down tributary creeks of the Encampment River (Young and others, 1994). The tie drives and stream clearing associated with the driving reduced channel complexity and decreased the amount of large woody debris in streams. Recreational use is mainly fishing, hiking, horseback riding, backpacking, and hunting. Some primitive camping takes place in the basin. One closed mine is in the upper East Fork drainage, but the site is dry with no visible drainage. Several mines that are in the immediate vicinity, but outside the drainage area, have produced minor amounts of ore (Snyder and others, 1987).
The data set analyzed for the Encampment River HBN station includes 204 water-quality samples that were collected from October 1964 to September 1995. Sampling frequency is described on the basis of water year, which begins on October 1 and ends on September 30. Generally, about 8-10 samples were collected each year from 1968 through 1982. Sampling frequency was quarterly for most of the remaining sampling period. Samples were analyzed at USGS district water-quality laboratories until the early 1970's. After 1973, with the creation of the USGS Central Laboratory System, all samples were analyzed at the water-quality laboratory (now called NWQL) in Arvada, Colo. The period of record for discharge is from water year 1965 to current water year (2000).
 |
Data quality was checked using ion balances and time-series plots. Calculated ion balances for samples with complete major-ion analyses are shown in Figures 27a and 27b. Temporal variation of discharge, field pH, major dissolved constituents, and ion balance at Encampment River, Wyoming. More than 90 percent of the samples had ion balances within the ±10 percent range, indicating that the major-ion analytical results generally were of good quality and that unmeasured constituents, such as organic anions, nutrients, and trace metals, generally do not contribute substantially to the ion composition of the stream water. Time-series plots of ion concentrations were inspected for data quality (fig. 27). Magnesium and sodium have slightly more scatter in the early part of the record and a decrease in scatter after 1983. This decrease coincides with a change in the analytical method for these analytes from AA spectroscopy to ICP spectroscopy (U.S. Geological Survey Office of Water Quality Technical Memorandum No. 82.18, 1982). The decrease in scatter of sulfate concentrations after 1982 corresponds with the change from a methylthymol blue procedure to a turbidimetric titration method (U.S. Geological Survey Office of Water Quality Technical Memorandum No. 83.07, 1983). The further decrease in the scatter of sulfate concentrations after 1990 corresponds with the change from turbidimetric titration to an ion-exchange chromatography analytical method (U.S. Geological Survey Office of Water Quality Technical Memorandum No. 90.04, 1989; U.S. Geological Survey Office of Water Quality Technical Memorandum No. 90.13, 1990). Changes also were made in meters and electrodes used for field pH determinations during the study period. When changes in methods or instrumentation result in improved precision or elimination of measurement bias, time-series data can exhibit less scatter or a directional shift, respectively. The time-series data, therefore, may reflect the method or instrument change rather than an environmental change.
The median and range of major-ion concentrations in the stream water collected at the Encampment River HBN station and VWM concentrations in wet precipitation measured at the Nash Fork NADP station are presented in table 50. The NADP station is about 80 km northeast of the HBN station. Precipitation chemistry at the NADP station was dilute and slightly acidic with a VWM pH of 5.2 during the period of record, 1987-92. The dominant cation in precipitation was calcium, which contributed 33 percent of the total cation concentration; ammonium contributed 25 percent and hydrogen contributed 22 percent. The dominant anions in precipitation were sulfate, which contributed 47 percent, and nitrate, which contributed 44 percent of the total anion concentration. A high proportion of nitrate in precipitation in the Rocky Mountains has been attributed to exhaust from cars and other vehicles in urban areas and agricultural activity in the Great Plains States (National Atmospheric Deposition Program/National Trends Network, 1997).
[Parameters in units of microequivalents per liter, except for discharge in cubic meters per second, specific conductance in microsiemens per centimeter at 25 degrees Celsius, pH in standard units, and silica in micromoles per liter; n, number of stream samples; VWM, volume-weighted mean; spec. cond., specific conductance; --, not reported; <, less than]
|
Parameter |
Stream Water |
Precipitation VWM |
|||||
|
Minimum |
First quartile |
Median |
Third quartile |
Maximum |
n |
||
| Discharge | 0.27 | 0.62 | 0.91 | 2.9 | 33 | 204 | -- |
| Spec. cond., field | 17 | 50 | 62 | 69 | 140 | 203 | -- |
| pH, field | 5.9 | 7.0 | 7.5 | 7.8 | 8.8 | 201 | 5.2a |
| Calcium | 160 | 300 | 390 | 420 | 550 | 203 | 9.7 |
| Magnesium | 8.2 | 88 | 120 | 140 | 310 | 204 | 2.0 |
| Sodium | 17 | 83 | 100 | 110 | 220 | 203 | 3.5 |
| Potassium | 5.1 | 18 | 20 | 23 | 46 | 201 | .48 |
| Ammonium | <.7 | <1.1 | 1.4 | 3.6 | 13 | 75 | 7.2 |
| Alkalinity, laboratory | 140 | 420 | 560 | 620 | 720 | 204 | -- |
| Sulfate | 2.1 | 54 | 75 | 100 | 330 | 203 | 14 |
| Chloride | <2.8 | 8.5 | 14 | 21 | 110 | 204 | 2.7 |
| Nitrite plus nitrate | <.7 | <3.6 | 6.4 | 7.1 | 21 | 107 | 13b |
| Silica | 97 | 150 | 180 | 190 | 310 | 204 | -- |
a Laboratory pH.
b Nitrate only.
Stream water in the Encampment River is a mildly alkaline, calcium bicarbonate type. The sum of ion concentrations ranged from about 510 to about 1,900 meq/L. Alkalinity ranged from 140 to 720 meq/L, and bicarbonate was the primary contributor to alkalinity at this station. The major cations in the stream water were calcium (62 percent), magnesium (19 percent), and sodium (16 percent). Bicarbonate, the major anion, contributed 86 percent of the median anion concentration. Dissolved solids generally are low at this site because granitic and gneissic bedrock is resistant to weathering. Annual precipitation and runoff data indicate that evapotranspiration can account for less than a twofold increase in stream-water concentrations compared to precipitation. About 38 percent of the median sulfate concentration can be attributed to precipitation after accounting for evapotranspiration. Similar to sulfate, only 39 percent of the median chloride concentration is attributable to precipitation. Igneous minerals, including hornblende, can contribute small amounts of chloride to stream water (Hem, 1992). Silica is a substantial component of the dissolved solids and is contributed by the feldspar- and quartz-rich rocks. Median concentrations of ammonium and nitrate were lower in the stream water than in the precipitation, indicating that nitrogen generally is retained by the biomass in the basin.
[Q, discharge; Ca, calcium; Mg, magnesium; Na, sodium; K, potassium; Alk, alkalinity; SO4, sulfate; Cl, chloride; SiO2, silica; --, not applicable]
|
|
Q |
pH |
Ca |
Mg |
Na |
K |
Alk |
SO4 |
Cl |
| pH |
-0.132 |
-- |
-- |
-- |
-- |
-- |
-- |
-- |
-- |
| Ca |
-.849 |
0.137 |
-- |
-- |
-- |
-- |
-- |
-- |
-- |
| Mg |
-.869 |
.110 |
0.935 |
-- |
-- |
-- |
-- |
-- |
-- |
| Na |
-.830 |
.125 |
.855 |
0.894 |
-- |
-- |
-- |
-- |
-- |
| K |
-.483 |
.209 |
.633 |
.571 |
0.576 |
-- |
-- |
-- |
-- |
| Alk |
-.777 |
.215 |
.782 |
.796 |
.738 |
0.512 |
-- |
-- |
-- |
| SO4 |
-.264 |
.044 |
.270 |
.328 |
.290 |
.359 |
0.099 |
-- |
-- |
| Cl |
.137 |
-.059 |
-.163 |
-.117 |
-.088 |
.168 |
-.177 |
0.353 |
-- |
| SiO2 |
-.864 |
.103 |
.850 |
.920 |
.862 |
.534 |
.699 |
.348 |
0.001 |
Correlations among dissolved constituents and discharge were determined for the Encampment River (table 51). The base cations and anions, except dissolved chloride, showed inverse relations with discharge. These results are consistent with a hydrologic system where base flow is diluted during periods of increased discharge, particularly annual snowmelt runoff. Ion concentrations in ground water tend to be greater than in surficial sources because the contact time with rocks and minerals is longer. The consistency and strength of the relations of calcium (rho value = -0.849), sodium (-0.830), magnesium (-0.869), and silica (-0.864) with discharge indicate that the high concentrations of these constituents, which
 |
Results of the seasonal Kendall test for trends in discharge and major dissolved constituents for the Encampment River from 1965 through 1995 are presented in table 52. A statistically significant upward trend (a = 0.01) for unadjusted pH was determined. The flow-adjusted test, however, did not confirm this trend. The large number of censored nitrate values resulted in insufficient data to calculate a trend for nitrate concentrations. The pattern in the scatter of nitrate concentrations in the time-series plot is a function of a change in the minimum reporting level for the laboratory method about 1991, rather than an environmental change. An upward trend in sulfate and a downward trend in alkalinity determined by Smith and Alexander (1983) at this station were no longer detected in the data. Precipitation-chemistry data have shown a decrease in sulfate concentrations in many regional NADP stations for the period 1980-92 (Lynch and others, 1995). No trend in stream-water sulfate was detected at this station, but concentrations were consistently low after about 1990.
[Trends in units of microequivalents per liter per year, except for discharge in cubic meters per second per year, pH in standard units per year, and silica in micromoles per liter per year; p-value, attained significance level; --, not calculated; <, less than]
|
Parameter |
Unadjusted |
Flow adjusted |
||
|
Trend |
p-value |
Trend |
p-value |
|
| Discharge |
-0.12 |
0.411 |
-- |
-- |
| pH |
.03 |
<.001 |
(a) |
-- |
| Calcium |
.6 |
.199 |
0.4 |
0.200 |
| Magnesium |
<.01 |
.651 |
-.02 |
.872 |
| Sodium |
<.01 |
.723 |
.06 |
.622 |
| Potassium |
<.01 |
.299 |
-.03 |
.255 |
| Alkalinity |
.9 |
.194 |
.7 |
.201 |
| Sulfate |
.09 |
.761 |
-.01 |
.970 |
| Chloride |
-.2 |
.040 |
(a) |
-- |
| Nitrite plus nitrate |
(b) |
-- |
-- |
-- |
| Silica |
<.01 |
.749 |
-.2 |
.221 |
a Concentration-flow model not significant at a = 0.10.
b Insufficient data to calculate trend.
Results of a surface-water synoptic sampling conducted September 10–12, 1990, in the Encampment River Basin are presented in table 53, and locations of the sampling sites are shown in figure 26. Discharge at the HBN station (site 14) was 0.54 m³/s compared to the mean monthly discharge of 0.90 m³/s for the month of September (Smalley and others, 1996). The water type of all tributary and main-stem sites sampled in the basin was calcium bicarbonate. The sum of ion concentrations in tributaries ranged from about 620 (site 4) to about 5,000 meq/L (site 3). The sum of ions concentration at the HBN station (site 14) was about 1,300 meq/L; concentrations of major cations and anions were near the median concentrations for the period 1965-95 (table 50). Concentrations of ions in tributary water samples were within the range of ion concentrations for the HBN station (table 49), except for concentrations of certain constituents at sites 2 and 3. Concentrations of calcium, magnesium, bicarbonate, and sulfate in the sample collected at the unnamed south tributary to the West Fork Encampment River (site 3) were much higher (3 to 10 times) than the median concentrations of ions in samples from the HBN station. The geology in the upper basin upstream from site 3 includes an area draining sedimentary rocks containing siltstone, shales, mudstone, and conglomerate. Water in contact with fine-grained sedimentary deposits such as these tends to have higher dissolved solids than water in contact with the more resistant Precambrian igneous and metamorphic rocks that are predominant in the rest of the basin. Contributions from this unnamed south tributary (site 3) contribute to the elevated concentrations of constituents in the upper West Fork Encampment River (site 2), particularly calcium, which exceeds the maximum concentration at the HBN station. Low dissolved solids were reported for sites 4 and 5. Pleistocene till deposits dominate the surficial geology around those sites. Rocks in the basin upstream from sites 4 and 5 are Precambrian quartz monzonite. The percent difference of cations and anions in all synoptic samples ranged from 0.2 to 3.8 percent, indicating that unmeasured ions did not substantially contribute to the ionic content of the water. Nitrate concentrations were low in all basins and are characteristic of undeveloped areas (Mueller and others, 1995).
[Site locations shown in fig. 26; Q, discharge in cubic meters per second; SC, specific conductance in microsiemens per centimeter at 25 degrees Celsius; pH in standard units; Ca, calcium; Mg, magnesium; Na, sodium; K, potassium; Alk, alkalinity; SO4, sulfate; Cl, chloride; NO3, nitrate; SiO2, silica; concentrations in microequivalents per liter, except silica is in micromoles per liter; --, not measured; <, less than; criteria used in selection of sampling sites: BG = bedrock geology, TRIB = major tributary, LU = land use]
|
Site |
Identification number |
Q |
SC |
pH |
Ca |
Mg |
Na |
K |
Alk |
SO4 |
Cl |
NO3 |
SiO2 |
Criteria |
|
1 |
405627106475100 |
-- |
51 |
7.8 |
280 |
140 |
100 |
19 |
500 |
27 |
4.8 |
<0.7 |
200 |
BG |
|
2 |
405603106474200 |
-- |
90 |
8.0 |
650 |
190 |
83 |
24 |
780 |
170 |
5.1 |
2.1 |
120 |
TRIB |
|
3 |
405508106472800 |
-- |
198 |
8.3 |
1,800 |
510 |
140 |
22 |
1,800 |
770 |
5.6 |
<.7 |
120 |
BG |
|
4 |
405409106431600 |
-- |
32 |
7.5 |
180 |
55 |
61 |
18 |
280 |
25 |
4.8 |
<.7 |
110 |
BG |
|
5 |
405414106432000 |
-- |
31 |
7.6 |
170 |
55 |
74 |
18 |
280 |
31 |
4.2 |
<.7 |
150 |
BG |
|
6 |
405528106440900 |
-- |
39 |
7.8 |
240 |
72 |
83 |
12 |
390 |
35 |
5.6 |
<.7 |
160 |
BG |
|
7 |
405731106452000 |
-- |
63 |
7.9 |
440 |
110 |
78 |
28 |
660 |
44 |
6.5 |
1.4 |
140 |
TRIB |
|
8 |
405731106451400 |
-- |
51 |
7.9 |
360 |
79 |
83 |
16 |
500 |
35 |
5.1 |
<.7 |
180 |
BG |
|
9 |
405831106460100 |
-- |
50 |
7.9 |
300 |
130 |
110 |
16 |
490 |
35 |
5.9 |
<.7 |
220 |
BG |
|
10 |
405916106482800 |
-- |
71 |
8.0 |
450 |
180 |
100 |
25 |
650 |
81 |
8.7 |
<.7 |
170 |
TRIB |
|
11 |
405919106481500 |
-- |
67 |
8.0 |
450 |
140 |
87 |
26 |
640 |
48 |
7 |
<.7 |
160 |
LU |
|
12 |
410039106460101 |
-- |
55 |
8.0 |
350 |
130 |
120 |
17 |
540 |
38 |
9.6 |
<.7 |
200 |
TRIB |
|
13 |
410041106460101 |
-- |
38 |
7.8 |
220 |
88 |
96 |
14 |
360 |
38 |
7.0 |
<.7 |
180 |
TRIB |
|
14 |
06623800 |
0.54 |
60 |
7.9 |
400 |
140 |
100 |
23 |
600 |
58 |
9.0 |
<.7 |
180 |
-- |
Bailey, Robert G., 1995, Descriptions of the ecoregions of the United States: U.S. Department of Agriculture, Forest Service, Miscellaneous Publication 1391, 108 p.
Cobb, E.D., and Biesecker, J.E., 1971, The National Hydrologic Benchmark Network: U.S. Geological Survey Circular 460-D, 38 p.
Fenneman, N.M., 1946, Physical divisions of the United States: Washington, D.C., U.S. Geological Survey special map, scale 1:7,000,000.
Houston, R.S., and Graff, P.J., 1995, Geologic map of Precambrian rocks of the Sierra Madre, Carbon County, Wyoming, and Jackson and Routt Counties, Colorado: U.S. Geological Survey Miscellaneous Investigations Series Map I-2452, 2 sheets.
Lynch, J.A., Bowersox, V.C., and Grimm, J.W., 1995, Trends in precipitation chemistry in the United States-A national perspective, 1980-92: Atmospheric Environment, v. 29, no. 11. p. 1231-1246.
Mueller, D.K., Hamilton, P.A., Helsel, D.R., Hitt, K.J., and Ruddy, B.C., 1995, Nutrients in ground water and surface water of the United States-An analysis of data through 1992: U.S. Geological Survey Water-Resources Investigations Report 95-4031, 74 p.
National Atmospheric Deposition Program/National Trends Network, 1997, Inside rain, a look at the National Atmospheric Deposition Program: Fort Collins, Colorado State University, Natural Resource Ecology Laboratory, 24 p.
National Climatic Data Center, 1996, Summary of the day, CD-ROM: Boulder, Colorado, EarthInfo Incorporated.
Smalley, M.L., Woodruff, R.E., Clark, M.L., and McCollam, P.B., 1996, Water resources data, Wyoming, water year 1995: U.S. Geological Survey Water-Data Report WY-95-1, 393 p.
Smith, R.A., and Alexander, R.B., 1983, Evidence for acid-precipitation-induced trends in stream chemistry at hydrologic benchmark stations: U.S. Geological Survey Circular 910, 12 p.
Snyder, G.L., 1980, Geologic map of the northernmost Park Range and southernmost Sierra Madre, Jackson and Routt Counties, Colorado: U.S. Geological Survey Miscellaneous Investigations Series Map I-1113, scale 1:48,000.
Snyder, G.L., Patten, L.L., and Daniels, J.J., 1987, Mount Zirkel Wilderness and northern Park Range vicinity, Colorado: U.S. Geological Survey Bulletin 1554.
U.S. Geological Survey, 1982, Program and plan-National water-quality networks FY1983: Office of Water Quality Technical Memorandum No. 82.18, accessed December 27, 1999, at URL http://water.usgs.gov/ admin/memo/.
U.S. Geological Survey, 1983, Analytical methods-Sulfate determinations: Office of Water Quality Technical Memorandum No. 83.07, accessed December 27, 1999, at URL http://water.usgs.gov/admin/memo/.
U.S. Geological Survey, 1989, Analytical methods-Turbidimetric sulfate method: Office of Water Quality Technical Memorandum No. 90.04, accessed December 27, 1999, at URL http://water.usgs.gov/admin/memo/.
U.S. Geological Survey, 1990, Programs and plans-National water-quality networks FY1991: Office of Water Quality Technical Memorandum No. 90.13, accessed December 27, 1999, at URL http://water.usgs.gov/admin/memo/.
Young, M.K., Haire, D., and Bozek, M.A., 1994, The effect and extent of railroad tie drives in streams of southeastern Wyoming: Journal of Applied Forestry, October 1994, v. 9, no. 4, p. 125-130.
a. U.S. Geological Survey topographic maps:
b. Geologic maps:
c. Soil surveys:
No soil survey available.
d. Other maps:
Table B-1. NWIS site-identification numbers and site names for water-quality sampling sites.
|
Site |
Identification Number |
Site Name |
|
1 |
405627106475100 |
unnamed tributary below Manzanares Lake |
|
2 |
405603106474200 |
West Fork Encampment River four miles upstream from gage |
|
3 |
405508106472800 |
unnamed south tributary to West Fork Encampment River |
|
4 |
405409106431600 |
Encampment River below Gem Lake |
|
5 |
405414106432000 |
unnamed tributary crossing Big Creek Trail |
|
6 |
405528106440900 |
unnamed tributary below Stump Park |
|
7 |
405731106452000 |
Encampment River above unnamed tributary below Buffalo Ridge |
|
8 |
405731106451400 |
unnamed tributary below Buffalo Ridge |
|
9 |
405831106460100 |
unnamed tributary below Dinner Park |
|
10 |
405916106482800 |
West Fork Encampment River |
|
11 |
405919106481500 |
Encampment River above West Fork Encampment River |
|
12 |
410039106460101 |
Damfino Creek |
|
13 |
410041106460101 |
East Fork Encampment River above Damfino Creek |
|
14 |
06623800 |
Encampment River above Hog Park Creek near Encampment, Wyoming |
| Back to 1173-C Contents |
This page maintained by Nichole Bisceglia.
Last updated July 31, 2000.