
MAJOR FINDINGS—Continued
Nutrients Were Detected in Streams and Ground Water
Nitrate nitrogen was the most frequently detected nutrient species in 146 samples collected from 7 streams that drain areas with differing land-use settings (Reiser, 1999) and in 220 samples collected from 108 monitoring wells, 82 domestic wells, and 30 public-supply wells. (See study design on pages 2829.)
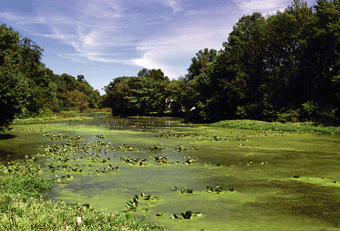 |
| Figure 14. Elevated concentrations of nutrients in streams and lakes can stimulate excessive growth of aquatic algae and vegetation and otherwise degrade water quality. |
Other nutrient species analyzed for during this study included nitrite, ammonia, and organic nitrogen; orthophosphate phosphorus; and phosphorus. These constituents were detected infrequently and at low concentrations in ground water (graphs on p. 36). In stream samples, these constituents were detected more frequently. Total phosphorus concentrations, for example, equaled or exceeded the New Jersey Department of Environmental Protection surface-water-quality criterion of 0.1 milligram per liter (mg/L) in nearly 40 percent of samples from the seven sites (p. 36). Phosphorus has been identified as a limiting nutrient that controls eutrophication (excessive growth of algae and vegetation) (fig. 14) in most New Jersey freshwater (New Jersey Department of Environmental Protection, 1998). Although phosphorus concentrations have declined in many locations throughout the State, exceedences of the phosphorus criterion are still common. Additional control of phosphorus to prevent or reduce eutrophication is being evaluated by water-resource managers and regulators.
The highest median concentration of nitrate was for samples of ground water collected from shallow monitoring wells in agricultural settings in the Coastal Plain of New Jersey (fig. 15). In fact, the median nitrate concentration of 13 mg/L reported for these shallow agricultural monitoring wells was the highest of 47 similar surveys conducted to date across the Nation as part of the NAWQA Program. Intensive use of nitrogen fertilizers and manure to support crop production and the well-drained, aerated soils of the Coastal Plain combine to favor the formation, leaching, and recharge of nitrate to ground water. Nitrate concentrations exceeded the drinking-water standard in 60 percent of these samples. The median nitrate concentration in streams draining predominantly agricultural basins was less than 2.0 mg/L.
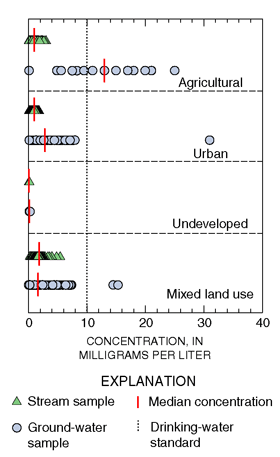 |
| Figure 15. Nitrate concentrations are higher in ground water than in streams for most land-use categories. |
The median concentration of nitrate in samples of shallow ground water underlying urban areas in the Coastal Plain of New Jersey was 2.8 mg/L as N (fig. 15). Again, the median nitrate concentration in streams draining predominantly urban basins was less than that of ground water. The median concentration of nitrate in samples of shallow ground water and streams in undeveloped areas of the Coastal Plain was less than 0.25 mg/L as N (fig. 15), reflecting a general absence of human inputs of nitrogen in these areas. In a similar study of shallow ground-water quality on Long Island, median nitrate concentrations were also highest in agricultural areas, intermediate in areas of suburban development, and lowest in undeveloped areas (Eckhardt and Stackelberg, 1995).
The median concentration of nitrate in water samples from domestic and public-supply wells in New Jersey (mixed land-use settings; fig. 15) was 1.6 mg/L as N. Domestic and public-supply wells sampled during this study are completed deeper in the aquifer than monitoring wells. Also, the domestic and public-supply wells are pumped at higher rates than the monitoring wells; thus, samples from these wells are less likely to have elevated nitrate concentrations than are samples from shallow monitoring wells in urban or agricultural areas.
The highest median and most variable concentrations of nitrate in streams were in large drainage basins that contain mixed land-use settings (fig. 15). These large drainage basins contain nonpoint sources of nitrate from agricultural and urban areas, as well as point sources such as effluent from wastewater-treatment plants.
| Nitrate in the environmentNitrate is a naturally occurring constituent in streams and ground water. Nitrate is formed by bacterial transformation of reduced (ammonia) and organic forms of nitrogen. It is introduced in excess of natural inputs to the environment through sources such as chemical fertilizers, manure, industrial wastes, sewage and septic-system effluents, and atmospheric deposition. Because nitrate is highly soluble and mobile, it enters streams in surface runoff and also leaches through permeable soils and recharges ground-water systems. The presence of nitrate in potable water supplies is of concern because ingestion of water with nitrate concentrations in excess of 10 mg/L as nitrogen (N) can sometimes lead to a blood disorder in infants commonly called blue-baby syndrome. The U.S. Environmental Protection Agency has established a Maximum Contaminant Level (MCL) of 10 mg/L as N for water delivered by public purveyors. |
Predicting Changes in Nitrate Concentrations in Streams and Wells
Difficulties in detecting water-quality changes (trends) in streams and ground water are linked to (1) the amount of time required for water to move through a drainage basin or aquifer system and discharge to a stream or well, (2) land-use and chemical-use changes over time, and (3) an inability to clearly separate hydrologic or water-quality trends from climatic variability. One approach to gaining a better understanding of potential trends is to use a computer model of the hydrologic system. A three-dimensional ground-water-flow model was developed to simulate the movement of nitrate from the water table, through the surficial aquifer system, to streams and public-supply wells in the surficial aquifer system in the Glassboro study area of southern New Jersey. The model integrates the hydraulic properties of the aquifer with land-use and nitrate-use changes over time to simulate nitrate concentrations at points of discharge (streams and wells).
In general, simulated nitrate concentrations matched concentrations measured in samples from public-supply wells in the study area, verifying that nitrate moves conservatively (that is, persists without being sorbed or chemically degraded) through the aquifer system. Simulated nitrate concentrations in three streams during base flow over a 9-year period, however, had to be multiplied by 0.6 to obtain a match with measured nitrate concentrations. Because nitrate appeared to move conservatively to wells, the apparent loss of nitrate in streams indicates that about 40 percent of the nitrate in aquifer recharge is removed by denitrification in the aquifer near the streams and (or) by in-stream processes. This finding is corroborated by the findings that median concentrations of nitrate in shallow ground water were consistently greater than those in streams draining similar land-use settings.
The model was also used to evaluate the effects of various hypothetical changes in nitrogen-use patterns on nitrate concentrations in streams and public-supply wells. The use of manure and nitrogen-based fertilizers has been steadily increasing since 1950 (Modica and others, 1998). In the year 2000, nitrate concentrations in recharge resulting from the hypothetical changes in nitrogen-use patterns were assumed to be (1) fixed at year 2000 levels, (2) reduced at a constant rate to zero in the year 2050, or (3) immediately reduced to zero (fig. 16).
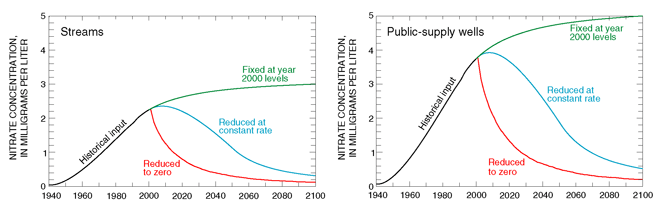 |
| Figure 16. Simulated concentrations of nitrate in streams and public-supply wells for three hypothetical nitrogen-use patterns, Glassboro study area, New Jersey. A decrease in nitrate concentrations to half of the concentration in year 2000 will take 10 or more years because of the amount of time required for water introduced before 2000 to move through the aquifer system. |
The model shows that the response of nitrate concentrations in streams and public- supply wells differs depending on the nitrogen-use pattern, but that in each case, the concentration of nitrate in streams and public-supply wells will not decline immediately, primarily because of the amount of time required for water to move through the aquifer system and discharge to a stream or well (fig. 16). In fact, if nitrate concentrations in recharge remain at current (year 2000) levels, the concentration of nitrate in streams and public-supply wells will actually continue to increase for several decades before leveling off at a concentration corresponding to the amounts of nitrate applied to urban, agricultural, and undeveloped lands in recharge areas.
Even if nitrate concentrations in recharge are reduced at a constant rate to zero in the year 2050, nitrate concentrations in streams and public-supply wells will continue to increase for 5 to 10 years (fig. 16). This lag in response is equivalent to the average age of water discharging to streams and public-supply wells. Because public- supply wells sampled for this study are screened near the bottom of the aquifer system, they withdraw water that is on average older than water discharging to streams. Thus, streams will respond faster to changes in land use or chemical use than public-supply wells will.
Finally, if the concentration of nitrate in recharge that had been steadily increasing since 1950 could be immediately reduced to zero in the year 2000 (fig. 16), the concentration of nitrate in streams and public-supply wells would begin to decrease almost immediately as the result of the influx of young, uncontaminated ground water. The decrease in nitrate concentrations in streams and supply wells to one-half of the concentration in the year 2000, however, would still take 10 or more years because of the amount of time required for water introduced before 2000 to move through the aquifer system and discharge to a stream or well.
In addition to predicting changes in the concentration
of nitrate in streams and public-supply wells over time, the model also
was used to predict changes in nitrate concentrations at a depth (90 to
100 feet below land surface) at which many domestic wells in the study
area are installed (fig. 17). Simulation results show that nitrate
concentrations at this depth will increase across the study area over
the next 50 years and will likely exceed the drinking-water standard for
nitrate in those areas where nitrogen fertilizer use is most intensive.
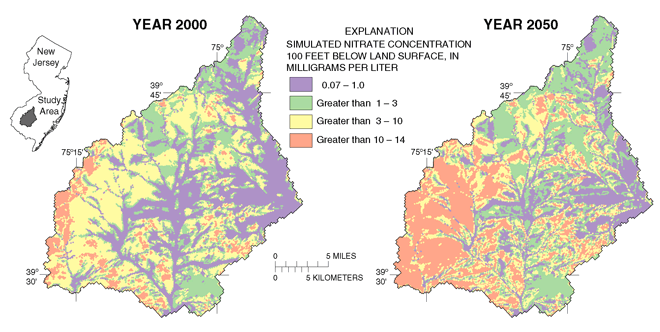 |
| Figure 17. Domestic wells in the Kirkwood-Cohansey aquifer of southern New Jersey are commonly completed at a depth of 90-100 feet below land surface. Simulated nitrate concentrations at this depth in the Glassboro study area for the years 2000 and 2050 indicate that ground water in areas of intensive nitrogen fertilizer use is likely to exceed the drinking-water standard for nitrate of 10 mg/L by 2050. This simulation assumes nitrate inputs remain unchanged from year 2000. |
Pesticides Were Detected in Streams and Ground Water
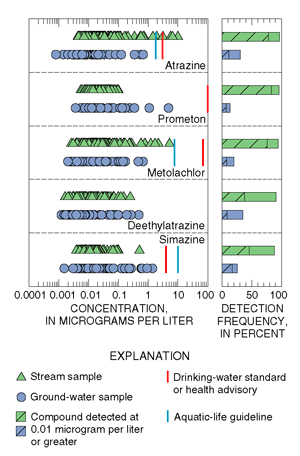 |
| Figure 18. Pesticides occur more frequently in streams than in ground water, but concentrations in both rarely exceed drinking-water standards. |
Pesticides were more prevalent in streams than in ground water. Concentrations in both water sources were generally low in the study area and rarely exceeded drinking-water standards (MCLs), drinking-water health advisories (HAs), or aquatic-life guidelines (AQLs) (fig. 18).
MCLs, HAs, or AQLs have not been established, however,
for 8 of the 41 pesticides detected in streams and 11 of the 38 pesticides
detected in ground water. Overall, one or more pesticide compounds were
detected in all but 1 of 146 stream samples (Reiser, 1999) and in 63 percent
of 220 ground-water samples. These findings are consistent with the
national findings to date from the NAWQA Program in which low-level
concentrations of pesticides were detected in almost every stream sample
and in about one-half of all ground-water samples (U.S. Geological Survey,
1999).
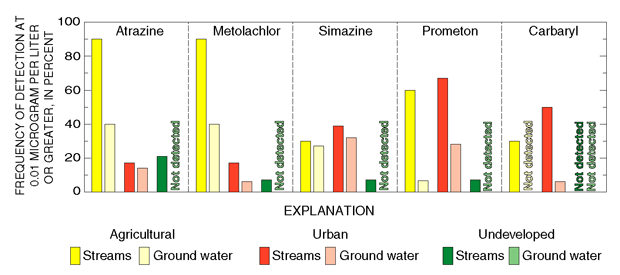
The five most frequently detected pesticides in stream and ground-water
samples were herbicides and a herbicide metabolite (fig. 18). (Metabolites
form when a parent compound degrades.) Atrazine and metolachlor are among
the most heavily applied agricultural herbicides in New Jersey (fig. 19;
blue text box below). Prometon and simazine, however, have little reported
use by licensed applicators in New Jersey. These herbicides are available
for purchase and use by nonlicensed applicators such as homeowners, and
their frequent detection in this study likely reflects their use by the
general public.
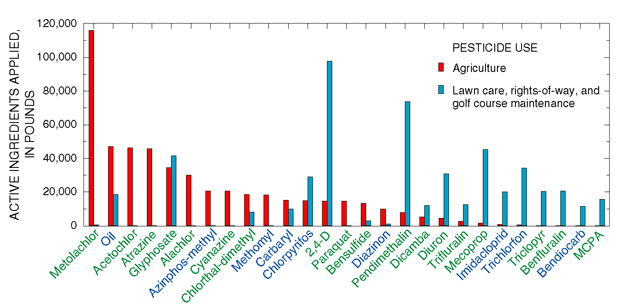 |
| Figure 19. Metolachlor and chlorpyrifos are the herbicides and insecticides most heavily applied by licensed applicators in New Jersey, 1997-98. (Data from New Jersey Department of Environmental Protection, Pesticide Control Program, Trenton, N.J.) |
| Pesticide use--A pesticide is any substance or mixture of substances used to control pests, such as insects (insecticides), weeds (herbicides), and fungi (fungicides). Pesticides have long been used in agricultural settings, and their use in urban and undeveloped areas has increased in the last several decades (Barbash and Resek, 1996). More than 10,000 products containing more than 400 major active ingredients are currently registered for use as pesticides in New Jersey (Hamilton and Meyer, 1994). Agriculture accounts for the largest use of pesticides; more than 1.4 million pounds of active ingredients were applied by licensed applicators in 1997 (fig. 19). Residential lawn care accounts for the second largest use; more than 500,000 pounds of active ingredient (mostly herbicides) were applied by licensed applicators in 1998. Maintenance of golf courses and control of weeds in right-of-way areas account for most remaining pesticide use by licensed applicators. |
Pesticide Detections Vary by Season and in Response to Land Use
Concentrations of pesticides in streams vary throughout the year in response to seasonal patterns in pesticide applications (U.S. Geological Survey, 1999). Pesticide concentrations in samples collected from some agricultural streams during high flows soon after crop application (late spring to early summer) exceeded drinking-water guidelines (Reiser, 1999). For example, concentrations of the herbicide atrazine increased as much as 500 percent in samples of Raritan River runoff during May-July (fig. 20). The Raritan River Basin is about 30 percent agricultural land on which atrazine is applied during the spring.
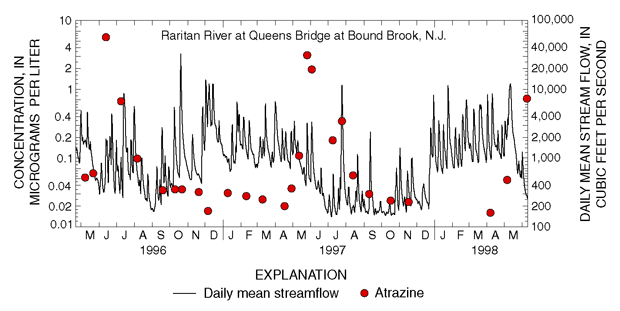 |
| Figure 20. Concentrations of atrazine and other pesticides are highest during high streamflow in MayJuly following the AprilJune application period. |
Herbicides such as atrazine and metolachlor that are used primarily for agricultural weed control were detected most frequently, and at highest concentrations, in samples from streams whose drainage basins contained about 25 percent or more agricultural land (fig. 21; Reiser and OBrien, 1999) and in samples of shallow ground water underlying agricultural settings in New Jersey (fig. 22; Stackelberg and others, 1997). Atrazine and metolachlor are also frequently detected in shallow ground water underlying agricultural settings on Long Island (Phillips and others, 1999).
The herbicide prometon was detected most frequently in streams and shallow ground water associated with urban settings in New Jersey (fig. 22) and on Long Island (Phillips and others, 1999). Prometon is used in areas where total vegetation control is desiredfor example, along roadways, rail ways, and other rights-of-way. Although prometon is not among the most commonly used herbicides by licensed applicators in New Jersey, it is available commercially and ranked 14th nationally for home and garden herbicide use (U.S. Geological Survey, 1999). In New Jersey, prometon was frequently detected in streams that drain mixed land-use areas, a reflection of its use along roadways and around homes.
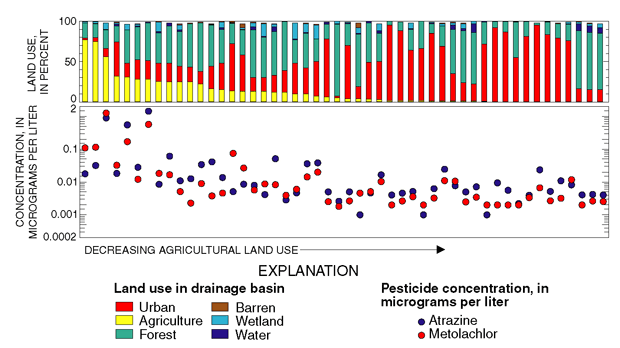 |
| Figure 21. Concentrations of atrazine and metolachlor in samples from 50 stream sites were related to agricultural land use (from Reiser and OBrien, 1999). |
The herbicide simazine, which is used in agricultural and nonagricultural settings, was detected in streams and shallow ground water underlying agricultural and urban areas in New Jersey (fig. 22) and on Long Island (Phillips and others, 1999). The insecticide carbaryl, which also is used in agricultural and nonagricultural settings, was detected almost exclusively in samples from streams. During this study, carbaryl was the fourth most commonly applied agricultural insecticide and the fifth most commonly applied lawn-care insecticide by licensed applicators in New Jersey. Carbaryl is also available commercially to nonlicensed applicators such as homeowners. Despite its high rate of use, carbaryl was infrequently detected in ground water in New Jersey or on Long Island (Phillips and others, 1999). This finding demonstrates that high application rates alone do not necessarily result in the detection of pesticides in ground water.
 |
| Figure 22. Pesticides are detected more frequently in streams and ground water in agricultural and urban areas than in undeveloped areas. |
Pesticide Detections in Ground Water Are Related to Pesticide Properties
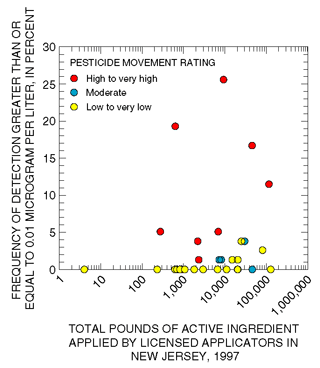 |
| Figure 23. Pesticides with high to very high movement ratings have the highest detection frequency (5 to 26 percent) in ground water even when applied in relatively small quantities. |
The most commonly used pesticides are not necessarily the most frequently detected in samples of shallow ground water. Various properties dictate pesticide persistence or mobility in the environment and make certain pesticides more likely to be detected in ground water and other pesticides less likely, regardless of the quantity applied at land surface. Vogue and others (1994) derived a movement rating for pesticide compounds in ground water based on expected persistence (soil half-life) and mobility or tendency to adsorb to soil particles (soil-sorption coefficient). Thirty-four pesticides analyzed during this study for which usage data are available were classified by the method of Vogue and others (1994) as having low to very low, moderate, or high to very high movement ratings. Pesticides with low to very low or moderate movement ratings were seldom detected (less than 5 percent) in samples of shallow ground water, even if applied in large quantities (fig. 23). In contrast, pesticides with high to very high movement ratings were detected more frequently (5 to 26 percent) even if applied in relatively small quantities.
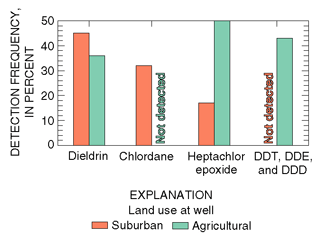
Organochlorine Insecticides Were Detected in Streams and Ground Water
Even though the use of many organochlorine compounds has been discontinued, their widespread historical application and environmental persistence have led to frequent detection in streambed sediments (Stackelberg, 1997) and in whole-fish tissue samples (Long and others, 2000) (see blue text box and discussion on p. 9). During this study, the organochlorine insecticide dieldrin, which was used historically to control termite populations in residential settings and, to a lesser extent, to control insects in agricultural settings, was detected in 24 to 27 percent of samples from monitoring and public-supply wells in southern New Jersey (Stackelberg and others, 2000). Agricultural uses of dieldrin were discontinued in the 1970s, and its use as a termiticide was canceled in the mid-1980s, 10 years before the collection of these ground-water samples. Dieldrin was also detected in nearly 20 percent of samples from streams that drain agricultural areas during this study (Reiser and OBrien, 1999).
 |
|
| Figure 24. Detection frequency of the four most commonly detected organochlorine insecticides in shallow ground water on Long Island. (Data from LeaMond and others, 1992.) |
Organochlorine insecticides were detected in 52 and 100 percent of samples of shallow ground water underlying suburban and agricultural areas, respectively, in a similar study on Long Island in the mid-1980s (Eckhardt and Stackelberg, 1995). Dieldrin, chlordane, and heptachlor epoxide (a metabolite of heptachlor) were the most frequently detected organochlorine insecticides in areas of suburban development where they were used for termite control (fig. 24). Dieldrin and heptachlor epoxide, as well as DDT and its metabolites DDD and DDE, also were frequently detected in samples from agricultural areas where they were used historically to control potato beetles and other agricultural pests.
More recently, three organochlorine compounds were detected in samples from 50 wells in the surficial aquifer system on Long Island (Phillips and others, 1999). The metabolite DDE was detected in 30 percent of these samples 25 years after all uses of its parent compound DDT were canceled. The frequent detection of organochlorine compounds in ground water 10 to 25 years after their use was discontinued demonstrates the environmental persistence of these compounds. The frequent occurrence of organochlorine insecticide metabolites such as heptachlor epoxide, DDD, and DDE also demonstrates the need to consider degradation products in assessments of pesticide occurrence in ground water.
Pesticide Metabolites Were Frequently Detected in Ground Water
Many pesticide compounds are unstable in soil and the unsaturated zone and thus readily degrade to other compounds (metabolites), some of which can be of equal or greater toxicity than the parent compound. Currently, Federal drinking-water standards and health advisories have not been established for pesticide metabolites. In southern New Jersey, deethylatrazine, a metabolite of atrazine, was the most frequently detected pesticide compound in samples from public-supply wells and the second most frequently detected pesticide in samples from monitoring wells (Stackelberg and others, 2000).
The presence of pesticide metabolites in ground water was more thoroughly evaluated on Long Island by Phillips and others (1999). Of the 25 pesticide compounds detected in samples from 50 wells in the surficial aquifer system on Long Island, 9 (36 percent) were pesticide metabolites. Furthermore, the highest pesticide concentrations reported by Phillips and others (1999) were generally those of herbicide metabolites.
 |
 |
| Figure 25. Examples of nonpoint sources include widespread application of fertilizersand pesticides over agricultural and urban areas (left), and vehicular and industrial emissions in urban areas (right). | |
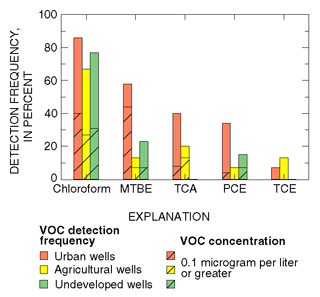
VOCs Were Detected in Streams and Ground Water
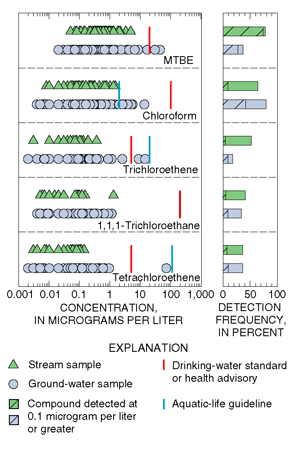 |
| Figure 26. Volatile organic compounds (VOCs) occur frequently in streams and ground water, but concentrations are low and rarely exceed drinking-water standards. |
Volatile organic compounds (VOCs; blue text box on next page) were frequently present in streams and ground water. Concentrations, however, were generally low and rarely exceeded MCLs, HAs, or AQLs (fig. 26). MCLs, HAs, and AQLs have not been established for 19 of the 47 VOCs detected in stream samples nor for 20 of the 58 VOCs detected in samples of ground water. Overall, one or more VOCs were detected in 93 percent of 112 stream samples (Reiser and OBrien, 1998) and in 91 percent of 220 ground-water samples. These findings are consistent with national findings to date from the NAWQA Program in which VOCs shown in figure 26 were among the most frequently detected in samples of stream water nd ground water (Squillace and others, 1999).
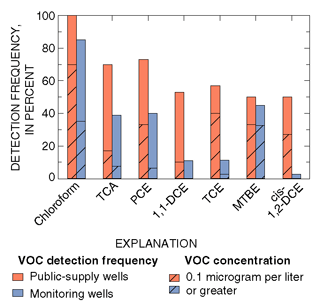
The most frequently detected VOCs in streams and ground-water samples are compounds used in gasoline or commercial and industrial processes, or are by-products of the chlorination of water (fig. 26; blue text box on p. 21). Methyl tert-butyl ether (MTBE) is a fuel oxygenate added to gasoline to enhance combustion and reduce atmospheric concentrations of carbon monoxide and ozone. Trichloromethane (chloroform) can form as a by-product of the chlorination of water, and it is also used as an industrial solvent, an extracting agent, and in the production of other synthetic compounds. Trichloroethene (TCE), 1,1,1-trichloroethane (TCA), and tetrachloroethene (PCE) are three of the most extensively used VOCs in commercial and industrial applications. These compounds were detected in shallow ground water on Long Island and in the Glassboro study area. Concentrations were greater in samples from Long Island (fig. 27) because suburban areas on Long Island were already heavily developed in the 1960s and early 1970s when use of these chlorinated solvents was greatest. Many parts of the Glassboro study area, however, were not developed until after use of these compounds was restricted.
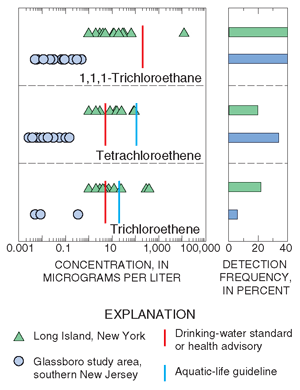 |
| Figure 27. The concentrations of chlorinated solvents in ground water underlying urban areas were higher on Long Island than in southern New Jersey (Long Island data from LeaMond and others, 1992). |
VOC Detections Vary by Season and in Response to Land Use
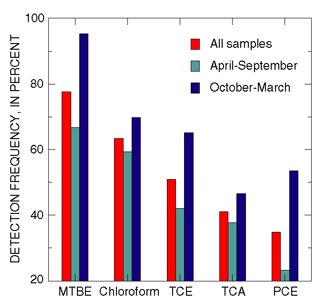 |
| Figure 28. The detection frequency of volatile organic compounds most commonly detected in streams was higher in the cool months than in the warm months (from Reiser and OBrien, 1998). |
Detection frequencies of the VOCs most frequently detected in streams were higher in samples collected during the cool months than during the warm months (fig. 28) (Reiser and OBrien, 1998). This seasonal pattern may be attributable to the lower volatility and the greater partitioning of these compounds from air to water at cooler temperatures. Higher detection frequencies for MTBE also may result from increased amounts of MTBE added to gasoline during the winter in the study area.
In contrast, concentrations of chloroform were higher in the warm months than in the cool months at six of the seven streams. This seasonal pattern is likely attributable to a decrease in streamflow during warm months, when inputs of chlorinated water from wastewater-treatment plants, swimming pools, and other outdoor uses of chlorinated water are less diluted (Reiser and OBrien, 1998).
Fifty VOCs were detected in samples from 42 stream sites on Long Island and in New Jersey that drain basins with various and-use settings. In general, the number and concentration of VOCs detected were highest in streams with the highest percentages of urban land use (O'Brien and others, 1997; Terracciano and OBrien, 1997) (fig. 29). A few exceptions were found at sites draining primarily forested land, an indication of unidentified point sources in these basins.
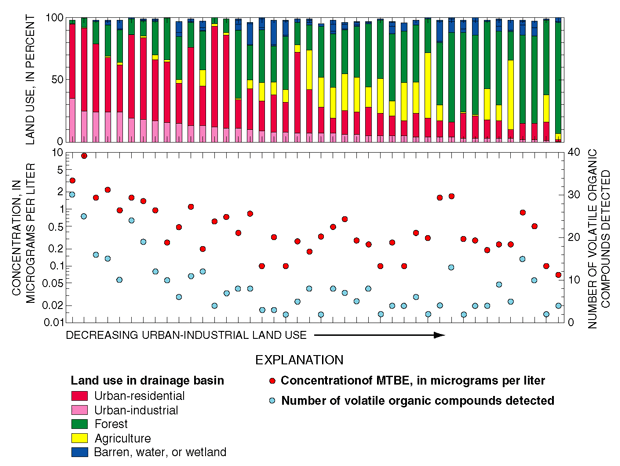 |
| Figure 29.The concentration of methyl tert-butyl ether (MTBE) and the total number of volatile organic compounds (VOCs) generally were related to the amount of urban land use in the drainage basin (from OBrien and others, 1997). |
Thirty-eight VOCs were detected in 78 samples of shallow ground water collected in southern New Jersey (Stackelberg and others, 1997). Consistent with national findings to date, detection frequencies and concentrations of the most frequently detected VOCs generally were highest in urban areas and lowest in agricultural and undeveloped areas (fig. 30). This more frequent detection of VOCs is the result of increased human activity and greater VOC use in urban areas.
 |
|
| Figure 30. Detection frequencies of volatile organic compounds (VOCs) generally were highest in urban areas and lowest in agricultural and undeveloped areas. |
The presence of VOCs in ground water underlying Long Island is also related to urban land use. Nearly all samples of ground water underlying Kings and Queens Counties, which form the New York City Boroughs of Brooklyn and Queens, contained one or more VOCs (Spinello and others, 2000). MTBE was the most frequently detected VOC, followed by chloroform, toluene, and TCA.
In samples of ground water underlying Nassau and Suffolk Counties on Long Island, VOCs were detected most frequently (54 percent detection greater than 1 µg/L) in areas of suburban development where industry and commercial services that use VOCs are interspersed with residential housing, and least frequently (3 percent) in agricultural and undeveloped areas (Eckhardt and Stackelberg, 1995).
Public-Supply Wells in Surficial Aquifers Are Vulnerable to VOCs
 |
| Figure 31. Volatile organic compounds (VOCs) were detected more frequently and in higher concentrations in samples from public-supply wells than from monitoring wells in the Glassboro study area, New Jersey. |
In the surficial Kirkwood-Cohansey aquifer system underlying the Glassboro study area, the number and total concentration of VOCs per sample were significantly greater in water from public-supply wells than in water from monitoring wells (Stackelberg and others, 2000) (fig. 31). VOCs in ground water can be derived from both point and nonpoint sources (blue text box, p. 21). Within the Glassboro study area, however, the atmosphere was determined not to be a nonpoint source for most VOCs (Baehr and others, 1999b; blue text box below). Point sources (such as spills) and nonpoint sources (such as urban stormwater runoff) are more common in urban areas and lead to spatially variable concentrations of VOCs near the water table.
Because much larger volumes of water are withdrawn from public-supply wells than from monitoring wells, their contributing areas are larger and, therefore, more likely to intercept water flowing from VOC sources, especially point sources. Additionally, results of ground-water-flow simulations indicate that public-supply wells in the Glassboro study area intercept relatively young water flowing along short paths, making the wells vulnerable to contamination by the VOCs that are frequently detected in recently recharged ground water. These public-supply wells, however, also intercept water flowing along longer paths associated with longer residence times. This water is more likely than water from shallow monitoring wells to contain VOCs derived from the degradation of parent compounds or VOCs that had significant historical use that has recently been reduced or phased out. Monitoring wells sampled during this study were completed at depths near the water table and, thus, intercept relatively short flow paths.
| Evaluating the sources of VOCs in ground waterResults of work done as part of the NAWQA Program indicate that VOCs are frequently detected at low-level concentrations in shallow ground water in urban areas across the Nation (Squillace and others, 1999). Consistent with this national finding, several VOCs including trichloromethane (chloroform), MTBE, TCA, PCE, and TCE were frequently detected at low concentrations in shallow ground water underlying the Glassboro study area (Stackelberg and others, 1997). To improve understanding of the source(s) of these compounds, samples of VOCs in the atmosphere and unsaturated-zone gas also were collected (Baehr and others, 1999a). Atmospheric concentrations of MTBE were high enough to explain all but seven of the ground-water detections. In contrast, the atmosphere was ruled out as a likely source for all other VOCs because their atmospheric concentrations were not high enough to explain even the lowest detection in ground water. Concentrations of VOCs in unsaturated-zone gas provide further insight into the likely source(s) of these compounds (Baehr and others, 1999a). For example, at about 43 percent of the sites where MTBE was detected in both ground water and unsaturated-zone gas, the concentration in ground water was greater than could be explained by atmospheric or unsaturated-zone gas concentrations. At these sites, the movement of MTBE appears to be upward from ground water to the unsaturated zone. The likely source of MTBE at these sites is an upgradient gasoline source (such as a spill, urban runoff, or leaky underground storage tank) with MTBE migrating to the site as a solute in ground water. At 28 percent of the sites where MTBE was detected in both ground water and unsaturated-zone gas, the concentration in ground water was less than the water-equivalent concentration in the unsaturated-zone gas, but within the atmospheric concentration range, indicating a net movement of MTBE downward across the water table with the atmosphere being the likely source. At the remaining sites, the source of MTBE in ground water could be either the atmosphere or an upgradient source. At sites where the other VOCs were detected in both ground water and unsaturated-zone gas, the concentration gradient indicates that these compounds are moving upward from ground water to the unsaturated zone and, thus, are likely derived from upgradient sources. |
VOCs and Pesticides Occur Together in Ground Water
Drinking-water standards and guidelines described in this report are based on the toxicity of individual compounds and not on combinations of compounds. Results from this and other NAWQA studies, however, clearly indicate that most pesticides and VOCs found in streamwater or ground-water samples occur as mixtures of two or more compounds (Stackelberg and others, in press; U.S. Geological Survey, 1999; Squillace and others, 1999).
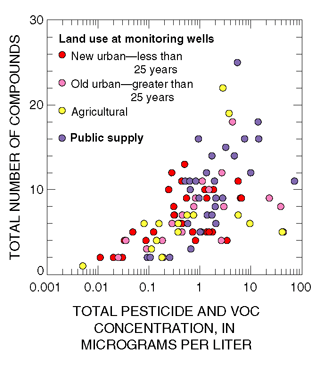 |
| Figure 32. The total concentration of pesticides and volatile organic compounds (VOCs) in each sample increased significantly as the number of compounds detected in each sample increased. |
In this study, nearly all of 146 stream samples contained 5 or more pesticide compounds, and nearly 50 percent of these samples contained 9 or more pesticide compounds (Reiser, 1999). In addition, two or more pesticides and (or) VOCs were detected in more than 95 percent of samples collected from public-supply and monitoring wells in the Glassboro study area. Total pesticide and total VOC concentrations per sample increased significantly as the number of detected compounds per sample increased (fig. 32). Most pesticides and VOCs in samples from public-supply and monitoring wells in the Glassboro study area were detected at concentrations less than 1 mg/L (figs. 18 and 26). The sum of these organic compounds, however, was greater than 1 µg/L in 45 percent of these samples (fig. 32).
More than 400 combinations of pesticides and VOCs were detected in 20 percent or more of public-supply well samples in southern New Jersey. The most frequently detected pesticides and VOCs constitute the most frequently occurring combinations (fig. 33). Although certain pesticides and VOCs commonly occurred together in samples of water from public-supply and monitoring wells, other pesticides and VOCs were found to commonly occur together only in one or the other well network. As discussed previously, compared to samples from monitoring wells, samples from public-supply wells are more likely to contain constituents that (1) were used in greater quantities in the past, (2) were introduced from point sources, and (or) (3) were derived from the degradation of parent compounds along extended flow paths. For VOCs, samples from public-supply wells in the surficial aquifer system of southern New Jersey commonly contain more combinations more frequently than samples from monitoring wells.
![Figure 33. Certain mixtures of pesticides and volatile organic compounds were common in samples from public-supply and monitoring wells, Kirkwood-Cohansey aquifer system, Glassboro study area, New Jersey. [DEA=deethylatrazine; CE=tetrachloroethene;TCA=1,1,1-trichloroethane; TCE=trichloroethene; 1,1-DCE=1,1-dichloroethene]](images/linj_fig033.gif) |
| Figure 33. Certain mixtures of pesticides and volatile organic compounds were common in samples from public-supply and monitoring wells, Kirkwood-Cohansey aquifer system, Glassboro study area, New Jersey. [DEA=deethylatrazine; PCE=tetrachloroethene; TCA=1,1,1-trichloroethane; TCE=trichloroethene; 1,1-DCE=1,1-dichloroethene] |
Implications of Findings for the Management of Water and Ecological Resources
Activities associated with urban and agricultural land use are the primary factors that affect the quality of streams and surficial aquifer systems and the health of aquatic life in the LINJ study area (fig. 34). The frequent detection of nutrients, synthetic organic compounds, and trace elements over a wide range of concentrations indicates a complex integration of the effects of current and historical point and nonpoint sources of these constituents. In addition, some constituents are present naturally in ground water in areas where surficial sediments or geologic formations are known to contain these constituents.
The restriction or cancellation of the use of some trace elements and synthetic organic compounds has been effective in reducing their concentrations in the environment, as evidenced by their declining concentrations in lake-sediment cores. Furthermore, stream quality, as determined by fish-community measures, improved from the 1970s to the 1990s largely as a result of wastewater-treatment-plant upgrades implemented under provisions of the Clean Water Act. In contrast, the concentrations of compounds whose uses have not been canceled, such as zinc and PAHs, continue to increase in urban lake sediments as a result of their association with increasing fossil-fuel use and vehicular traffic. In addition, findings from this study indicate that changes in the natural flow of streams, habitat degradation, reduction in biological diversity, and a shift toward species more tolerant of disturbance are associated with urban and suburban development.
The expected continued growth of population in the study area will likely continue to have a significant effect on stream- and ground-water quality and aquatic communities. Results of this study indicate that land development and management approaches that help maintain or increase base flow in flow-stressed streams and reduce flow variability during storms can promote improved water quality and stream health. For example, increasing recharge and otherwise reducing runoff in new or existing developments will likely increase stream base flow and reduce stream flashiness, both of which would benefit aquatic communities. Increased aquifer recharge also would benefit water supply if the quality of that recharge is not impaired. Furthermore, actions that prevent the loss of forests and wetlands, especially in riparian buffer areas, would also moderate the effects of development and provide improved habitat for native plants and animals.
Population growth in the study area has resulted in an increasing reliance on surface-water and surficial ground-water sources for public and domestic supply. Currently, 60 to 80 percent of the water supply in the study area is derived from these sources. The Safe Drinking Water Act provides regulatory oversights to maintain and monitor the quality of these vulnerable public-water supplies. Similar regulatory oversights are not currently in place for domestic (household) supplies, but results from domestic-well surveys in this study indicate that these systems are also vulnerable to contamination.
The Glassboro ground-water-flow model indicates that nitrate concentrations will increase significantly over the next 50 years in those parts of the Coastal Plain surficial aquifer system that underlie areas of intensive use of manure and nitrogen-based fertilizers. Furthermore, the model indicates that likely changes in land-management or chemical-use practices will not necessarily result in immediate improvements in the quality of water discharging to streams or being pumped from public-supply wells. Rather, the model indicates that nitrate concentrations will likely increase for several years following any changes in chemical use or land-management practices because of the length of time required for water to move through the aquifer system and discharge to streams or wells. The success of monitoring strategies designed to measure the effectiveness of stormwater management, chemical-use management, and other land-management, development, and restoration activities is reliant on incorporating this understanding of the hydrologic system.
Actions that would help to ensure safe and reliable sources of drinking water into the future and to protect stream habitats and aquatic communities include (1) adequate monitoring and assessment of water quantity and quality, and biological resources, (2) land-development and watershed-management approaches that mitigate the effects of urbanization on these resources, and (3) a close linkage of water-supply planning and development with land-use planning and watershed-management strategies that favor improvement of water quality and quantity. Given the prospect for continued population growth in the region, an increased vigilance in terms of monitoring and assessment of water and related resources likely is warranted.
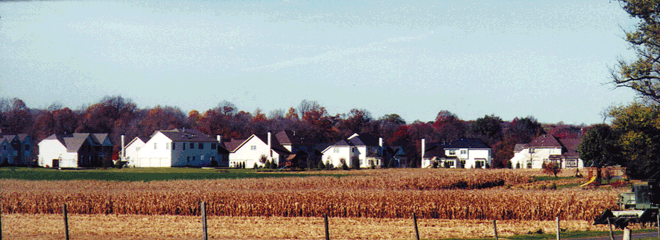 |
| Figure 34. New urban areas commonly are displacing agricultural and (or) forest land in the study area. Specifically, urban land area has grown from 22 percent of the study area in the early 1970s to 33 percent in 1995, with a corresponding 11-percent decrease in agricultural and forest land. |
| "The need of wholesome water for household consumption, as also good water for use in the arts, has prompted many inquiries about the available sources from which steady and abundant supplies of such water may be had, and the large number of these inquiries has demonstrated the necessity of gathering all of the facts relative to the occurrence of waters on the surface and in the earthy and rocky beds under it... The importance of this question of water supply to our citizens, most of whom are dependent upon public water-supply systems, and its intimate relation to the general health, make it deserving of the time and space which has been allotted to it in this report. The subject is a growing one and the conditions are so rapidly changing that no report thereon can be considered final. The space here given to it is inadequate to its full discussion. It merely rounds out an epoch in the accumulation of information therein for public use." (Taken from the preface by John C. Smock, New Jersey State Geologist, in Cornelius C. Vermeule, 1894, Water SupplyWater power, the flow of streams and attendant phenomena: Geological Survey of New Jersey Report, v. 3, 352 p.) |
| Table of Contents || Previous Section || Next Section || Glossary U.S. Geological Survey Circular 1201 Suggested citation:
|
