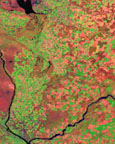
| This satellite image of the Central Columbia Plateau, taken in 1992, shows irrigated fields in green and fallow fields and rangeland in red. Agricultural runoff, tile drainage, and return flows from the irrigated farmland drains into the Columbia River, which forms the western border of the area before the Snake River joins it from the east. |
U.S. Geological Circular 1225--The Quality of Our Nation's Waters--Nutrients and Pesticides
An essential step toward understanding and managing the effects of pesticides on water quality is to examine the geographic distribution of pesticide levels in relation to land use and pesticide use and to determine areas of the Nation and environmental settings that merit the greatest concern and attention.The geographic distribution of pesticide levels is summarized in a series of maps that show results for herbicides and insecticides in streams and ground water for agricultural, urban, and mixed land uses, the latter including major rivers and aquifers. To identify potential water-quality problems, pesticide concentrations in water and bed sediment from streams are compared to aquatic-life guidelines because most streams sampled are not directly used as drinking-water sources. Pesticide concentrations in shallow ground water and water from major aquifers are compared to drinking-water standards and guidelines for human health. Most of the major aquifers, and shallow ground water in about one-half of the study areas, are sources of drinking water. Methods used to construct the maps are explained on page 31.
The national maps show national and regional patterns, or in some cases the apparent lack of pattern, in pesticide levels. They cannot, however, show important aspects of local variability in pesticide levels--for this, the reader is referred to the individual reports available for each NAWQA Study Unit (see page 80).
 |
 |
 |
|
A.C. Haralson, Arkansas Department of Parks and Tourism |
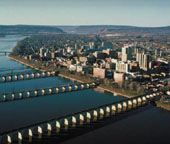
Alan R. Wycheck, Harrisburg Hershey Carlisle Tourism and Convention Bureau |
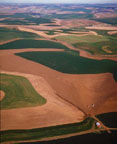
Photo by Phil Schofield
|