![]()
| Methods used for collecting and analyzing nutrient and pesticide data |
U.S. Geological Circular 1225--The
Quality of Our Nation's Waters--Nutrients and Pesticides
Focusing the NAWQA study design on land use
The NAWQA study design focuses on streams and shallow ground water in specific land-use settings to evaluate individual types of nonpoint sources of nutrients and pesticides, and on major rivers and aquifers to evaluate the effects of these sources at larger scales.(5) Major rivers and aquifers usually integrate water-quality effects from complex combinations of land uses and environmental settings within large contributing areas.
Targeted land uses include agricultural, urban, and, to a lesser degree, undeveloped forest or rangeland settings. Most of the agricultural streams studied had watersheds with more than 70 percent cropland and pasture, and all wells sampled in studies of shallow ground water in agricultural areas were within targeted cropland or pasture areas. Studies of streams and shallow ground water in urban areas focused primarily on residential land with low to medium population densities (300 to 5,600 people per square mile).(2) Many of the larger river sites in mixed land-use settings, however, were downstream from major metropolitan areas with important point sources, such as discharges from municipal and industrial wastewater treatment plants.
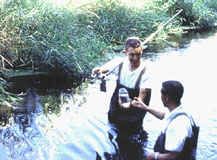
Collecting samples from streams
Water samples were collected from a total of 212 stream sites for nutrient analysis and a subset of 65 of these sites for pesticide analysis.(18) Samples of bed sediment were collected at 521 sites for analysis of organochlorine insecticides.(19) Fish were sampled for analysis of the same group of compounds at about half of the sites where bed sediment was sampled (see table below).(20)
Water samples were collected from streams throughout the year, including high-flow and low-flow conditions. Samples were collected for nutrient analysis approximately once each month, and more frequently during high-flow periods. At sites where pesticide samples were collected, sampling was more intensive for both nutrients and pesticides--generally weekly or twice monthly for a 4- to 9-month period during the time of highest chemical use and runoff. For most sites sampled for bed sediment or fish, a single sample was collected during low-flow conditions.
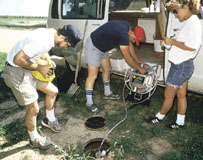
Collecting samples from ground water
Samples of shallow ground water were collected for analysis of nutrients and pesticides as part of ground-water studies, each of which commonly consisted of 20 to 30 randomly selected wells within the targeted land use.(21, 22) Most wells were completed just below the water table, and most were less than 100 feet deep. Ground water in these shallow zones is more susceptible to degradation from human sources and activities than deeper ground water.
For major aquifers, samples were collected primarily from existing private domestic wells. Similar to studies of shallow ground water, 20 to 30 wells were randomly selected in most aquifers, but without regard to land use. Most wells were sampled one time, and data analyses are based on one sample per well.
Mapping national distributions of water quality
Nutrient and pesticide levels are summarized on U.S. maps to facilitate analysis and comparison of regional and national patterns. Concentrations or detection frequencies are ranked according to three categories: lowest for the lowest 25 percent, medium for the middle 50 percent, and highest for the highest 25 percent of concentrations or detection frequencies among all stream sites or ground-water studies.
For nutrients in streams, flow-weighted total nitrogen and total phosphorus concentrations were determined for each stream site for 1994 and 1995 and were averaged.(23) For shallow ground water, median nitrate concentration was determined for each ground-water study.
For pesticides in water at each stream site, concentrations were summed separately for all detected herbicides and for all detected insecticides in each water sample. Then, annual results (75th percentile of monthly median concentrations) for total herbicides and total insecticides were determined for each site as the basis for ranking. For organochlorine insecticides, the distribution in bed sediment was mapped instead of the distribution in fish because data are available for a larger number of bed sediment sites. Concentrations of all organochlorine insecticides were summed for each site as the basis for ranking. For pesticides in ground water, each ground-water study area was ranked on the basis of the frequency of detection of one or more herbicides, or one or more insecticides, in the wells sampled.
The maps of national results for nutrients and pesticides also show patterns of nonpoint inputs of nitrogen, phosphorus, and pesticides. Based on county agriculture statistics for 1987 and 1992, average annual nitrogen and phosphorus inputs to agricultural and urban land were estimated from commercial fertilizer sales (1991-94) and manure from animals (1992). Average annual input of nitrogen from the atmosphere was estimated from 1991-94 data.(24) Use estimates for currently used herbicides and insecticides were made for every county in the Nation on the basis of crops harvested in 1992 and typical pesticide use rates in the early 1990s (http://water.usgs.gov/lookup/get?nawqapest/use92/mapex.html). The estimated use was then mapped for agricultural land throughout the Nation. The same general method was used for organochlorine insecticides, except that crop data from 1978 and use rates from 1966 were used.
Assessing potential effects of contaminants on human health and the environment
In this report, potential effects of nutrients and pesticides have been assessed by comparing concentrations to available standards and guidelines for protection of human health, aquatic life, or wildlife.(25) "Standards" are legally enforceable, whereas "guidelines" are primarily advisory. Standards and guidelines provide useful and widely used benchmarks that serve as starting points for evaluating potential effects of contaminants in the environment.
Stream sites are flagged if one or more water-quality guidelines for protection of aquatic life were exceeded in one or more samples. Ground-water study areas are flagged if one or more human-health standards or guidelines were exceeded in one or more wells. More details about how specific nutrient and pesticide concentrations are compared to standards and guidelines are described in the nutrients and pesticides sections.
Summary of stream sampling sites and ground-water studies
|
Nutrients
|
Pesticides | ||
| Relatively Undeveloped Forest or Rangeland |
|||
|
Streams
|
28
|
-- | |
|
Bed sediment
|
--
|
83
|
|
|
Shallow ground-water studies
|
4
|
some wells
|
|
| Agricultural Land | |||
|
Streams
|
75
|
40
|
|
|
Bed sediment
|
--
|
173
|
|
|
Shallow ground-water studies
|
36
|
36
|
|
| Urban Land | |||
|
Streams
|
22
|
11
|
|
|
Bed sediment
|
--
|
71
|
|
|
Shallow ground-water studies
|
13
|
13
|
|
| Mixed Land Use | |||
|
Streams and rivers
|
87
|
14
|
|
|
Bed sediment
|
--
|
194
|
|
|
Major aquifers
|
33
|
33
|
|
| Nutrients | |
| Sources of nutrients and pesticides | |
| The Quality of Our Nation's Waters--Nutrients and Pesticides contents |