Figure 19. Illustrated are the lensate form of the reservoir, and of individual reservoir sandstones, in this vertical east-west slice showing 3-D distribution of porosity across sand ridge 1 and overlying sand ridge 2. Yellow dots are locations of well-log porosity measurements. Blue and purple areas are primarily non-reservoir intervals. These are basal and landward low-depositional-energy sandstones and mudstones of individual sand ridges (porosity ranges up to 8 percent). Green areas are reservoir-grade porosity of 8 to 12 percent. The breakover point between green and yellow is average porosity of reservoir intervals of about 12 percent; yellow through red (20 percent porosity) are the best-quality reservoir intervals. These are largely the medium-grained trough-cross-bedded sandstones, although even here there is considerable interbedding of low- through high-depositional-energy facies. Width of the reservoir at this slice is about 2 mi (4 km). Vertical exaggeration is 60x. This is 3dewlens.gif, slice 10 of the 3-D distribution of porosity model, as shown in the ewporosv.MOV movie.

Figure 20. East-west oriented vertical slices of porosity (left, percent) and permeability (right, mD). This image (porpermv.gif) shows the highly variable porosity (left) and permeability (right) using core data. Porosity values/colors are reservoir grade (green through red) of 8 through 21 percent, and below-reservoir-grade low-porosity (blue) of less than 8 percent. Permeability ranges are: purple and blue, up to 5 mD; green, 5 to 16 mD; and yellow through red are greater than 16 mD. Average permeability of Sussex "B" reservoir sandstones is 15 mD. The close-spaced 3-D grid essentially treats each well as a separate set of points for the purpose of showing the variation in porosity and permeability. The various diamond shapes and streaks of low through high porosity and permeability illustrate the interbedding of thin beds of reservoir- and non-reservoir-grade sandstone and mudstone. These diagrams include the eastward and upward increases in porosity and permeability, and stacking of sand ridges shown in previous images. This slice is located in the northwestern half of the field. Yellow dots are (left) core and well-log and (right) core sample locations. Slices are 1.8 mi (2.8 km) wide and 50 ft (15 m) high. Vertical exaggeration is 30x. Respective names of the east-west porosity and permeability slide-image files are 3dew_img.htm and 3dvk_img.htm .
A. 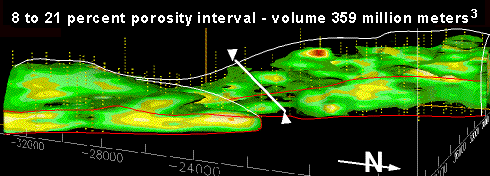
B. 
Figure 21. A. This (por8vol.gif) 3-D view of 8 to 21 percent porosity exhibits a total volume of 358.6 million cubic meters. This is about 70 percent of the total volume of 525.5 million cubic meters of the Sussex "B" sandstone within the field boundaries. The 64 KB full-size image is named eside10f.gif . B. This (por12vol.gif) 3-D image of 12 to 21 percent porosity has a total volume of 115.9 million cubic meters, which comprises less than 25 percent of the total volume of the "B" sandstone in the field. In comparison, the 13 to 21 percent porosity range is about 62.2 million cubic meters; this is about 12 percent of the field volume. The 64 KB full-size image is named eside10j.gif . Green on the figures is 8 to 12 percent porosity. Yellow through red are 12 to 21 percent porosity. Blue arrow marks the boundary between sand ridge 1 and 2. The thin white line marks the upper disconformity surface of the "B" sandstone, except for the seaward margin of the House Creek field, which is outlined in red. The white arrows and line separate the northwestern and southeastern ridge systems; the gap in reservoir-grade porosity units is apparent. X and Y scales are shown in meters around the base of the block. Maximum thickness of the "B" sandstone is about 60 ft (18 m). North arrow is included. Vertical exaggeration is 80x.
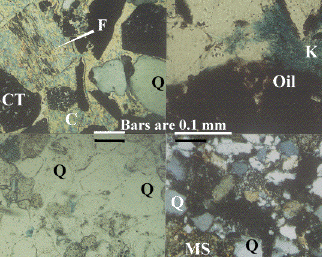
Figure 22. Thin-section photomicrographs of four samples of the Sussex "B" sandstone. Q is quartz, CT shows the chert grains, K is kaolinite, C is calcite, F shows feldspar grain (gray in the crossed-nicols view), MS are mudstone pore-fill and clasts, Oil coats grains and fills pores. Blue epoxy fills pore spaces. cmts4.gif is the full large-scale 2.4 MB image. Clockwise from upper left, images show;
- Absence of porosity and permeability resulting from precipitation of ferroan calcite (C), linked with dissolution of a feldspar (F) grain and peripheral dissolution of quartz (Q) and chert (CT) grains (cross-nicols light).
- Microporosity in an oil-stained, medium-grained sandstone resulted from late-diagenetic precipitation of kaolinite (K) in pore spaces (transmitted light).
- Low-depositional-energy facies have high levels of compaction with associated low levels of minus-cement porosity. Quartz grains frequently show peripheral dissolution and only minor overgrowths (crossed-nicols light).
- Pervasive cementation by quartz is most common in thin-bedded, "clean," well-sorted sands with minimal evidence of prior cementation by calcite. Chlorite (green) rims some quartz grains. Because of the early cementation by quartz, mudstone clasts frequently exhibit only minor compaction. Porosity (blue) is minor (transmitted light).
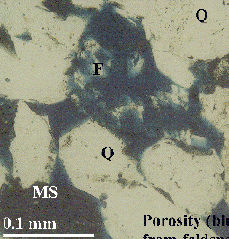
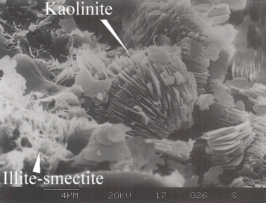
Figure 23. A. Thin-section photomicrograph from 8,012 ft (2,442 m) depth, No. 1 Empire Federal "C" well (fdissols.gif). Dissolution of the large feldspar (F) grain, located near the center of the image, results in secondary porosity. The crystal structure and outline of the feldspar grain is still apparent. Primary (depositional) porosity borders this and other grains. Quartz grains are labeled Q. Microporosity results primarily from breakdown of feldspar into kaolinite (K on large-scale view) and other clay minerals; this causes a mottled appearance of the blue epoxy that fills pore spaces. MS is a mudstone clast. Scale bar is 0.1 mm. The full-scale 1.5 MB thin-section photomicrograph of feldspar dissolution is fdissol.gif. B. Scanning electron microscope (SEM) image of kaolinite shows partings between booklets and minor amounts of "wispy" illite-smectite clay from the No. 1-23 House Creek Federal well (semkaosm.gif). Scale bar, below the illite-smectite label, is 4 micrometers. The 656 KB SEM full-scale image of kaolinite booklets is semkao.gif.
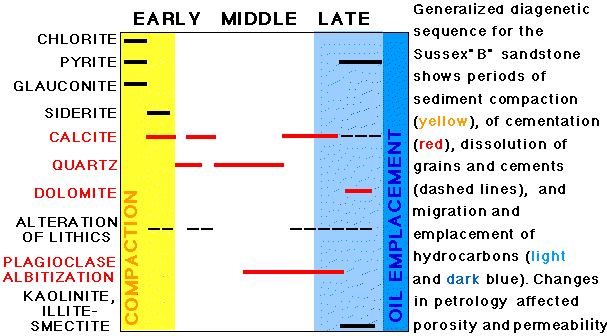
Figure 24. Generalized paragenetic sequence of the Sussex "B" sandstone (diagenes.gif). Dashed lines indicate times of dissolution of cements or grains. Yellow zone is period of sediment compaction. Medium blue zone is period of migration of hydrocarbons from shale source rocks. Dark blue zone is time of oil emplacement into the House Creek and Porcupine fields.
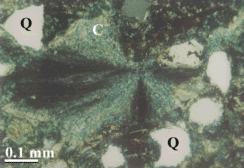
Figure 25. A. Transmitted-light view of very early diagenetic radial-fibrous calcite (C) that displaced quartz (Q) grains and glauconite. Calcite precipitated within the glauconite pellet and blasted it apart. Grains float in the matrix of calcite cement and mudstone (MS). Rfca1.gif is the full 752 KB transmitted-light image. B. The star-pattern of the calcite is apparent on this plane-polarized view. Rfca.gif is the full 736 KB plane-polarized image. Blue color results from staining the thin section for ferroan calcite.
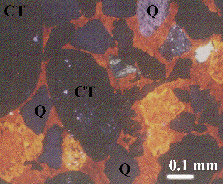
Figure 26. Cathodoluminescent photomicrograph of ferroan calcite cement (orange and bright orange) within a chert-pebble lag. Calcite is optically continuous across this view. Grains of chert (CT), quartz (Q), and feldspar (striped grain) float in a matrix of calcite cement. The feldspar grain is partially replaced by this very early diagenetic calcite. Bimodal grain distribution and point contacts between grains are also shown. clumcmt.gif is the full-scale 736 KB image. Quartz overgrowths are black (visible on the full-scale image). Scale bar is 0.1 mm.
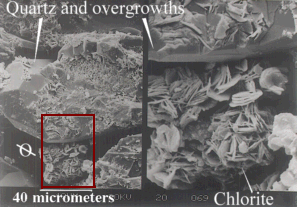
Figure 27. Scanning electron microscope (SEM) images of early-diagenetic chlorite rims (bladed crystals) that coat quartz grains and are intergrown with quartz overgrowths, No. 14-9 Federal well. Brown box shows location of the zoomed-in image. A pore space is labeled (ellipse with a line through it). Semchl.gif is the full-scale 768 KB image.
