|
|
|
Survey Products
The images here are representations of the survey tracklines (figs. 3 and 5), DEM map product (fig. 6), DEM grid error (fig. 7), and the inerferometric backscatter map (fig. 8). The data files are available for download from the Data Downloads page.
| TRACKLINES
| |
BATHYMETRY |
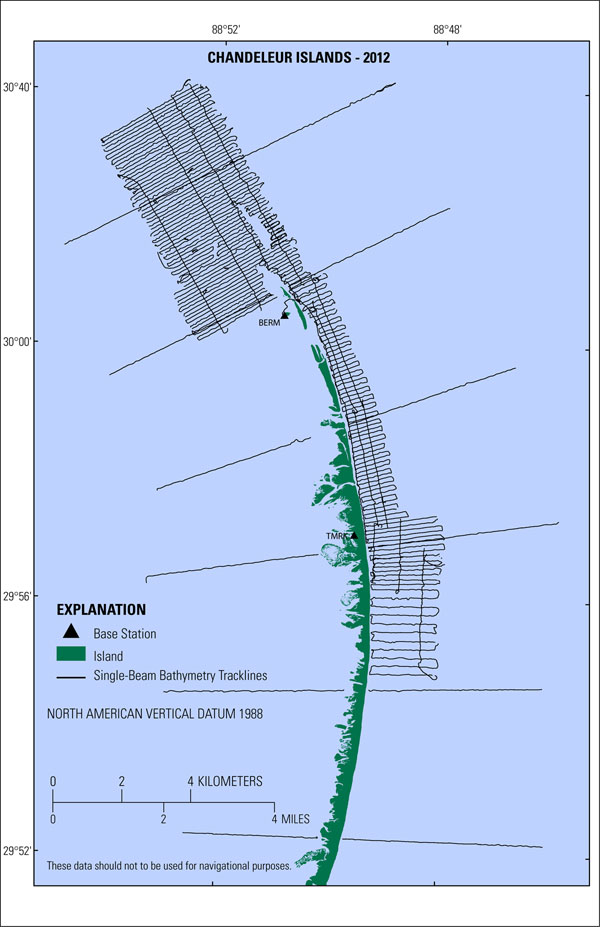
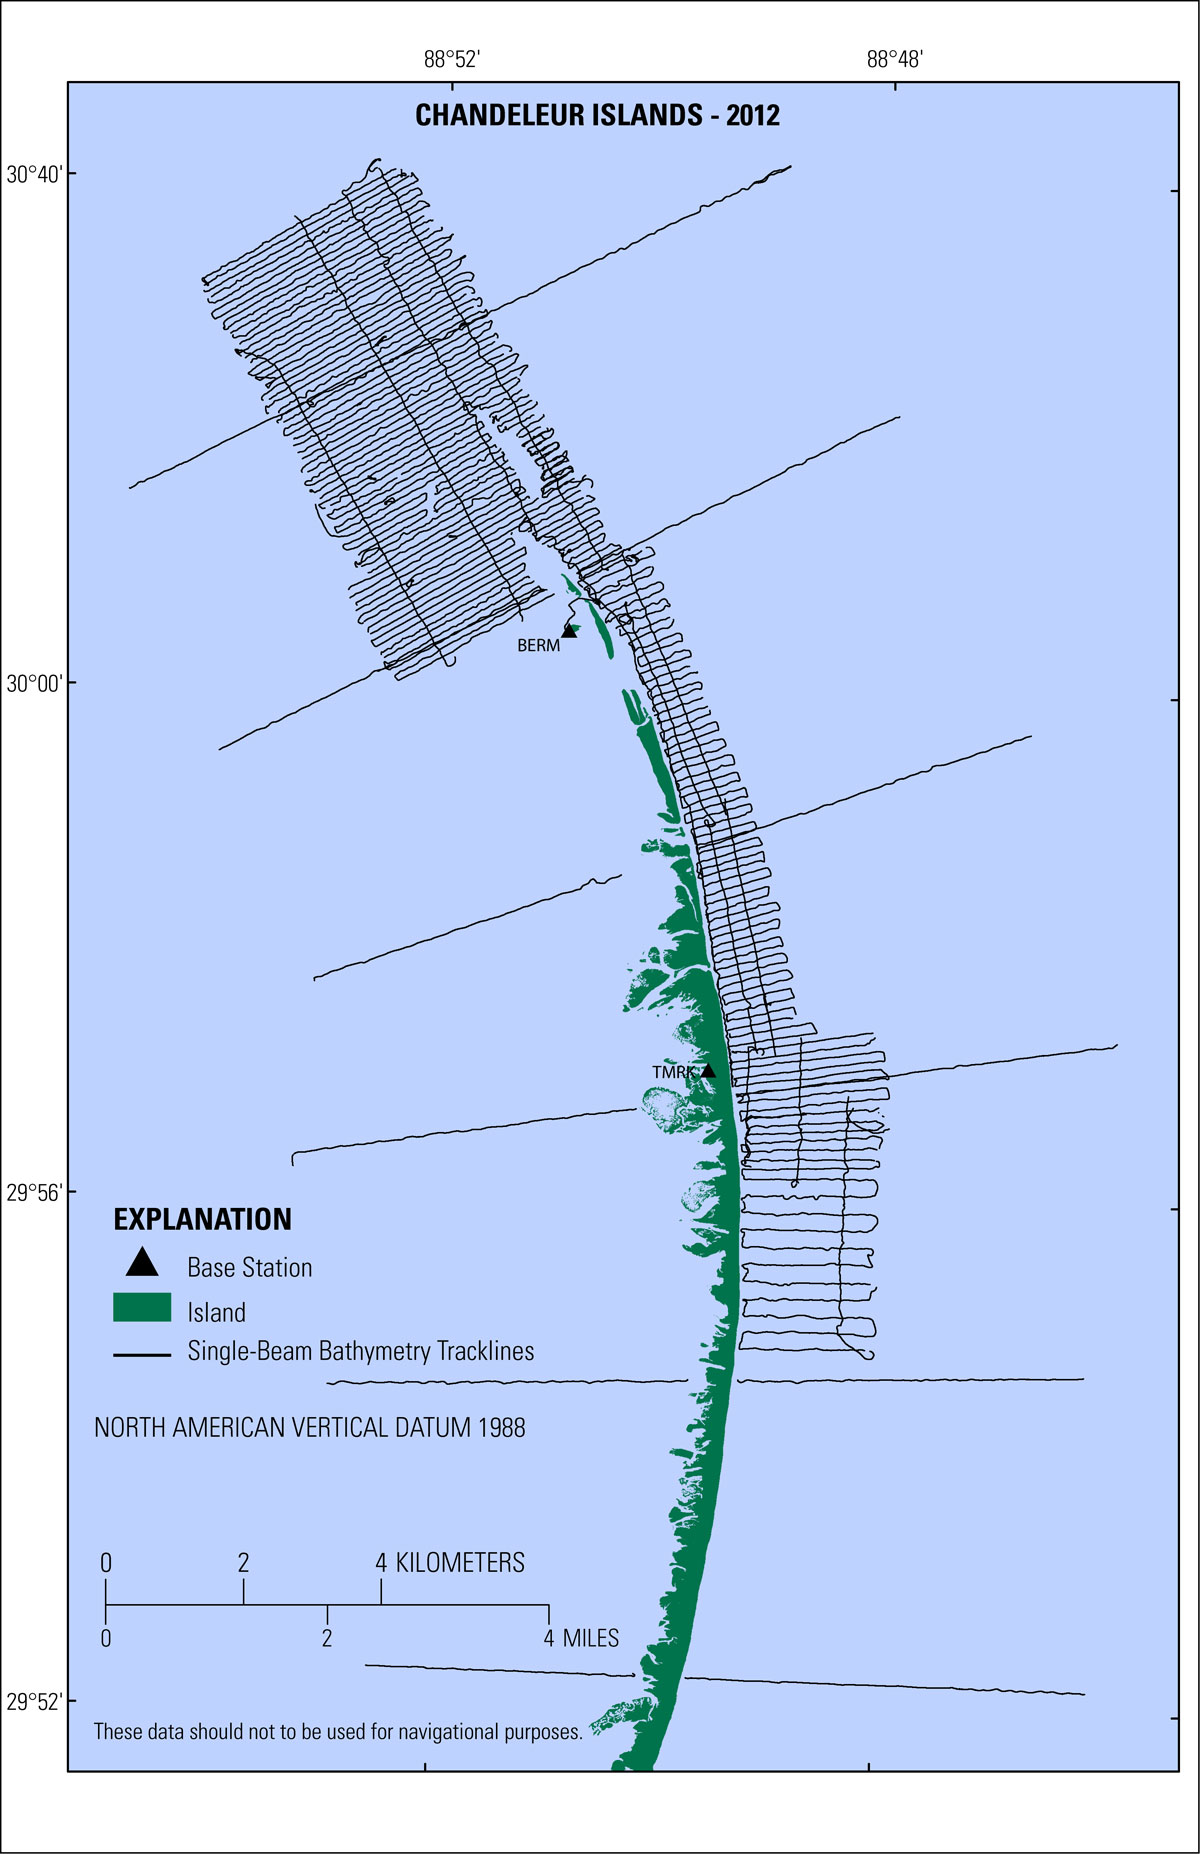
Figure 3. Single-beam bathymetry tracklines for Chandeleur Islands survey in 2012. [Click to enlarge.]
|
|

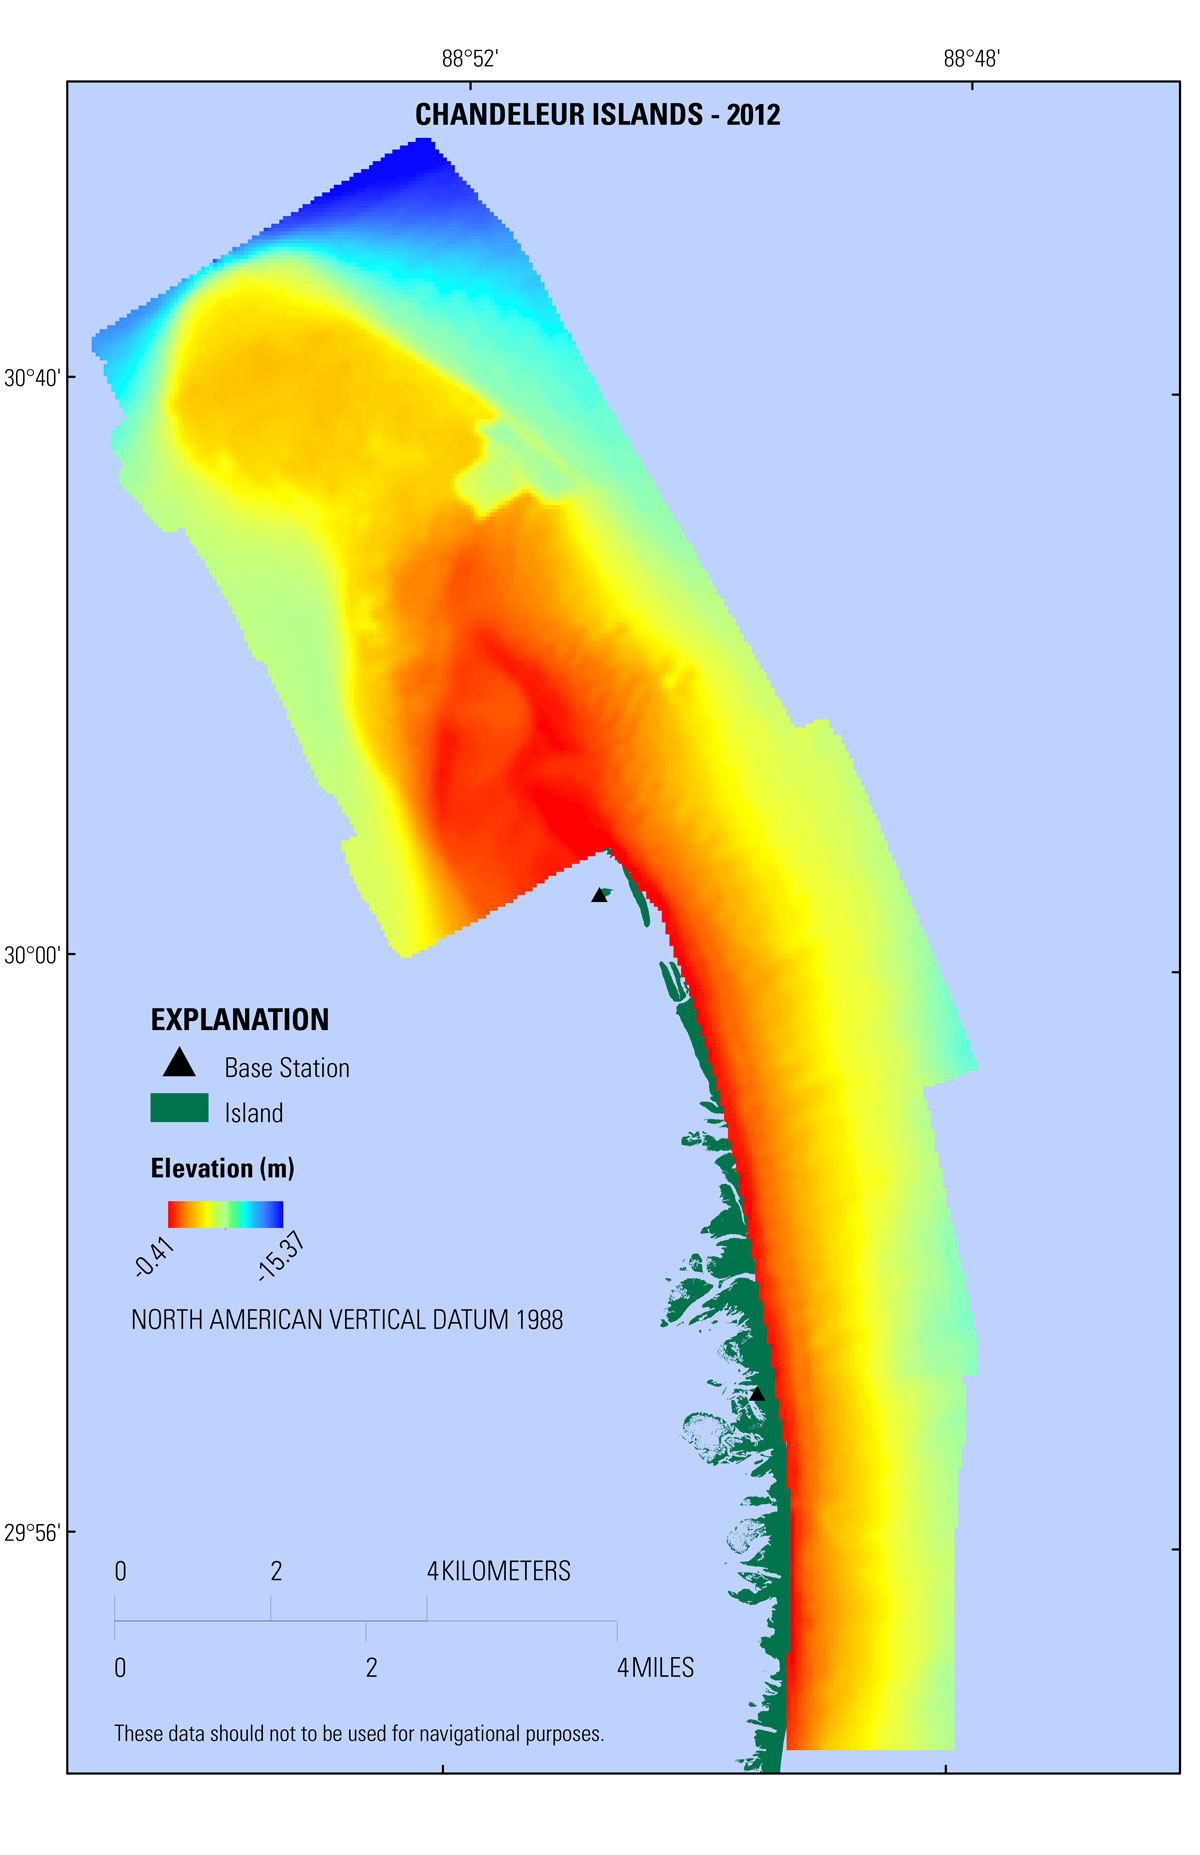
Figure 6. A 50-meter digital elevation model of 2012 bathymetry surrounding the Chandeleur Islands, Louisiana. [Click to enlarge.]
|
| |
|
|
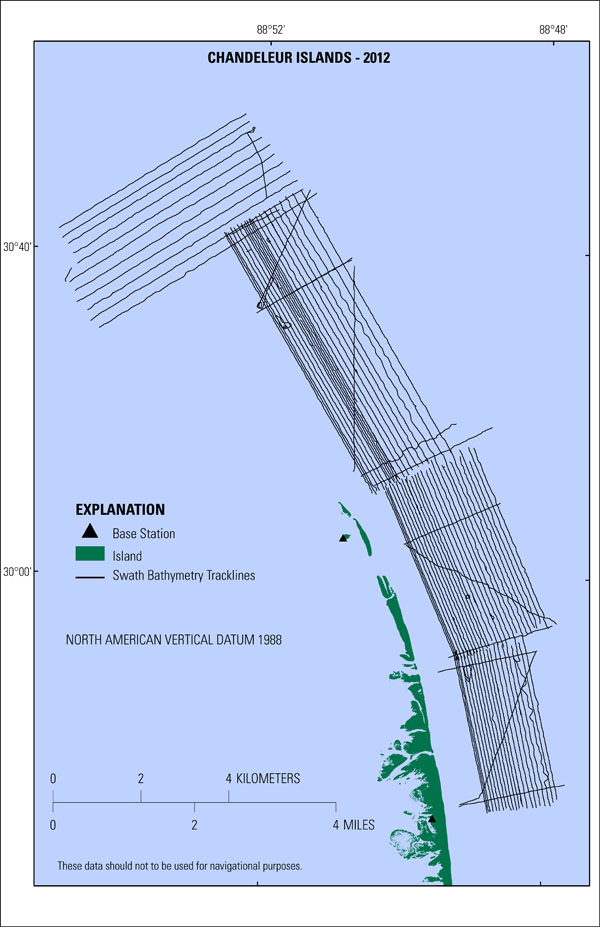
Figure 5. Swath bathymetry tracklines for Chandeleur Islands survey in 2012. [Click to enlarge.]
|
|

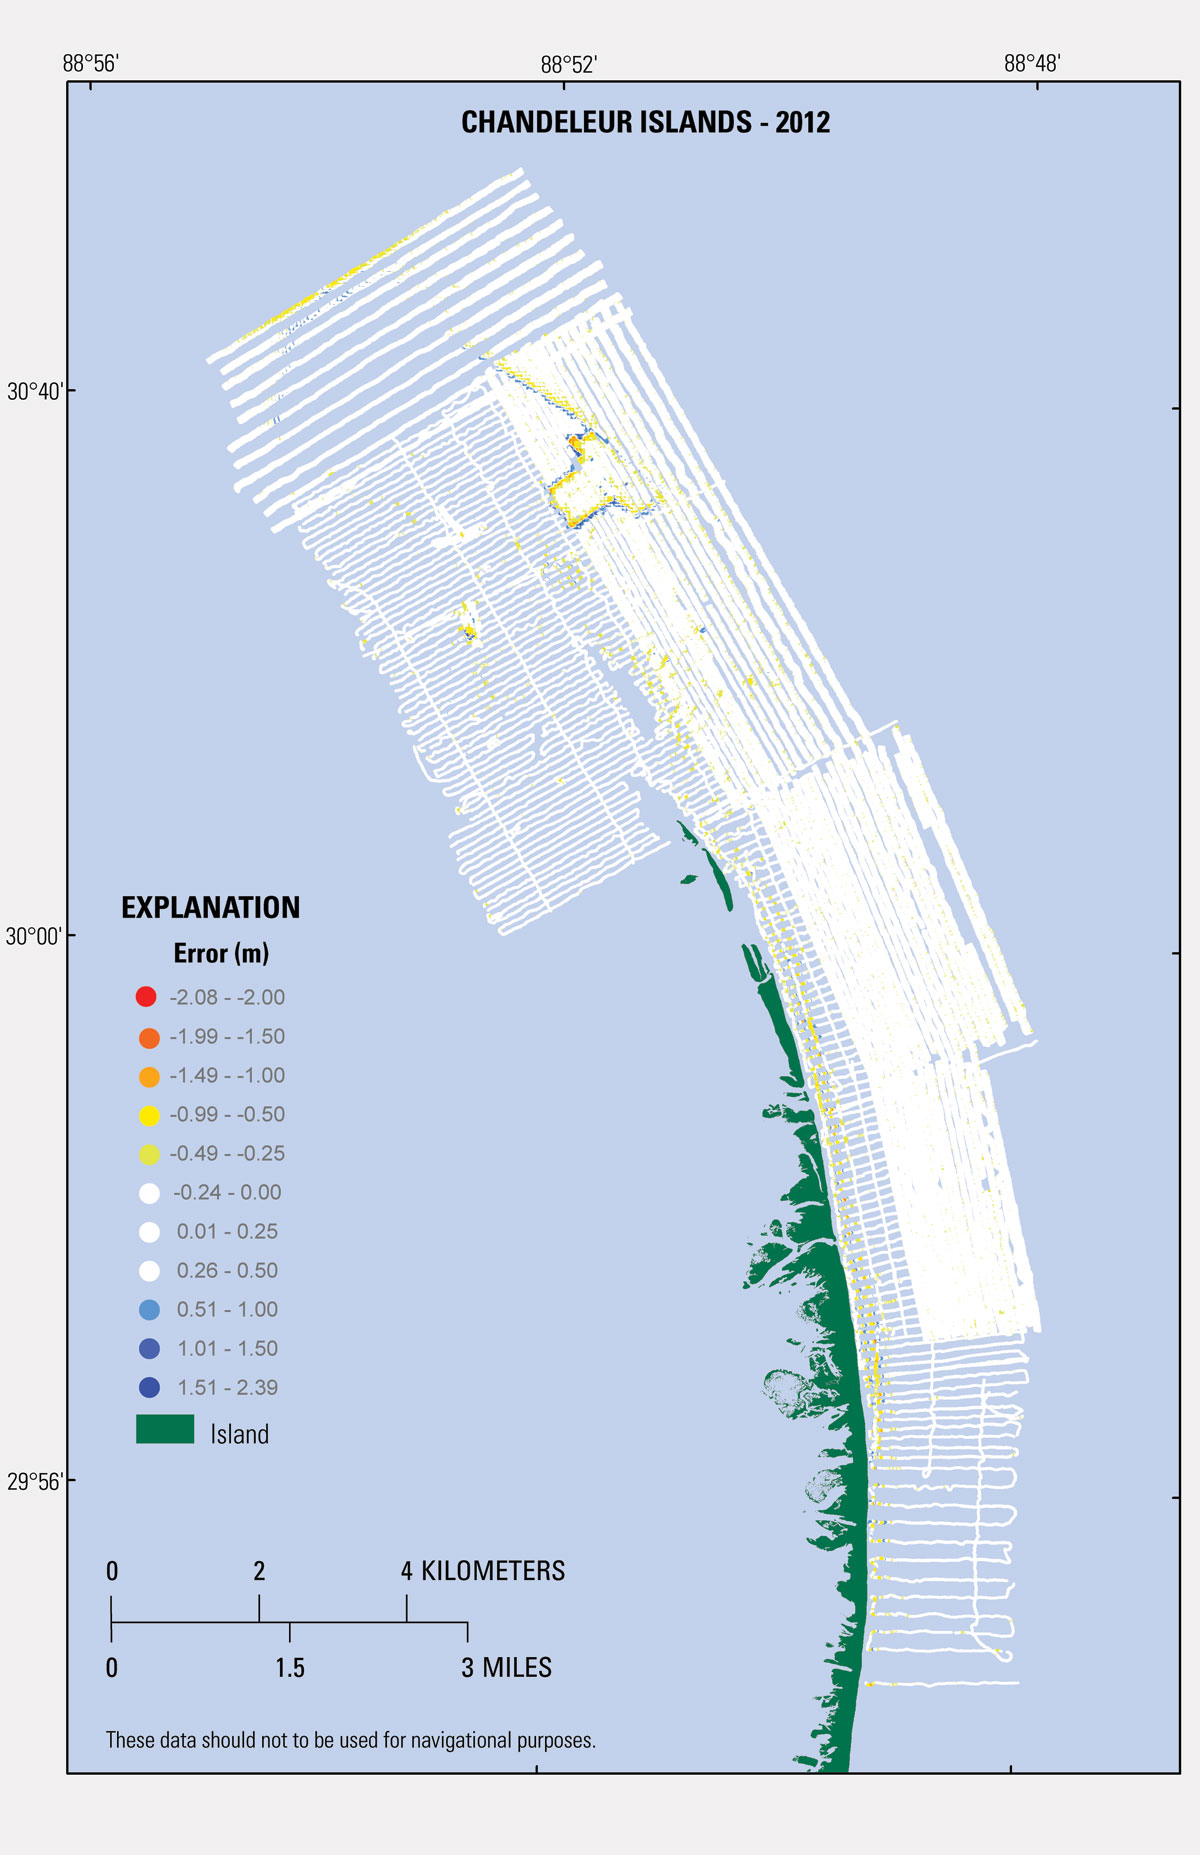
Figure 7. Error values representing the difference between the bathymetry digital elevation model (DEM) at each sample point. White symbols represent acceptable system error of <0.000501 meters. Island area extent is derived from USGS lidar data collected in February 2012. [Click to enlarge.]
|
|
|

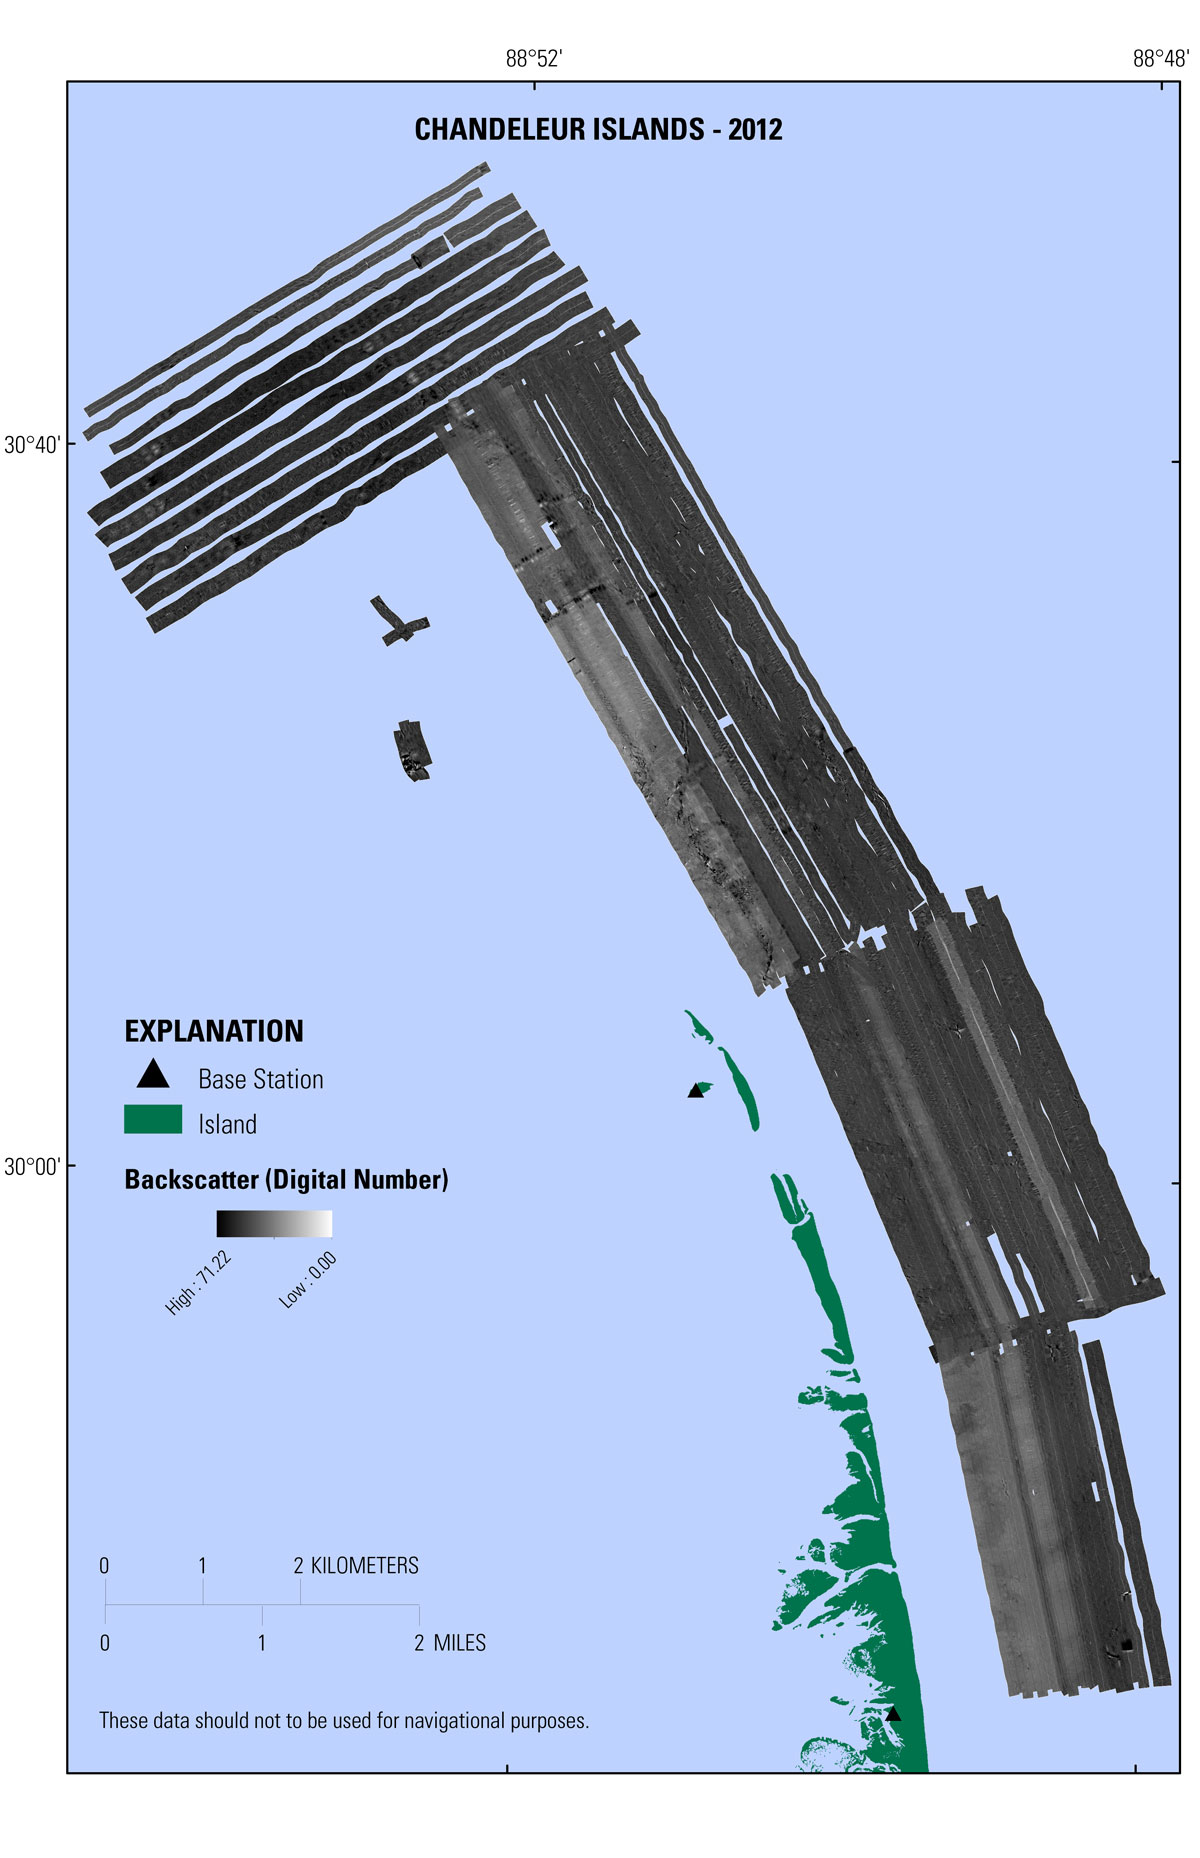
Figure 8. A 1-meter interferometric backscatter for the Chandeleur Islands survey in 2012. [Click to enlarge.]
|
|