 |
| DS 128: Missouri Complete
Bouguer Gravity Anomaly Map |
Northeast Illumination
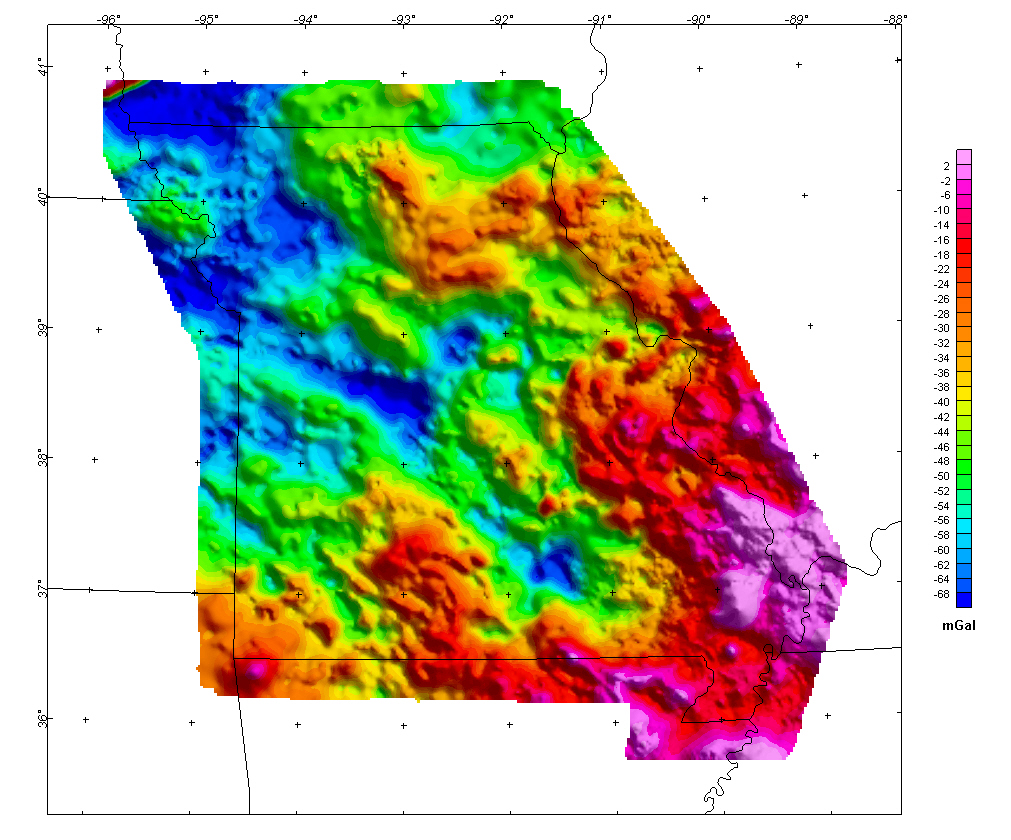
The colors on this Bouguer
gravity anomaly (Hill and others, 1995) map
represent gravity variations resulting from lateral density variations in
the Earth. Positive anomalies (red colors) occur in areas with average density
greater than the Bouguer reduction density of 2.67 gm/cc, whereas negative
anomalies (blue colors) occur in areas of lower density.
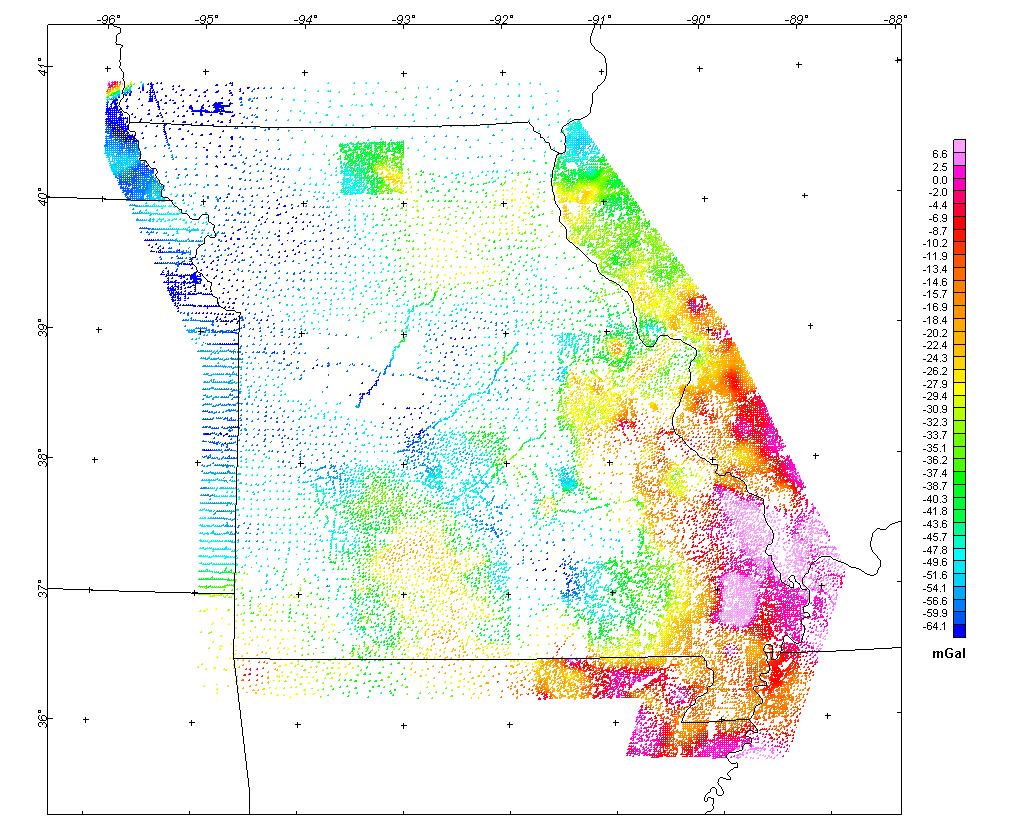
The complete-Bouguer gravity anomaly grid was generated from
48,605 gravity station measurements in and adjacent to the State of Missouri.
The source of the station information is the gravity data repository of the University
of Texas-El Paso (UTEP) / PACES research center. Observed gravity measurements
relative to the International Gravity Standardization Net 1971 (IGSN71) datum
were reduced to the Bouguer anomaly using the 1967 gravity formula (Cordell
and others, 1982) and a reduction density of 2.67 gm/cc. Terrain corrections
were calculated radially outward from each station to a distance of 167 km
using a method developed by Plouff (1977). The data
were converted to a 2-km grid using minimum curvature techniques. This compilation
does not include any unpublished data.
The grid for the Bouguer color-contour map is available from
the data directory as grvcba.grd
Top || Missouri
home || Crustal Team
