 |
| DS 128: Missouri Isostatic
Gravity Anomaly Map |
Northeast Illumination
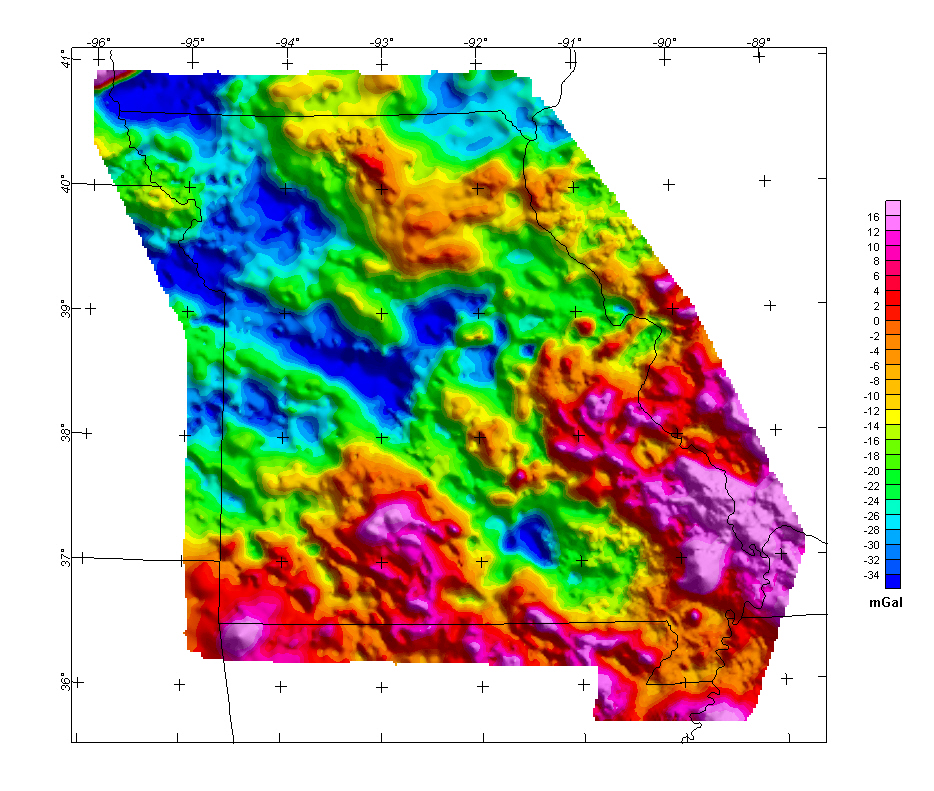
The colors on this isostatic
residual gravity (Hill and others, 1995) map
reflect variations in the Earth's gravity field caused by density variations
in the rocks composing the upper part of the Earth's crust. An isostatic
residual gravity grid was derived from the Bouguer gravity anomaly data by
removing the gravitational effect of the compensating mass that supports
topographic loads. The thickness of this compensating mass was calculated
using averaged digital topography by assuming a crustal thickness for sea-level
topography of 30 km, a crustal density of 2.67 gm/cc, and a density contrast
between the crust and upper mantle of 0.40 gm/cc. The anomalies and patterns
on the map reveal features of subsurface geology, including the location
of buried faults, sedimentary basins, plutons, uplifted basement rocks, and
so forth. Positive anomalies (red colors) delineate rocks more dense than
the Bouguer reduction density of 2.67 gm/cc, whereas negative anomalies (blue
colors) result from rocks of lower density.
The grid for this map is available from the data directory
as grviso.grd
Top || Missouri
home || Crustal Team
