
|
|
|
||||
| Data Series 156 U.S. Department of the Interior |
Table 1. Summary of averaged dissolved-gas compositions (nitrogen, a...
| Multiply | By | To obtain |
|---|---|---|
| foot (ft) | 0.3048 | meter (m) |
| cubic centimeter (cm3) | 0.06102 | cubic inch (in3) |
| liter (L) | 0.2642 | gallon (gal) |
Vertical coordinate information is referenced to the National Geodetic Vertical Datum of 1929 (NGVD 29). Recharge elevation, as used in this report, refers to distance above the vertical datum.
Concentrations of gases are given in milligrams per liter (mg/L).
Dissolved-gas samples were collected from 170 wells and 1 spring in West Virginia during 1997-2005. Gas concentrations in milligrams per liter ranged from 3.66 to 53.98 for nitrogen, 0.150 to 1.234 for argon, 0.00 to 9.11 for oxygen, 0.2 to 198.8 for carbon dioxide, and 0.00 to 68.50 for methane.
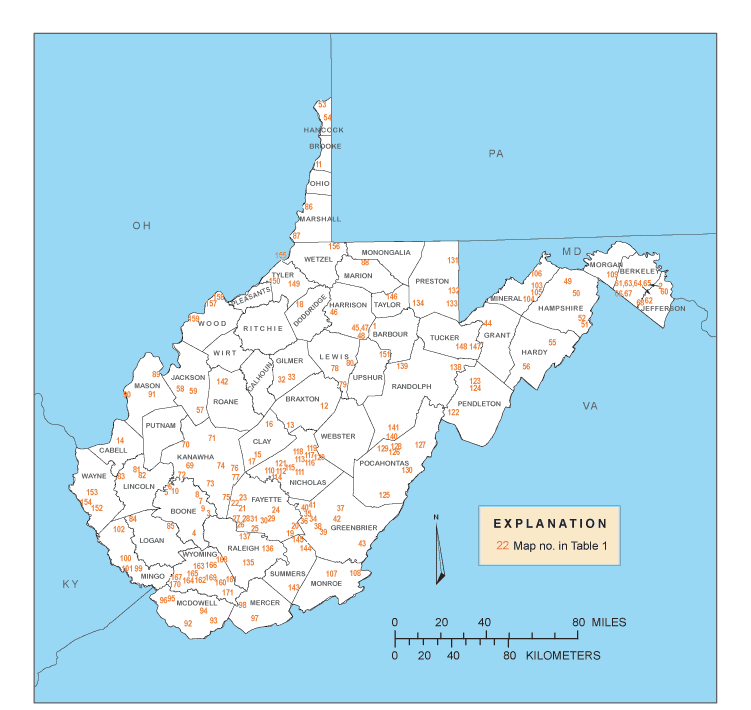
This report presents previously unpublished dissolved-gas data for nitrogen (N2), argon (Ar), oxygen (O2), carbon dioxide (CO2), and methane (CH4) from ground water collected in water wells and one spring in West Virginia during 1997-2005. Sample sites (fig. 1) included both public-supply and privately owned wells. Samples were taken from untreated water and were collected as part of several hydrologic studies including the Allegheny-Monongahela National Water Quality Assessment (NAWQA) (Anderson and others, 2000), the Kanawha-New River NAWQA (Paybins and others, 2000), the West Virginia Ambient Ground-Water-Quality-Monitoring Network (Kozar and Brown, 1995), a current ground-water investigation in Leetown, W. Va., and an additional 30 samples collected during this investigation to supplement deficiencies in sampling coverage. Additional water-quality parameters were collected at most sites, and sample data for 1997-2004 are published in eight Water Resources Data reports for West Virginia (Ward and others, 1998-2005). These reports contain data for major ions, nutrients, trace metals, pesticides, indicator bacteria, and VOCs (volatile organic compounds). Water-quality data collected in 2005 were not published at the time of this report.
Wells were sampled by connecting a flowthrough chamber and sampling lines to the raw-water tap closest to the wellhead so that field measurements and water samples could be obtained without exposing the ground water to the atmosphere. Prior to sample collection, wells were purged for several minutes until field measurements stabilized (Koterba and others, 1995). Dissolved-gas samples were collected by placing a water line into the bottom of a 160-cm 3 septum bottle and filling the bottle to overflowing. The septum bottle while still overflowing was then submerged into a 2-L plastic beaker that had been previously filled with ground water from the sampling site. Then the sample line was removed, and all air bubbles adhering to the sides of the bottle were allowed to escape. A rubber stopper through which a syringe needle had been inserted was then pushed tightly into the bottle, and the needle was withdrawn while the bottle was still submerged in the beaker (U.S. Geological Survey, 2005b). Multiple bottles were filled to safeguard against bottle breakage or contamination. Filled bottles were shipped inverted and chilled to the U.S. Geological Survey Chlorofluorocarbon Laboratory (Reston, Va.). Water temperature and estimated elevation of recharge to the well were submitted with the samples to aid the laboratory analysis. All samples received in good condition were analyzed using dual gas chromatography (U.S. Geological Survey, 2005a). Average values for dissolved-gas concentrations are reported for each ground-water sampling site (table 1). N 2 concentrations ranged from 3.66 to 53.98 mg/L, Ar from 0.150 to 1.234 mg/L, O 2 from 0.00 to 9.11 mg/L, CO 2 from 0.2 to 198.8 mg/L, and CH 4 from 0.00 to 68.50 mg/L.
The data presented in this report were collected during 1997-2005 as part of the Allegheny-Monongahela NAWQA, the Kanawha-New River NAWQA, the West Virginia Ambient Ground-Water-Quality-Monitoring Network, ground-water studies in Leetown, W. Va., and during this investigation. N 2 concentrations ranged from 3.66 to 53.98 mg/L, Ar from 0.150 to 1.234 mg/L, O 2 from 0.00 to 9.11 mg/L, CO 2 from 0.2 to 198.8 mg/L, and CH 4 from 0.00 to 68.50 mg/L.
Anderson, R.M., Beer, K.M., Buckwalter, T.F., Clark, M.E., McAuley, S.D., Sams, J.I., III, and Williams, D.R., 2000, Water quality in the Allegheny and Monongahela River Basins, Pennsylvania, West Virginia, New York, and Maryland, 1996-98: U.S. Geological Survey Circular 1202, 32 p.
Koterba, M.T., Wilde, F.D., and Lapham, W.W., 1995, Ground-water data-collection protocols and procedures for the National Water-Quality Assessment Program—Collection and documentation of water-quality samples and related data: U.S. Geological Survey Open-File Report 95-399, 113 p.
Kozar, M.D., and Brown, D.P., 1995, Location and site characteristics of the ambient ground-water-quality-monitoring network in West Virginia: U.S. Geological Survey Open-File Report 95-130, 48 p.
Paybins, K.S., Messinger, Terence, Eychaner, J.H., Chambers, D.B., and Kozar, M.D., 2000, Water quality in the Kanawha-New River Basin, West Virginia, Virginia, and North Carolina, 1996-98: U.S. Geological Survey Circular 1204, 32 p.
U.S. Geological Survey, 2005a, Analytical procedures for dissolved gas, accessed November 17, 2005, at http://water.usgs.gov/lab/dissolved-gas/sampling/
U.S. Geological Survey, 2005b, Dissolved gas sampling instructions, accessed November 17, 2005, at http://water.usgs.gov/lab/dissolved-gas/sampling/
Ward, S.M., Rosier, M.T., and Crosby, G.R., 2003, Water resources data, West Virginia, water year 2002: U.S. Geological Survey Water-Data Report WV-02-1, p. 238-245.
Ward, S.M., Rosier, M.T., and Crosby, G.R., 2004, Water resources data, West Virginia, water year 2003: U.S. Geological Survey Water-Data Report WV-03-1, p. 260-273.
Ward, S.M., Rosier, M.T., and Crosby, G.R., 2005, Water resources data, West Virginia, water year 2004: U.S. Geological Survey Water-Data Report WV-04-1, p. 252-261.
Ward, S.M., Taylor, B.C., and Crosby, G.R., 1998, Water resources data, West Virginia, water year 1997: U.S. Geological Survey Water-Data Report WV-97-1, p. 342-351.
Ward, S.M., Taylor, B.C., and Crosby, G.R., 1999, Water resources data, West Virginia, water year 1998: U.S. Geological Survey Water-Data Report WV-98-1, p. 446-454.
Ward, S.M., Taylor, B.C., and Crosby, G.R., 2000, Water resources data, West Virginia, water year 1999: U.S. Geological Survey Water-Data Report WV-99-1, p. 239-250.
Ward, S.M., Taylor, B.C., and Crosby, G.R., 2001, Water resources data, West Virginia, water year 2000: U.S. Geological Survey Water-Data Report WV-00-1, p. 239-255.
Ward, S.M., Taylor, B.C., and Crosby, G.R., 2002, Water resources data, West Virginia, water year 2001: U.S. Geological Survey Water-Data Report WV-01-1, p. 240-249.
[Map no., general reference number for map; Rech. elev., recharge elevation is land surface; ft, feet; n dg , number of dissolved-gas samples averaged; N 2 , nitrogen; Ar, argon; O 2 , oxygen; CO 2 , carbon dioxide; CH 4 , methane; mg/L, milligrams per liter; *, spring site]
| Map no. | Station name | Date | Rech. elev. (ft) | n dg | N 2 (mg/L) | Ar (mg/L) | O 2 (mg/L) | CO 2 (mg/L) | CH 4 (mg/L) |
|---|---|---|---|---|---|---|---|---|---|
| 1 | Bar-0149 | 8/18/2005 | 1,500 | 4 | 17.57 | 0.632 | 0.01 | 13.6 | 1.5370 |
| 2 | Ber-0150 | 4/14/1999 | 520 | 1 | 22.51 | 0.736 | 0.93 | 53.5 | 0.0000 |
| 3 | Boo-0253 | 6/3/1997 | 2,150 | 1 | 13.00 | 0.505 | 0.02 | 16.9 | 14.2564 |
| 4 | Boo-0254 | 5/7/1997 | 2,200 | 2 | 17.24 | 0.628 | 0.10 | 4.2 | 22.7825 |
| 5 | Boo-0256 | 5/4/1998 | 1,160 | 2 | 20.19 | 0.691 | 0.25 | 78.1 | 0.2789 |
| 6 | Boo-0257 | 5/29/1998 | 1,180 | 2 | 7.95 | 0.291 | 0.00 | 113.2 | 12.1966 |
| 7 | Boo-0258 | 5/6/1998 | 1,640 | 2 | 18.29 | 0.666 | 0.97 | 37.7 | 0.0000 |
| 8 | Boo-0259 | 6/23/1998 | 1,560 | 2 | 24.68 | 0.887 | 0.00 | 5.8 | 8.2377 |
| 9 | Boo-0260 | 5/15/1998 | 1,760 | 2 | 20.79 | 0.756 | 0.00 | 14.8 | 7.7542 |
| 10 | Boo-0261 | 7/10/2003 | 980 | 3 | 6.51 | 0.249 | 0.00 | 9.1 | 37.1809 |
| 11 | Brk-0077 | 3/16/2005 | 1,240 | 3 | 20.60 | 0.695 | 0.03 | 53.2 | 0.0094 |
| 12 | Brx-0269 | 6/10/1997 | 1,400 | 1 | 21.55 | 0.738 | 0.15 | 23.1 | 0.0022 |
| 13 | Brx-0270 | 6/9/1997 | 1,564 | 1 | 17.73 | 0.643 | 3.61 | 17.7 | 0.0000 |
| 14 | Cab-0233 | 4/9/1999 | 900 | 1 | 21.56 | 0.722 | 0.00 | 6.4 | 0.6060 |
| 15 | Cla-0141 | 5/8/1997 | 1,400 | 1 | 16.27 | 0.625 | 0.07 | 23.5 | 6.7144 |
| 16 | Cla-0142 | 6/4/1997 | 1,220 | 1 | 10.43 | 0.371 | 0.05 | 4.5 | 5.1290 |
| 17 | Cla-0143 | 6/9/2003 | 1,280 | 4 | 25.60 | 0.774 | 0.10 | 34.1 | 1.9190 |
| 18 | Dod-0066 | 5/5/2004 | 1,080 | 4 | 21.67 | 0.673 | 0.03 | 2.4 | 0.1035 |
| 19 | Fay-0233 | 7/20/2000 | 3,040 | 3 | 19.98 | 0.685 | 0.00 | 0.2 | 5.8524 |
| 20 | Fay-0234 | 4/28/1999 | 2,880 | 1 | 49.10 | 1.234 | 5.46 | 2.6 | 0.0020 |
| 21 | Fay-0242 | 7/11/2002 | 1,920 | 4 | 21.34 | 0.694 | 0.07 | 44.0 | 0.3059 |
| 22 | Fay-0267 | 6/2/1997 | 2,345 | 1 | 20.09 | 0.689 | 0.00 | 26.2 | 0.0103 |
| 23 | Fay-0270 | 5/22/1998 | 2,000 | 2 | 21.52 | 0.703 | 0.09 | 50.6 | 0.0318 |
| 24 | Fay-0272 | 5/13/1998 | 2,480 | 2 | 19.37 | 0.686 | 0.07 | 77.6 | 0.0024 |
| 25 | Fay-0274 | 5/21/1998 | 2,000 | 2 | 16.45 | 0.614 | 7.19 | 64.2 | 0.0000 |
| 26 | Fay-0275 | 5/12/1998 | 2,440 | 2 | 17.50 | 0.653 | 3.94 | 16.8 | 0.0000 |
| 27 | Fay-0276 | 5/8/1998 | 2,400 | 2 | 18.10 | 0.640 | 0.58 | 70.4 | 0.0000 |
| 28 | Fay-0279 | 5/26/1998 | 2,240 | 2 | 24.07 | 0.767 | 0.38 | 42.4 | 0.4088 |
| 29 | Fay-0281 | 8/1/2000 | 1,840 | 2 | 14.74 | 0.510 | 0.03 | 0.3 | 35.4037 |
| 30 | Fay-0282 | 8/4/2000 | 1,840 | 2 | 18.73 | 0.644 | 0.00 | 17.1 | 2.7393 |
| 31 | Fay-0285 | 8/10/2000 | 2,000 | 2 | 23.89 | 0.782 | 0.00 | 35.4 | 1.1943 |
| 32 | Gil-0045 | 7/6/2000 | 1,160 | 3 | 19.89 | 0.644 | 0.00 | 17.0 | 8.1758 |
| 33 | Gil-0198 | 7/6/2000 | 1,060 | 2 | 19.51 | 0.676 | 0.02 | 0.6 | 0.5395 |
| 34 | Grb-0167 | 4/26/1999 | 3,440 | 2 | 22.51 | 0.746 | 0.30 | 24.9 | 0.3457 |
| 35 | Grb-0172 | 6/22/2004 | 3,040 | 3 | 12.95 | 0.536 | 0.20 | 81.9 | 0.9788 |
| 36 | Grb-0208 | 4/27/1999 | 3,080 | 1 | 23.04 | 0.737 | 0.26 | 62.8 | 0.2998 |
| 37 | Grb-0280 | 5/13/1997 | 2,850 | 1 | 19.84 | 0.707 | 0.02 | 5.5 | 0.0007 |
| 38 | Grb-0281 | 5/12/1997 | 2,600 | 1 | 20.77 | 0.700 | 0.06 | 4.1 | 0.0004 |
| 39 | Grb-0283 | 5/19/1997 | 2,680 | 1 | 16.70 | 0.621 | 1.06 | 7.5 | 0.0000 |
| 40 | Grb-0284 | 6/16/1998 | 3,320 | 1 | 26.48 | 0.818 | 1.13 | 46.5 | 0.0017 |
| 41 | Grb-0285 | 4/27/1999 | 3,500 | 1 | 21.40 | 0.736 | 0.20 | 11.6 | 0.5438 |
| 42 | Grb-0287 | 7/13/2000 | 2,440 | 2 | 21.76 | 0.696 | 0.08 | 13.6 | 0.1831 |
| 43 | Grb-0291 | 3/24/2005 | 3,280 | 3 | 19.46 | 0.688 | 1.77 | 55.0 | 0.0035 |
| 44 | Grt-0106 | 6/25/2003 | 3,600 | 4 | 20.64 | 0.674 | 0.05 | 16.8 | 0.2689 |
| 45 | Har-0170 | 4/11/2005 | 1,600 | 3 | 20.61 | 0.703 | 0.00 | 12.8 | 2.3103 |
| 46 | Har-0173 | 8/16/2005 | 1,300 | 4 | 18.17 | 0.638 | 0.00 | 3.9 | 14.9208 |
| 47 | Har-0175 | 8/17/2005 | 1,400 | 4 | 20.99 | 0.715 | 0.06 | 6.0 | 0.0131 |
| 48 | Har-0176 | 8/17/2005 | 1,460 | 4 | 22.27 | 0.763 | 0.11 | 0.3 | 7.0059 |
| 49 | Hmp-0379 | 6/11/2001 | 1,240 | 4 | 19.89 | 0.744 | 0.58 | 23.8 | 0.0000 |
| 50 | Hmp-0380 | 6/12/2001 | 1,220 | 4 | 22.62 | 0.751 | 0.07 | 13.1 | 0.0000 |
| 51 | Hmp-0382 | 6/13/2001 | 1,220 | 2 | 30.66 | 0.942 | 0.09 | 54.2 | 0.0000 |
| 52 | Hmp-0383 | 6/13/2001 | 1,700 | 4 | 20.33 | 0.727 | 0.07 | 16.4 | 0.0197 |
| 53 | Hnc-0042 | 7/23/2002 | 1,200 | 4 | 21.06 | 0.718 | 0.27 | 9.3 | 0.0022 |
| 54 | Hnc-0046 | 3/16/2005 | 1,260 | 3 | 22.50 | 0.770 | 0.07 | 31.5 | 0.9123 |
| 55 | Hrd-0300 | 6/14/2001 | 1,780 | 4 | 23.11 | 0.743 | 0.08 | 33.4 | 0.0000 |
| 56 | Hrd-0303 | 6/27/2005 | 2,250 | 4 | 22.66 | 0.749 | 0.07 | 10.3 | 0.0019 |
| 57 | Jac-0166 | 5/27/1997 | 960 | 1 | 20.99 | 0.734 | 0.02 | 15.1 | 0.0000 |
| 58 | Jac-0167 | 5/3/2004 | 820 | 4 | 25.63 | 0.813 | 0.10 | 1.2 | 0.0405 |
| 59 | Jac-0168 | 6/14/2004 | 770 | 3 | 21.76 | 0.745 | 0.58 | 0.9 | 0.0000 |
| 60 | Jef-0312 | 4/15/1999 | 480 | 1 | 23.06 | 0.797 | 8.08 | 15.9 | 0.0004 |
| 61* | Jef-0327S | 9/14/2004 | 500 | 4 | 20.67 | 0.701 | 0.37 | 56.3 | 0.0000 |
| 62 | Jef-0579 | 7/15/2002 | 600 | 4 | 18.36 | 0.650 | 5.29 | 75.5 | 0.0000 |
| 63 | Jef-0581 | 7/16/2002 | 540 | 3 | 18.34 | 0.642 | 3.46 | 85.8 | 0.0000 |
| 64 | Jef-0585 | 7/21/2004 | 540 | 4 | 21.17 | 0.691 | 0.06 | 39.5 | 0.0000 |
| 65 | Jef-0590 | 9/16/2004 | 500 | 4 | 20.30 | 0.690 | 0.55 | 67.1 | 0.0000 |
| 66 | Jef-0592 | 7/27/2004 | 540 | 4 | 20.79 | 0.676 | 1.26 | 56.7 | 0.0000 |
| 67 | Jef-0603 | 9/16/2004 | 510 | 4 | 25.74 | 0.797 | 0.06 | 29.3 | 3.3090 |
| 68 | Jef-0641 | 5/20/2004 | 540 | 4 | 24.79 | 0.777 | 0.06 | 42.3 | 0.0000 |
| 69 | Kan-0927 | 5/28/1997 | 1,000 | 1 | 20.62 | 0.722 | 0.04 | 48.0 | 0.0000 |
| 70 | Kan-0928 | 5/29/1997 | 700 | 1 | 20.47 | 0.707 | 0.06 | 2.4 | 1.0421 |
| 71 | Kan-0932 | 5/5/1997 | 1,120 | 2 | 22.14 | 0.729 | 9.11 | 51.2 | 0.0002 |
| 72 | Kan-0934 | 5/6/1997 | 870 | 2 | 16.15 | 0.622 | 0.03 | 30.0 | 4.9371 |
| 73 | Kan-0935 | 5/5/1998 | 1,440 | 1 | 20.37 | 0.699 | 0.08 | 24.5 | 0.0042 |
| 74 | Kan-0938 | 6/22/1998 | 1,580 | 2 | 19.45 | 0.677 | 0.29 | 16.7 | 0.3759 |
| 75 | Kan-0939 | 6/26/2002 | 1,920 | 4 | 15.95 | 0.545 | 0.04 | 3.7 | 37.3493 |
| 76 | Kan-0940 | 7/10/2002 | 1,580 | 4 | 22.85 | 0.723 | 0.09 | 113.0 | 0.3097 |
| 77 | Kan-0941 | 7/11/2002 | 1,520 | 4 | 22.83 | 0.750 | 0.07 | 44.0 | 1.3788 |
| 78 | Lew-0215 | 4/11/2005 | 1,300 | 3 | 21.40 | 0.723 | 0.00 | 11.4 | 0.2589 |
| 79 | Lew-0217 | 3/10/2005 | 1,360 | 1 | 21.05 | 0.775 | 0.00 | 0.5 | 21.1730 |
| 80 | Lew-0221 | 8/15/2005 | 1,280 | 4 | 10.39 | 0.395 | 0.00 | 15.4 | 22.6376 |
| 81 | Lin-0179 | 4/6/1999 | 660 | 2 | 19.47 | 0.637 | 1.66 | 34.7 | 9.9004 |
| 82 | Lin-0180 | 4/5/1999 | 1,000 | 1 | 21.38 | 0.730 | 1.24 | 11.5 | 6.0110 |
| 83 | Lin-0185 | 6/3/2004 | 950 | 3 | 21.22 | 0.735 | 0.13 | 45.4 | 0.0968 |
| 84 | Log-0198 | 4/8/1999 | 1,300 | 1 | 17.02 | 0.558 | 1.89 | 13.6 | 30.1577 |
| 85 | Log-0220 | 7/10/2003 | 1,400 | 4 | 7.75 | 0.317 | 0.00 | 14.7 | 32.4456 |
| 86 | Mal-0407 | 3/16/2005 | 1,160 | 3 | 20.32 | 0.713 | 4.13 | 29.8 | 0.0000 |
| 87 | Mal-0409 | 3/17/2005 | 1,220 | 2 | 20.22 | 0.670 | 0.05 | 20.1 | 0.0025 |
| 88 | Mar-0296 | 6/27/2000 | 1,440 | 2 | 20.40 | 0.687 | 0.08 | 42.7 | 0.0000 |
| 89 | Mas-0917 | 5/11/1999 | 620 | 1 | 19.31 | 0.676 | 0.06 | 28.3 | 0.0000 |
| 90 | Mas-0930 | 4/1/2005 | 780 | 3 | 20.98 | 0.686 | 0.70 | 73.9 | 0.0004 |
| 91 | Mas-0960 | 4/1/2005 | 880 | 3 | 23.11 | 0.773 | 0.00 | 60.3 | 0.1248 |
| 92 | Mcd-0042 | 5/13/1999 | 2,300 | 2 | 5.84 | 0.227 | 0.43 | 18.4 | 55.6290 |
| 93 | Mcd-0048 | 6/17/2004 | 2,280 | 4 | 20.44 | 0.681 | 0.28 | 4.4 | 0.8544 |
| 94 | Mcd-0109 | 5/19/1999 | 2,240 | 2 | 20.36 | 0.680 | 0.31 | 137.4 | 0.7071 |
| 95 | Mcd-0149 | 5/13/1999 | 1,760 | 2 | 3.66 | 0.150 | 0.43 | 14.6 | 68.5010 |
| 96 | Mcd-0202 | 5/12/2004 | 2,080 | 3 | 10.65 | 0.440 | 1.17 | 12.3 | 24.2676 |
| 97 | Mer-0162 | 8/2/2000 | 2,600 | 2 | 27.72 | 0.868 | 0.03 | 19.7 | 0.3902 |
| 98 | Mer-0163 | 7/18/2000 | 2,680 | 2 | 18.27 | 0.635 | 0.00 | 41.3 | 2.0132 |
| 99 | Mig-0140 | 5/18/1999 | 1,800 | 1 | 16.80 | 0.620 | 6.14 | 33.7 | 0.0006 |
| 100 | Mig-0141 | 5/17/1999 | 1,800 | 2 | 11.53 | 0.416 | 0.32 | 8.6 | 47.2949 |
| 101 | Mig-0142 | 5/13/2004 | 1,520 | 4 | 12.13 | 0.535 | 0.60 | 23.7 | 16.8967 |
| 102 | Mig-0143 | 6/23/2005 | 1,450 | 4 | 12.41 | 0.515 | 0.00 | 6.5 | 34.5185 |
| 103 | Min-0168 | 6/24/2003 | 840 | 4 | 32.13 | 0.940 | 1.34 | 52.0 | 0.0142 |
| 104 | Min-0169 | 6/24/2003 | 960 | 4 | 28.58 | 0.903 | 0.14 | 32.9 | 0.0949 |
| 105 | Min-0170 | 6/25/2003 | 860 | 4 | 25.48 | 0.789 | 0.06 | 50.0 | 0.0073 |
| 106 | Min-0171 | 6/26/2003 | 1,960 | 1 | 20.95 | 0.712 | 4.83 | 19.2 | 0.0000 |
| 107 | Mnr-0148 | 7/19/2000 | 2,240 | 2 | 19.02 | 0.653 | 3.18 | 26.0 | 0.0014 |
| 108 | Mnr-0156 | 3/24/2005 | 3,200 | 3 | 22.57 | 0.741 | 0.04 | 2.7 | 0.0063 |
| 109 | Mrg-0086 | 5/19/2004 | 1,020 | 4 | 28.01 | 0.872 | 0.10 | 71.1 | 0.0179 |
| 110 | Nic-0207 | 6/5/1997 | 1,600 | 1 | 21.38 | 0.745 | 0.00 | 37.1 | 0.4314 |
| 111 | Nic-0208 | 6/16/1997 | 2,200 | 1 | 20.95 | 0.739 | 0.03 | 32.3 | 1.9742 |
| 112 | Nic-0209 | 6/8/1998 | 1,880 | 2 | 21.16 | 0.736 | 0.12 | 26.7 | 0.0717 |
| 113 | Nic-0211 | 6/10/1998 | 2,480 | 2 | 16.08 | 0.620 | 0.00 | 37.5 | 5.4159 |
| 114 | Nic-0212 | 5/19/1998 | 1,680 | 2 | 19.17 | 0.688 | 1.84 | 52.3 | 0.0000 |
| 115 | Nic-0213 | 5/28/1998 | 2,200 | 2 | 25.13 | 0.779 | 0.21 | 78.0 | 0.1959 |
| 116 | Nic-0214 | 6/3/1998 | 2,440 | 2 | 20.04 | 0.661 | 0.30 | 83.1 | 0.3831 |
| 117 | Nic-0215 | 6/2/1998 | 2,440 | 2 | 23.88 | 0.819 | 0.00 | 11.6 | 6.2457 |
| 118 | Nic-0217 | 6/12/1998 | 2,520 | 1 | 23.41 | 0.752 | 0.60 | 59.8 | 0.6122 |
| 119 | Nic-0218 | 6/17/1998 | 2,560 | 1 | 18.13 | 0.630 | 3.12 | 198.8 | 0.0000 |
| 120 | Nic-0219 | 6/4/1998 | 2,800 | 2 | 20.77 | 0.718 | 0.23 | 59.0 | 0.2528 |
| 121 | Nic-0220 | 4/28/1999 | 2,120 | 1 | 20.02 | 0.705 | 1.40 | 6.8 | 7.6906 |
| 122 | Pen-0145 | 8/7/2002 | 4,600 | 3 | 21.58 | 0.722 | 0.07 | 0.9 | 0.9386 |
| 123 | Pen-0163 | 7/18/2002 | 2,840 | 4 | 18.36 | 0.656 | 1.59 | 23.2 | 0.0000 |
| 124 | Pen-0164 | 8/6/2002 | 2,840 | 2 | 43.78 | 1.136 | 4.07 | 8.1 | 0.0000 |
| 125 | Poc-0234 | 3/23/2005 | 3,000 | 3 | 22.51 | 0.729 | 0.00 | 7.2 | 1.8904 |
| 126 | Poc-0257 | 5/20/1997 | 3,900 | 1 | 19.87 | 0.706 | 0.11 | 4.8 | 0.0000 |
| 127 | Poc-0262 | 7/11/2000 | 3,360 | 2 | 21.10 | 0.717 | 0.21 | 8.2 | 0.0000 |
| 128 | Poc-0263 | 7/8/2003 | 4,700 | 4 | 21.24 | 0.702 | 0.06 | 3.8 | 0.0000 |
| 129 | Poc-0265 | 7/9/2003 | 3,600 | 3 | 17.12 | 0.623 | 2.78 | 1.4 | 0.0000 |
| 130 | Poc-0266 | 3/23/2005 | 3,680 | 3 | 25.02 | 0.819 | 0.00 | 47.4 | 0.3520 |
| 131 | Pre-0163 | 4/13/2005 | 2,660 | 3 | 18.08 | 0.666 | 8.03 | 52.0 | 0.0009 |
| 132 | Pre-0164 | 4/12/2005 | 3,020 | 3 | 19.46 | 0.680 | 2.70 | 13.0 | 0.0083 |
| 133 | Pre-0166 | 3/8/2005 | 2,840 | 4 | 20.12 | 0.684 | 0.06 | 16.3 | 0.0038 |
| 134 | Pre-0171 | 4/12/2005 | 1,640 | 3 | 19.42 | 0.655 | 0.00 | 27.7 | 0.2865 |
| 135 | Ral-0196 | 3/25/2005 | 2,680 | 3 | 17.77 | 0.652 | 1.32 | 130.1 | 0.0000 |
| 136 | Ral-0220 | 5/13/1997 | 2,850 | 1 | 17.88 | 0.652 | 0.10 | 34.1 | 0.0000 |
| 137 | Ral-0221 | 5/27/1998 | 2,584 | 2 | 15.93 | 0.576 | 0.07 | 77.5 | 0.0000 |
| 138 | Ran-0260 | 3/10/2005 | 4,400 | 3 | 19.19 | 0.657 | 0.26 | 3.7 | 1.2004 |
| 139 | Ran-0275 | 3/7/2005 | 2,120 | 2 | 19.06 | 0.669 | 0.06 | 18.3 | 0.1470 |
| 140 | Ran-0276 | 6/19/2003 | 3,130 | 1 | 5.63 | 0.242 | 0.00 | 0.4 | 44.9857 |
| 141 | Ran-0278 | 7/9/2003 | 2,800 | 3 | 18.22 | 0.639 | 0.16 | 0.6 | 8.5474 |
| 142 | Roa-0093 | 4/11/2005 | 1,000 | 3 | 23.63 | 0.765 | 0.00 | 0.4 | 0.2310 |
| 143 | Sum-0099 | 5/22/1997 | 1,956 | 1 | 19.14 | 0.683 | 0.22 | 28.9 | 0.0004 |
| 144 | Sum-0103 | 6/18/1997 | 2,658 | 1 | 20.13 | 0.685 | 0.09 | 4.7 | 0.0024 |
| 145 | Sum-0105 | 6/18/1998 | 2,380 | 1 | 32.88 | 0.918 | 2.54 | 41.1 | 0.0021 |
| 146 | Tay-0127 | 4/12/2005 | 1,320 | 3 | 24.24 | 0.793 | 0.00 | 25.6 | 0.0473 |
| 147 | Tuc-0124 | 3/9/2005 | 4,260 | 3 | 20.28 | 0.705 | 5.69 | 20.3 | 0.0000 |
| 148 | Tuc-0125 | 3/9/2005 | 3,280 | 4 | 18.66 | 0.670 | 3.01 | 4.0 | 0.0000 |
| 149 | Tyl-0092 | 5/5/2004 | 1,020 | 3 | 30.09 | 0.948 | 8.58 | 9.4 | 0.0000 |
| 150 | Tyl-0093 | 5/6/2004 | 850 | 4 | 20.34 | 0.698 | 0.15 | 99.3 | 0.0002 |
| 151 | Ups-0181 | 3/7/2005 | 2,060 | 4 | 19.90 | 0.691 | 0.13 | 54.2 | 0.0010 |
| 152 | Way-0140 | 3/22/2005 | 1,100 | 3 | 19.76 | 0.683 | 0.00 | 12.6 | 14.4221 |
| 153 | Way-0143 | 3/22/2005 | 1,000 | 3 | 22.43 | 0.786 | 0.00 | 9.3 | 9.7212 |
| 154 | Way-0146 | 3/22/2005 | 1,020 | 3 | 17.63 | 0.650 | 0.00 | 3.7 | 21.9988 |
| 155 | Wet-0111 | 5/3/1999 | 1,220 | 1 | 22.24 | 0.729 | 0.07 | 111.3 | 0.0012 |
| 156 | Wet-0133 | 4/13/2005 | 1,080 | 3 | 15.30 | 0.593 | 0.00 | 0.2 | 7.9887 |
| 157 | Woo-0185 | 5/6/1999 | 700 | 1 | 22.26 | 0.759 | 0.07 | 25.6 | 0.0009 |
| 158 | Woo-0196 | 4/29/1999 | 780 | 1 | 20.03 | 0.687 | 0.06 | 33.2 | 0.0014 |
| 159 | Woo-0213 | 3/15/2005 | 700 | 4 | 18.74 | 0.649 | 1.23 | 23.3 | 0.0226 |
| 160 | Wyo-0060 | 6/6/2001 | 2,240 | 2 | 15.16 | 0.524 | 0.00 | 3.5 | 23.5714 |
| 161 | Wyo-0062 | 6/6/2001 | 2,120 | 4 | 53.98 | 1.124 | 0.14 | 40.1 | 18.2007 |
| 162 | Wyo-0263 | 6/5/2001 | 1,880 | 4 | 13.82 | 0.449 | 0.00 | 16.5 | 34.6053 |
| 163 | Wyo-0265 | 6/7/2001 | 1,800 | 3 | 19.70 | 0.645 | 0.01 | 47.9 | 7.0480 |
| 164 | Wyo-0268 | 6/4/2001 | 1,560 | 1 | 8.37 | 0.322 | 0.00 | 12.8 | 57.4555 |
| 165 | Wyo-0269 | 6/5/2001 | 1,720 | 3 | 13.97 | 0.496 | 0.00 | 15.9 | 35.3647 |
| 166 | Wyo-0270 | 6/7/2001 | 2,520 | 4 | 18.58 | 0.669 | 0.03 | 44.0 | 3.4398 |
| 167 | Wyo-0271 | 6/22/2005 | 1,170 | 4 | 18.00 | 0.645 | 0.00 | 29.5 | 11.8826 |
| 168 | Wyo-0273 | 7/18/2005 | 2,360 | 4 | 19.46 | 0.679 | 0.08 | 27.4 | 0.0000 |
| 169 | Wyo-0274 | 8/2/2005 | 2,050 | 4 | 17.87 | 0.674 | 0.09 | 23.5 | 6.1080 |
| 170 | Wyo-0275 | 8/2/2005 | 1,800 | 4 | 19.33 | 0.679 | 0.00 | 32.6 | 0.5580 |
| 171 | Wyo-0276 | 8/3/2005 | 2,500 | 4 | 18.37 | 0.630 | 0.15 | 38.6 | 2.6887 |
| AccessibilityFOIAPrivacyPolicies and Notices | |
 |
|