Data Series 269
U.S. GEOLOGICAL SURVEY
Data Series 269
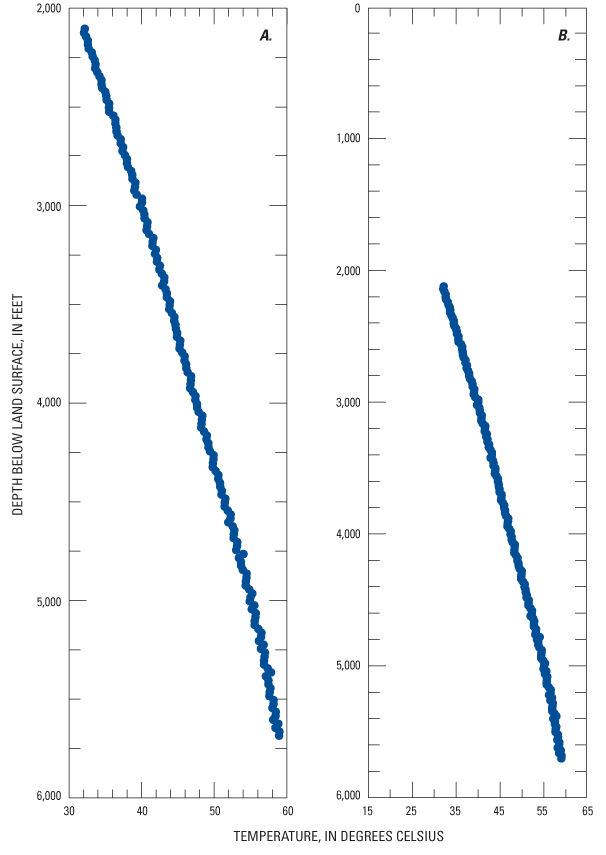
Figure 4. Ground-water temperature profile data, well PM-1 (7543-7858 ft), Nevada Test Site, Nevada, November 3, 2004. The scale chosen for graph A is customized for this well to illustrate detailed changes in temperature with depth. The scale chosen for graph B is standardized to illustrate the relative temperature profile length and change in temperature of this profile when compared to all collected ground-water temperature profiles.

![]() U.S.
Department of the Interior | U.S. Geological
Survey
U.S.
Department of the Interior | U.S. Geological
Survey
Persistent URL: https://pubs.water.usgs.gov/ds269/
Page Contact Information: Publications Team
Page Last Modified: Monday, 28-Nov-2016 12:29:38 EST
