Data Series 340
U.S. GEOLOGICAL SURVEY
Data Series 340
Similar to the previously constructed database, this database integrates datasets obtained from multiple sources: (1) well-log and water-rights databases and pumpage inventories from the Nevada Division of Water Resources (NDWR), (2) data obtained directly from water users, (3) remotely sensed Thematic Mapper (TM) imagery, and (4) estimates of potential evapotranspiration (PET). Together, these datasets are used to develop reasonable estimates of annual ground-water withdrawal from known and approximate well locations (Moreo and others, 2003).
Subsequent to the completion of the previous database, a newer more accurate PET dataset was developed by Flint and Flint (2007) for use in their Basin Characterization Model (BCM). The Flint and Flint (2007) PET dataset was computed using the Priestley-Taylor equation, and compares well to measured rates from 204 weather sites operated by the California Irrigation Management Information System (CIMIS; http://wwwcimis.water.ca.gov) and 26 weather sites operated in Arizona by the Arizona Meteorological Network (AZMET; http://ag.arizona.edu/azmet/). The CIMIS and AZMET networks use the standardized Penman-Monteith reference ET equation (ETo) to calculate PET (Allen and others, 2005). Crop consumptive use, referred to here as crop evapotranspiration (ETc), is the product of ETo and a crop coefficient (Kc) (U.S. Department of Agriculture, 1993):
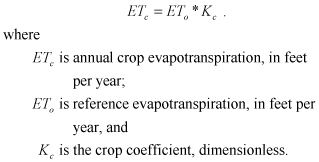 (1)
(1)
PET computed by Flint and Flint (2007) is considered a reasonable surrogate for ETo. A network similar to CIMIS does not exist to estimate ETo in Nevada, thus PET computed by Flint and Flint (2007) is the best available substitute. The advantages of using ETo for the present study are: (1) ETo is thought to be more accurate for estimating water use by irrigated agriculture than the previously applied PET estimates (Shevnell, 1996), and is gaining acceptance as the benchmark equation used by the agricultural community (Allen and others, 2005), and (2) Kc values developed by CIMIS are transferable (Allen and others, 2005), and as a result can be used to estimate ETc in Nevada.
High-water-use crops (primarily alfalfa) accounted for about 95 percent of irrigated acreage from 1999 to 2003. ETc for high-water-use crops was computed as the product of ETo and the average growing season Kc value of 1 developed by CIMIS for alfalfa. The difference between revised and original ETc estimates for high-water-use crops ranged from -0.9 to +0.3 ft/yr (table 1).
The rate at which water is applied by an irrigation system to a crop during a growing season is referred to as the application rate (AR). AR estimates for high-water-use crops based on the revised ETc rates were from 0 to 1.5 ft/yr lower than original estimates (table 1). AR estimates for high-water-use crops in the original and updated databases were based on the following equation (Moreo and others, 2003):
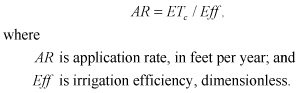 (2)
(2)
Irrigation efficiency (Eff) is the ratio of water beneficially used by a crop to ground water pumped during an irrigation season. Values of Eff were unchanged from those used by Moreo and others (2003); therefore, lower application rate estimates for high-water-use crops in Pahrump Valley and Amargosa Desert were based on lower ETc estimates. The method used to estimate AR for low-water-use crops was unchanged from the original database (Moreo and others, 2003).
The range in AR uncertainty for high-water-use crops in this database (table 1) is narrower to reflect a more reasonable minimum and maximum for model simulations than the range in the previous database (table 1). The uncertainty range in the original database assumed extreme irrigation system efficiencies during the shortest and longest possible growing season (Moreo and others, 2003). The revised AR uncertainty range was based on interviews with local farmers in Pahrump Valley and Amargosa Desert, and on limited metered or measured withdrawals reported in NDWR pumpage inventories from 1959 to 2003.

![]() U.S. Department of the Interior | U.S. Geological Survey
U.S. Department of the Interior | U.S. Geological Survey
URL: https://pubs.usgs.gov/ds/340
Page Contact Information: Publications Team
Page Last Modified: Monday, 28-Nov-2016 13:01:41 EST
