U.S. Geological Survey Data Series 571
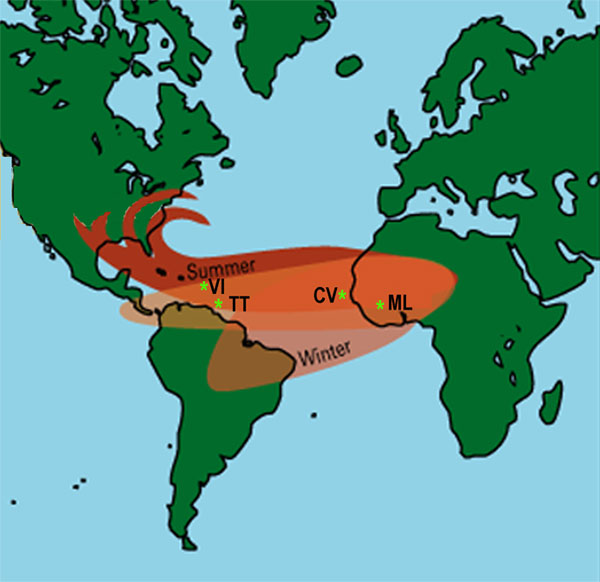 Figure 1. Graphic (not to scale) of African dust transport primarily to South America during winter and to the Caribbean and Eastern United States in summer. General location of sampling sites: Bamako and Kati, Mali (ML); Sal Island, Cape Verde (CV); Galera Point, Trinidad, and Flagstaff Hill, Tobago (TT); and East End, St. Croix, U.S. Virgin Islands (VI). [larger version]
Samples for SOC analysis were collected using samplers similar to those described in Mendez and others (2008). The sampler used high volume blower motors [Amtek 116336-01, 120 volt/8 ampere (120V/8A) and 220V/6A with brushes (2001-2006); brushless Mercury Northland BBA14 222HMB-00, 220V/6A or 110V/12A, 50/60 hertz (Hz) (2006-2008)] with an inline elapsed time and voltage variac (Anderson Model 09911, 220V/8A or 110V/15A). Air (150 to 1,000 m3) was filtered through a prebaked [450600 degrees Celsius (°C) for 8 hours (h)] and pre-weighed 90 millimeter (mm) glass-fiber filter (GFF) in a Teflon holder (Savillex; fig. 2) and two solvent-extracted polyurethane-foam (PUF) plugs contained in a Teflon cartridge (Savillex; fig. 3). Sample media were housed in standard aluminum enclosures (Graseby). Sampling duration varied from 24 to 96 h based on atmospheric dust concentrations and filter loading, quality of electricity, and weather (rainfall). Flow rates were determined using a calibrated glass flowmeter (Gilmont #5 and #6). At the conclusion of sampling, GFFs were folded twice (particles inward) to minimize particle loss, sealed in an aluminum foil pouch, sealed in a resealable plastic bag, and frozen until analysis. Solvent-rinsed stainless steel forceps were used for all GFF handling. PUF cartridges containing SOCs in the operationally defined gas phase were sealed with Teflon caps and placed in clean, resealable plastic bags and frozen until analysis. Field blanks were collected for each type of analysis during each sampling period at each site and handled identically to samples.
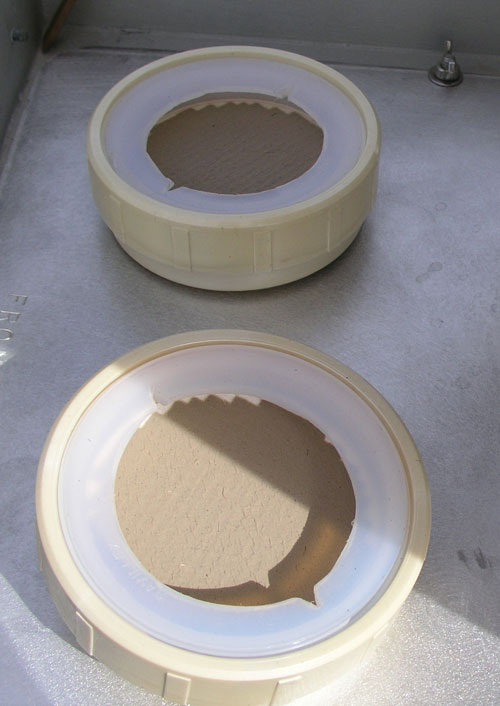 Figure 2. Teflon filter holders with 90 millimeter diameter glass fiber filters covered with dust particles in Kati, Mali. Teflon cartridges containing two in-line polyurethane foam plugs are screwed into the bottom of the Teflon filter holders and are out of view below the floor of the aluminum enclosure in the image. [larger version] |
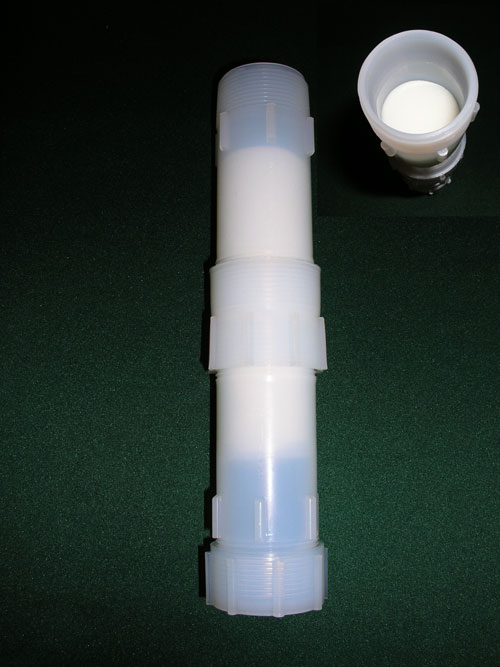 Figure 3. A, Teflon cartridge and two polyurethane foam plugs used to collect gas phase of semivolatile organic compounds in air, downstream of glass fiber filter. B, top PUF in Teflon cartridge. [larger version] |
Air was sampled at downwind sites when wind direction was from the ocean (east), the Navy Aerosol Analysis and Prediction System model (http://www.nrlmry.navy.mil/aerosol_web/Docs/globaer_model.html) indicated Saharan dust, and atmospheric visibility had declined. The presence of Saharan dust was further indicated in the field by reddish-brown particles on filters and was later confirmed by elemental analysis of particles showing a high iron content, lathanum-scandium-thorium ratios within the range of Saharan dust (Muhs and others, 2007), and similar elemental enrichment profiles to Saharan dust (Garrison and others, 2010).
Dry particle deposition samples were collected in an aluminum pail with glass marbles covering the bottom, in an attempt to retain the fine particulate matter under conditions of strong convective storms. Pails and marbles were rinsed with pesticide-grade methanol and allowed to dry prior to sampling. Pails were placed on a clean rooftop to minimize contamination from the ground in Badalabougou, Mali, across the river from Bamako in the Niger River Valley. Dry deposition samples were placed in prebaked glass jars, frozen, and shipped to the analytical laboratory (Denver, CO). Temperatures during collection ranged from 24 to 55 °C.
PUF plugs used from Dec 2001 to April 2005 had greater concentrations of interfering compounds, including flame retardants, in lab blanks. Some retardant and other residues remained after solvent extraction prior to field sampling and interfered with detection of some analytes. All PUF plugs (Tisch Environmental) used as of April 2005 were prepared from flame retardant free foam. Detections of more analytes after April 2005 were due in part to use of this PUF material.
Extraction and analysis of polycyclic aromatic hydrocarbons (PAHs), historical and current-use pesticides, polychlorinated biphenyls (PCBs), and other selected SOCs in the operationally defined particle (collected on the GFFs) and gas (collected on PUF) phases of air samples were conducted by the USGS National Water Quality Laboratory (NWQL) and the Simonich Environmental Chemistry Laboratory, Oregon State University. The SOCs span orders of magnitude in vapor pressure, range in their atmospheric half-lives from hours to months, and exist in the gas, particle, or both phases in the atmosphere. Isotopically labeled surrogates were used by both labs to monitor sample-specific performance during preparation and analysis. The manufacturers, storage conditions, and information for all of the isotopically labeled surrogates and internal standards used by the Simonich Laboratory have been reported previously (Usenko and others, 2005).
Extracts were reduced to about 250 microliters (µl) using nitrogen gas evaporation and transferred into autosampler vials containing an injection internal standard solution of perdeuterated polycyclic aromatic hydrocarbons. Extracts were analyzed by four separate gas chromatography/mass spectrometry (GC/MS) methods to screen for a large number of SOCs (table 1):
Sample components (GFF and two PUFs) from 2003-2004 were extracted together by Accelerated Solvent Extraction (ASE) 300 (Dionex, Sunnyvale, CA) with 35 percent ethyl acetate in hexane at 100 °C (2003) or 80 °C (2004; lower temperature used in an attempt to reduce interferences from heated PUF) using two 20-minute static cycles at 10,342 kilopascals (kPa, 1,500 pounds per square inch). Extracts were reduced to 1 milliliter (mL) by micro-Kuderna-Danish distillation at 75 °C followed by nitrogen gas evaporation. Extracts were quantitatively split and processed as follows in an effort to improved recoveries of selected analytes and provide cleaner extracts for GC/MS. Approximately half the extract was passed through a 0.5 gram (g) CarboPrep SPE column (Restek Corp., Bellefonte, PA) as described in Mendez and others (2008) and analyzed by the Airpest001 and Airpest002 methods above. The remaining extract portion was passed through a 0.5 g Oasis Hydrophilic-Lipophilic Balance (HLB) SPE column (Waters Corp., Milford, MA) and the analytes eluted with 6 mL 20 percent diethyl ether in dichloromethane. The eluent was reduced by nitrogen gas evaporation and solvent exchanged to ethyl acetate to a final volume of about 0.25 mL in a GC vial insert [containing 2,000 nanograms (ng) of 1,4-dichlorobenzene-d4, and perdeuterated naphthalene, acenaphthene, phenanthrene, chrysene and perylene], and analyzed by the Air1433 method. Following addition of dibromooctafluorobiphenyl as an injection internal standard, the extract was analyzed by the AirECNIMS method.
Data provided by the NWQL have not been corrected on the basis of surrogate recoveries. Sample data in this report have been corrected based on amounts in the corresponding field or lab blanks. Detection levels for the GC/MS analyses were estimated from reporting levels (which are twice the method detection limit; Childress and others, 1999) determined for the corresponding water methods, or from instrumental detection levels for the AirECNIMS method (see table 4).
Eighty-four targeted SOCs (table 2) were measured in air samples. The extraction of SOCs from the sampling media was performed using an ASE 300. ASE conditions and solvent compatibility with the sampling media have been tested, and details have been reported elsewhere (Primbs and others, 2008). The extracts were concentrated with a stream of nitrogen using a TurboVap II (Caliper Life Sciences, Hopkinton, MA) and were analyzed using GC/MS-SIM (Genualdi, 2008).
The GC consisted of an Agilent 6890 GC interfaced with an Agilent 5973N mass selective detector. A DB-5ms column [30 meters long, 0.25-mm internal diameter, 0.25-µm thick film, J&W Scientific, USA] was used with an oven temperature program that varied based on the ionization mode (EI or ECNI) of the mass selective detector (Usenko and others, 2005). Details on the GC temperature programs for both electron capture negative ionization (ECNI) and electron impact ionization (EI), as well as the ions monitored, have been reported previously (Usenko and others, 2005). The mode of ionization chosen for each SOC was based on which ionization technique gave the lowest detection limit (Usenko and others, 2005). The instrumental detection limits (IDLs) for both ECNI and EI modes ranged from 0.006 to 6.7 picograms (pg) per microliter (µL, Usenko and others, 2005). Estimated method detection limits (EMDLs) were calculated for each SOC using U.S. Environmental Protection Agency protocols (USEPA, 1996; method 8280; table 4). For a typical air sample, EMDLs ranged from 0.003 to 0.36 pg per m3 in ECNI mode, and 0.012 to 1.08 pg per m3 in EI mode (Genualdi, 2008). All reported concentrations were surrogate recovery corrected and field-laboratory blank corrected.
Analytical data (nanograms of SOC per sample) were (1) surrogate recovery corrected (Simonich lab only) and (2) field-laboratory blank corrected. Measured sample volume (cubic meters) was corrected to volume at standard temperature and pressure (STP; 298 degrees Kelvin, 1 atmosphere) because of differences in ambient temperatures among sites during sampling (21 to 55 °C). Temperature and pressure data are from local airport meteorology stations (Meteorological Terminal Aviation Routine; METAR data). Data for SOCs in air are presented in nanograms per cubic meter for field samples and nanograms per blank (PUF and GFF) for field-laboratory blank samples. Dry deposition sample concentrations are reported in nanograms per gram of collected particles. Estimated minimum detection limits are shown as nanograms per sample (no air volume).
| Airpest001 Method Pesticides by GC/EIMS-SIM |
Airpest002 Method Pesticides by GC/EIMS-SIM |
Air1433 Method Anthropogenic Organic Compounds subset by GC/EIMS--full scan |
AirECNIMS Method Organohalogens by GC/ECNIMS-full scan |
|
|---|---|---|---|---|
| Surrogates | d6-alpha-HCH d10-diazinon |
d6-alpha-HCH d10-diazinon |
decafluorobiphenyl d8-caffeine d10-fluoranthene |
d6-alpha-HCH
decafluorobiphenyl PCB-207 |
| Analytes | 2,6-diethylaniline (P) acetochlor alachlor α-HCH atrazine azinphos-methyl (E) benfluralin butylate (P) carbaryl (E) carbofuran (E) chlorpyrifos 2-chloro-4-isopropylamino- 6-amino-s-triazine (CIAT-; an atrazine and propazine degradate) cis-permethrin cyanazine dacthal desulfinylfipronil desulfinylfipronil amide diazinon dieldrin disulfoton endosulfan I endosulfan II endosulfan sulfate EPTC (P) ethalfluralin (#) ethion ethoprop fipronil fipronil sulfone fipronil sulfoxide fonofos γ-HCH (lindane) linuron malathion methyl parathion metolachlor metribuzin molinate (P) napropamide p,p'-DDE parathion pebulate (P) pendimethalin phorate prometon pronamide propachlor propanil propargite I and II simazine tebuthiuron (R) terbacil (E) terbufos thiobencarb triallate trifluralin (#) |
1,4-napthaquinone (P) 2,5-dichloroaniline (P) 2-aminoisopropylbenzamide 2-chloro2,6diethylacetanilide 2-ethyl 6-methylaniline (P) 3,4-dichloroaniline (P) 3,5-dichloroaniline (P) 3-trifluoromethylaniline 4,4-dichlorobenzophenone 4-chloro 2-methyl phenol 4-chlorobenzylmethyl sulfone (R) bifenthrin cycloate cyfluthrin cypermethrin diazoxon (R) dicofol (E) dicrotophos (R) dimethenamid dimethoate dimethomorph I (E-isomer) dimethomorph II (Z-isomer) disulfoton sulfone disulfoton sulfoxide (R) endosulfan I endosulfan II endosulfan ether endosulfan sulfate ethion ethion monoxon O-ethyl-O-methyl-S- propylphosphorothioate fenamiphos (E) fenamiphos sulfone (E) fenamiphos sulfoxide (E) fenthion fenthion oxygen analog sulfone fenthion sulfone fenthion sulfoxide fonofos oxygen analog hexazinone Iprodione (E) isofenphos λ-cyhalothrin Metalaxyl (R) methidathion methyl paraoxon (R) myclobutanil Oxyfluorfen (R) phorate oxygen analog profenofos prometryn propetamphos propiconazole I (cis) propiconazole II (trans) sulfotep sulfprofos tebuconazole tebupirimphos tebupirimphos oxygen analog tefluthrin terbuthylazine tert-butylphenylcyclohexanol tribufos |
PAHs: anthracene anthraqinone benzo(a)pyrene fluoranthene phenathrene pyrene atrazine bromacil carbaryl chlorpyrifos diazinon metalaxyl metolachlor prometon |
aldrin α-HCH benfluralin (#) beta-HCH chlopyrifos chlorthalonil chlordane cis, trans dacthal (DCPA) δ-HCH dieldrin endosulfan 1 endosulfan 2 endosulfan sulfate endrin endrin aldehyde endrin ketone ethalfluralin γ-HCH (lindane) heptachlor heptachlor epoxide hexachlorobenzene hexachlorocyclopentadiene isodrin mirex nonachlor cis, trans o,p'-DDD o,p'-DDE o,p'-DDT octachlorostyrene oxychlordane p,p'-DDD p,p'-DDE p,p'-DDT pendimethalin pentachloroanisole total PCB Toxaphene trifluralin (#) PCB 118 PCB 138 PCB 153 PCB 174 PCB 180 PCB 183 PCB 187 |
| Electron Impact Ionization | Negative Chemical Ionization | |
|---|---|---|
| Surrogates | d10-fluorene d10-phenanthrene d10-pyrene d12-triphenylene d12-benzo[a]pyrene d12-benzo[ghi]perylene d14-EPTC d10-phorate d5-atrazine d10-diazinon d7-malathion d10-parathion d8-p,p-DDE d8-p,p-DDT d6-methyl parathion d13-Alachlor d11-Acetochlor |
13C12 PCB 101 (2,2,4,5,5-pentachlorobiphenyl) 13C12 PCB 180 (2,2, 3,4,4,5,5-heptachlorobiphenyl) d10-chlorpyrifos d14-trifluralin 13C6-HCB d6-γ-HCH d4-endosulfan I |
| Internal Standards | d10-acenaphthene d10-fluoranthene d12-benzo[k]fluoranthene |
d6 - α - HCH d6 PCB 77 (3,3,4,4-tetrachlorobiphenyl) |
| Analytes | PAHs: acenaphthylene acenaphthene anthracene benz[a]anthracene benzo[b]fluoranthene benzo[k]fluoranthene benzo[ghi]perylene benzo[a]pyrene benzo[e]pyrene chrysene dibenz[a,h]anthracene fluoranthene fluorene indeno[1,2,3-cd]pyrene phenanthrene pyrene retene triphenylene Pesticides and degradation products: o,p-DDD* p,p-DDD o,p-DDE p,p-DDE o,p-DDT* p,p-DDT diazinon and oxon Demeton S disulfoton ethion malathion* parathion and methyl parathion phorate metolachlor* methoxychlor acetochlor* alachlor prometon triallate pebulate EPTC carbofuran carbaryl omethoate propachlor atrazine and degradation products simazine cyanazine |
PCBs: PCB 52 (2,2,5,5-tetrachlorobiphenyl) PCB 74 (2,4,4,5-tetrachlorobiphenyl) PCB 101 (2,2,4,5,5-pentachlorobiphenyl) PCB 118 (2,3,4,4,5-pentachlorobiphenyl) PCB 138 (2,2,3,4,4,5-hexachlorobiphenyl) PCB 153 (2,2,4,4,5,5-hexachlorobiphenyl) PCB 183* (2,2,3,4,4,5,6-heptachlorobiphenyl) PCB 187 (2,2,3,4,5,5,6-heptachlorobiphenyl) Pesticides and degradation products: hexachlorocyclohexanes (HCH) - α*, β, γ-(lindane), and δ chlordanes cis*, trans*, oxy* nonachlor cis, trans heptachlor* heptachlorepoxide* endosulfans - I, II, and sulfate dieldrin aldrin endrin endrin aldehyde hexachlorobenzene dacthal chlorothalonil chlorpyrifos and oxon trifluralin metribuzin Mirex polybrominated diphenyl ethers |
| Current use and banned pesticides | |
|---|---|
| chlordane | trans- and cis- octachloro-4,7-methanohydroindane |
| nonachlor | trans-and cis- 1,4,5,6,7,8,8-heptachloro-3a,4,7,7a-tetrahydro-4,7-methano-1H-indene |
| chlorpyrifos | O,O-diethyl O-3,5,6-trichloro-2-pyridyl phosphorothioate |
| dacthal | (1aR,2R,2aS,3S,6R,6aR,7S,7aS)-3,4,5,6,9,9-hexachloro-1a,2,2a,3,6,6a,7,7a-octahydro-2,7:3,6-dimethanonaphtho[2,3-b]oxirene |
| DDT | o,p- and p,p- dichlorodiphenyltrichloroethane |
| DDE | o,p- and p,p- dichlorodiphenyldichloroethylene |
| DDD | o,p- and p,p- dichlorodiphenyldichloroethane |
| diazinon | diethoxy-[(2-isopropyl-6-methyl-4-pyrimidinyl)oxy]-thioxophosphorane |
| dieldrin | (1aR,2R,2aS,3S,6R,6aR,7S,7aS)-3,4,5,6,9,9-hexachloro-1a,2,2a,3,6,6a,7,7a-octahydro-2,7:3,6-dimethanonaphtho[2,3-b]oxirene |
| endosulfan I (α) | (α isomer) 6,7,8,9,10,10-hexachloro-1,5,5a,6,9,9a-hexahydro-6,9-methano-2,4,3-benzodioxathiepine-3-oxide |
| endosulfan II (β) | (β isomer) 6,7,8,9,10,10-hexachloro-1,5,5a,6,9,9a-hexahydro-6,9-methano-2,4,3-benzodioxathiepine-3-oxide |
| endosulfan sulfate | 6,7,8,9,10,10-hexachloro-1,5,5a,6,9,9a-hexahydro-6,9-methano-2,4,3-benzodioxathiepine-3-oxide sulfate |
| HCH alpha | 1,2,3,4,5,6-hexachlorocyclohexane |
| HCH gamma (lindane) | 1,2,3,4,5,6hexachlorocyclohexane |
| HCB | hexachlorobenzene |
| heptachlor | 1,4,5,6,7,8,8-heptachloro-3a,4,7,7a-tetrahydro-4,7-methano-1H-indene |
| profenofos | O-4-bromo-2-chlorophenyl O-ethyl S-propyl phosphorothioate |
| trifluralin | 2,6-dinitro-N,N-dipropyl-4-(trifluoromethyl)aniline |
| Polycyclic aromatic hydrocarbons | |
| acenaphthene | |
| acenaphthylene | |
| anthracene | |
| anthraquinone | |
| benzo(a)anthracene | |
| benzo(b)fluoranthene | |
| benzo(k)fluoranthene | |
| benzo(a)pyrene | |
| benzo(e)pyrene | |
| benzo(ghi)perylene | |
| chrysene+triphenylene | |
| dibenz(a,h)anthracene | |
| fluoranthene | |
| fluorene | |
| indeno(1,2,3-cd)pyren | |
| phenanthrene | |
| pyrene | |
| retene | |
| 1,3,5-triphenylbenzene | |
| Sentinel polychlorinated biphenyl (PCB) congeners | |
| PCB 101 | 2,2,4,5,5-pentachlorobiphenyl |
| PCB 118 | 2,3,4,4,5-pentachlorobiphenyl |
| PCB 138 | 2,2,3,4,4,5-hexachlorobiphenyl |
| PCB 153 | 2,2,4,4,5,5-hexachlorobiphenyl |
| PCB 174 | 2,2,3,3,4,5,6-heptachlorobiphenyl |
| PCB 180 | 2,2,3,4,4,5,5-heptachlorobiphenyl |
| PCB 183 | 2,2,3,4,4,5,6-heptachlorobiphenyl |
| PCB 187 | 2,2,3,4,5,5,6-heptachlorobiphenyl |
| Laboratory | Foreman | Foreman | Foreman | Simonich | Simonich/Genualdi |
|---|---|---|---|---|---|
| s es | 2001-2002 | 2003 | 2004 | 2003 | 2004-2006, 2008 |
| trans - chlordane | 1.2 | 1.2 | 1.2 | 0.6 | 0.04 |
| cis - nonachlor | 3.0 | 3.0 | 3.0 | 0.6 | 0.01 |
| trans – nonachlor | 1.2 | 1.2 | 1.2 | 0.6 | 0.02 |
| chlorpyrifos | 1.2 | 1.2 | 1.2 | 0.6 | 0.09 |
| dacthal | 0.3 | 0.3 | 0.3 | 0.6 | 0.05 |
| o,p-DDD | 0.5 | 0.5 | 0.5 | 0.6 | 0.31 |
| p,p-DDD | 0.5 | 0.5 | 0.5 | 0.6 | 0.70 |
| o,p-DDE | 0.25 | 0.25 | 0.25 | 0.6 | 0.33 |
| p, p-DDE | 0.5 | 0.5 | 0.5 | 0.6 | 0.21 |
| o, p-DDT | 0.7 | 0.7 | 0.7 | 0.600 | unk |
| p, p-DDT | 0.5 | 0.5 | 0.5 | 0.6 | 0.50 |
| diazinon | 5 | 5 | 5 | 0.6 | 0.26 |
| dieldrin | 7 | 7 | 7 | 0.6 | 0.18 |
| endosulfan I | 1.1 | 1.1 | 1.1 | 0.6 | 0.16 |
| endosulfan II | 2 | 2 | 2 | 0.6 | 0.24 |
| endosulfan sulfate | 5 | 5 | 5 | 0.6 | 0.03 |
| HCH, alpha | 2 | 2 | 2 | 0.6 | 0.24 |
| HCH, gamma (Lindane) | 2 | 2 | 2 | 0.6 | 0.27 |
| heptachlor | 10 | 10 | 10 | 0.6 | unk |
| hexachlorobenzene | 0.3 | 6 | 0.5 | 0.6 | 0.00 |
| profenofos | 15 | 15 | 15 | na | na |
| trifluralin | 5 | 1.5 | 1.5 | 0.6 | 0.09 |
| acenaphthene | na | na | na | 0.6 | 0.22 |
| acenaphthylene | na | na | na | 0.6 | 0.11 |
| anthracene | 40 | 40 | 40 | 0.6 | 0.19 |
| anthraquinone | 80 | 80 | 240 | na | na |
| benzo(a)anthracene | na | na | na | 0.6 | 0.07 |
| benzo(b)fluoranthene | na | na | na | 0.6 | 0.13 |
| benzo(k)fluoranthene | na | na | na | 0.6 | 0.22 |
| benzo(a)pyrene | 60 | 60 | 60 | 0.6 | 0.21 |
| benzo(e)pyrene | na | na | na | 0.6 | 0.19 |
| benzo(ghi)perylene | na | na | na | 0.6 | 0.16 |
| chrysene+Triphenylene | na | na | na | 0.6 | 0.13 |
| dibenz(a,h)anthracene | na | na | na | 0.6 | 0.29 |
| fluoranthene | 25 | 6 | 6 | 0.6 | 0.11 |
| fluorene | na | na | na | 0.6 | na |
| indeno(1,2,3-cd)pyrene | na | na | na | 0.6 | 0.18 |
| phenanthrene | 100 | 20 | 20 | 0.6 | 0.12 |
| pyrene | 20 | 4 | 4 | 0.6 | 0.03 |
| retene | na | na | na | 0.6 | 0.35 |
| 1,3,5-triphenylbenzene | na | na | na | 0.6 | 0.22 |
| PCB 101 (penta) | 5 | 5 | 5 | 0.6 | unk |
| PCB 118 (penta) | 2 | 2 | 2 | 0.6 | unk |
| PCB 138 (hexa) | 1.6 | 1.6 | 1.6 | 0.6 | 0.08 |
| PCB 153 (hexa) | unk | unk | unk | 0.6 | 0.06 |
| PCB 174 | 1 | 1 | 1 | na | na |
| PCB 180 | 1 | 1 | 1 | na | na |
| PCB 183 | 1 | 1 | 1 | 0.6 | 0.03 |
| PCB 187 (hepta) | 1 | 1 | 1 | 0.6 | 0.02 |

![]() U.S. Department of the Interior | U.S Geological Survey
U.S. Department of the Interior | U.S Geological Survey
URL:
methods.html
Page Contact Information: Feedback
Page Last Modified: Monday, 28-Nov-2016 15:49:03 EST
